Available online at: http://pen.ius.edu.ba
A predictive model for liver disease progression based on logistic
regression algorithm
Ahmad Shaker Abdalrada1, Omar Hashim Yahya2, Abdul Hadi M. Alaidi3, Nasser Ali Hussein4, Haider TH. Alrikabi5, Tahsien Al-Quraishi6
1
Department of Software Engineering, Faculty of Computer Science and Infromation Technology, Wasit University, Iraq.
2
North Technical University, Iraq.
3
Department of Software Engineering, Faculty of Computer Science and Infromation Technology, Wasit University, Iraq.
4
Department of Computers, College of Education for Pure Sciences, Wasit University, Iraq.
5Department of Electrical Engineering, Faculty of Engineering, Wasit University, Iraq. 6
Department of Software Engineering, Faculty of Computer Science and Infromation Technology, Wasit University, Iraq.
Article Info ABSTRACT
Received March 13, 2019
Liver disease counts to be one of the most prevalent diseases in the worldwide. Therefore, this paper is aim to address the problem of predicting liver disease progression. As the existing predictive models focus on predicting the label of disease; the probability of developing the disease is still obscure. This paper, therefore, has proposed a model to predict the probability occurrence of liver diseases. The proposed predictive model used logistic regression abilities to predict the probability of liver disease occurrence. ILPD dataset was used to analyze the performance of the model. The predictive model has shown outstanding performance with a prediction accuracy rate of 72.4%, the sensitivity of 90.3%, the specificity of 78.3 %, Type I Error of 9.7 %, Type II Error of 21.7 %, and ROC of 0.758%. The model has furthermore confirmed the feasibility of the laboratory tests such as as (Age; Direct Bilirubin (DB), Alamine_Aminotransferase (SGPT), Total_Protiens (TP), Albumin (ALB))to predict the disease progression. The predictive model will be helpful to patients and doctors to realize the progression of the disease and make a suitable timely intervention.
Keyword:
Liver Disease Progression, Prediction,
Logistic Regression, Machine Learning.
Corresponding Author: Ahmad Shaker Abdalrada
Department of Software Engineering
Faculty of Computer Science and Information Technology , Wasit University , Iraq Email: [email protected]
1. INTRODUCTION
Liver disease (hepatic disease) is any disease that harmfully affects the regular, healthy performance of the liver. It considers as a significant risk factor for mortality and morbidity rates, which significantly impacts the patient quality of life. For example, a study that followed 11,448 subjects for 5 years showed that the incidence of a disease was 12% (n = 1,418) [1]. Another cohort study followed 77,425 free of liver disease subjects for 4.5 years, 10,340 of them have developed the disease [2]. In general, more than 75% of liver tissue requires to be affected before the function of the liver is decreased [3]. There are several symptoms indicts to liver diseases such as fatigue, jaundice, sickness, puke, pain in the back, and abdominal, fluid in the abnormal cavity, general itching, and weight loss [4]. Many factors such as genes, viruses, drugs, snuffing of dangerous gases, alcohol, eating of contaminated food, and pickles are contributed in developing the disease[5]. Obesity, Cholesterol or triglycerides are also related to liver damage. Chemicals and minerals, or infiltrated by abnormal cells, such as
cancer cells are also could cause damage to the Liver Tissue [3]. It is therefore essential to perform a timely diagnosis of the disease to prevent the occurrence or decrease the possible risks consequences.
Though there have been extensive researches done to provide a definitive therapeutic approach for liver diseases, however there is no definitive method to predict the disease progression has been developed so far. Moreover, the efficacy of antiviral treatment to prevent the progression of disease in patients with chronic hepatitis B and cirrhosis or advanced fibrosis is obscure [6]. Many studies have been carried out to diagnose liver disease using blood tests combined with various risk factors [7-14]. Although there have been some excellent results from these models, the disease's progression remains obscure. This study, therefore, aims to handle this gap. This has a significant impact on health-care specialists to provide timely intervention and increase patient awareness.
Machine learning is one of the fields of computer science, employ algorithms of computer to find patterns in data, as well as help in predicting various outcome depend on the used data [15]. Such algorithms have appeared as a reliable methods for estimation and decision-making in the various fields of real life [16]. As a result of the availability of medical data, such algorithms have a significant contribution to medical decision making [17, 18]. Using machine learning capabilities to develop an efficient predictive model would serve as valuable assistance to identify the disease and make a real-time effective medical decision.
In this paper, we develop a seamless model that will help to predict the occurrence of liver disease. The proposed predictive model is based on the logistic regression method. The model predicts the likelihood of liver disease occurrence based on blood tests. Our main contributions are as follow:
Develop a predictive model can predict the probability of liver disease occurrence. Investigate the significance of the included tests in the predicting of disease.
We analyzed the performance of the proposed predictive model using ILPD dataset.
The outline of this study is as follows: Section 2 reviews the existing related works. Section 3 explains the proposed predictive model. Analysis of the proposed predictive model, results are presented in Section 4. At the end, we present the conclusion in section 5.
2. Related Works
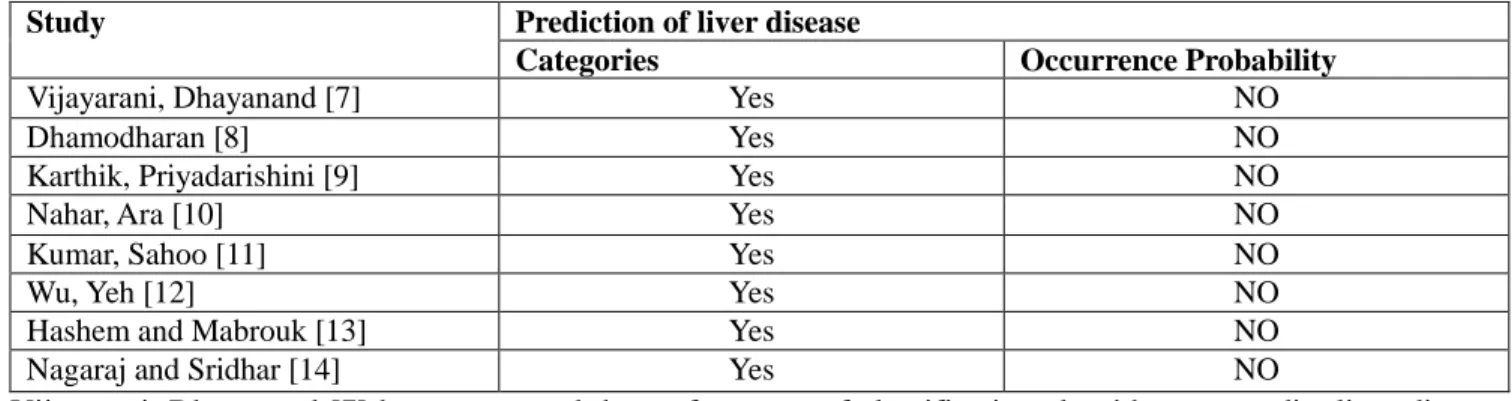
In this section, relevant prior works about liver disease prediction are reviewed as presented in Table 1. Table 1: Reviews of the different works of diagnosing Liver's disease.
Study Prediction of liver disease
Categories Occurrence Probability
Vijayarani, Dhayanand [7] Yes NO
Dhamodharan [8] Yes NO
Karthik, Priyadarishini [9] Yes NO
Nahar, Ara [10] Yes NO
Kumar, Sahoo [11] Yes NO
Wu, Yeh [12] Yes NO
Hashem and Mabrouk [13] Yes NO
Nagaraj and Sridhar [14] Yes NO
Vijayarani, Dhayanand [7] have compared the performance of classification algorithms to predict liver diseases. The compared algorithms in this work were Naïve Bayes (NB) and support vector machine (SVM). The experimental results showed that the SVM is a superior classifier than the Naïve Bayes to predicting the liver diseases. “Another work has been proposed to predict the three major types of the disease such as Liver cancer, Hepatitis, and Cirrhosis using the notable symptoms [8]”. To achieve this study Naïve Bayes and FT Tree
outstanding the FT Tree algorithm in the accuracy measure. Karthik, Priyadarishini [9] applied a soft computing method to identify the liver disease. The authors have applied the method in three phases. In the first phase, the Artificial Neural Network (ANN) classification algorithm was used to classify liver disease. In the second phase, the rules of classification were produced using Learn by Example (LEM) algorithm implemented in rough set rule induction whereas the third phase was used to identify the types of liver disease using fuzzy rules. “Different work by [10] has proposed to measure the performance of many decision tree (DT) methods then compare their achievement in predicting liver disease. The methods that used in this study were J48, LMT, Random Forest (RF), Random tree (RT), REPTree, Decision Stump (DS), and Hoeffding Tre. The result of the comparison showed that DS overcome the other used methods with the high accuracy. “Kumar, Sahoo [11] has also proposed a rule-based model combine with various machine learning techniques to predict the diverse types of the disease. The techniques were Rule Induction (RI), Naive Bayes (NB), Decision Tree (DT), Support Vector Machine (SVM), and Artificial Neural Network (ANN). “The proposed model combines with decision tree (DT) showed better result among all the other methods (RI, SVM, ANN, and NB). “Another work by [12] developed and compared the performance of different machine learning methods in order to predict Fatty liver disease (FLD). “The evaluated methods were (ANN), (RF), (NB), and logistic regression (LR)”. The result of the study revealed that (RF) showed outstanding result than other methods. “Hashem and Mabrouk [13] evaluate the performance of Support vector machine to classify patients of the liver disease using two datasets with diverse tests combinations such as SGOT, SGPT, and Alkaline Phosphates”. A hybrid model has proposed [14] by to diagnose liver disease known as NeuroSVM model using SVM and feed-forward artificial neural network (ANN).
Despite the excellent performance of the proposed models in the literature [7-12, 14], these models, however, did not handle the problem of predicting the probability of LIVER DISEASE occurrence. Also, the models are more general, where they have proposed to predict the categories of the disease (e.g., healthy, or patient). More specific, they did not show the progress of the disease of each patient.
3. The Framework of the Predictive Model
This section illustrates the predictive model to predict of the probability of liver disease incidence. Figure 1 elaborates the steps of building the predictive model in this study.
Figure 1: A graphical explanation of the predictive model.
In this section, we introduce the predictive model that we proposed to predict the probability of liver disease occurrence . The model is readily to run with various platforms and tools such as the R language. It can provide both specialists and patients with a clear vision about the disease progress. Consequently, knowing the degree of
the disease progress facilitates the planning of timely intervention as well as creates greater awareness about the disease’s risk.
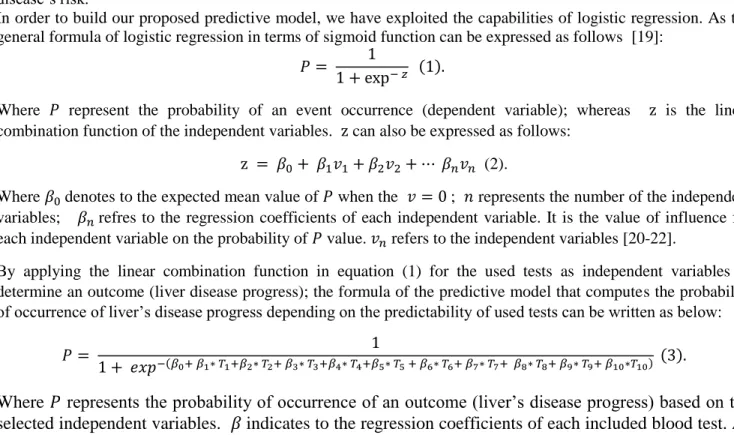
In order to build our proposed predictive model, we have exploited the capabilities of logistic regression. As the general formula of logistic regression in terms of sigmoid function can be expressed as follows [19]:
Where represent the probability of an event occurrence (dependent variable); whereas is the linear combination function of the independent variables. can also be expressed as follows:
(2).
Where denotes to the expected mean value of when the ; represents the number of the independent variables; refres to the regression coefficients of each independent variable. It is the value of influence for each independent variable on the probability of value. refers to the independent variables [20-22].
By applying the linear combination function in equation (1) for the used tests as independent variables to determine an outcome (liver disease progress); the formula of the predictive model that computes the probability of occurrence of liver’s disease progress depending on the predictability of used tests can be written as below:
Where
represents the probability of occurrence of an outcome (liver’s disease progress) based on the
selected independent variables.
indicates to the regression coefficients of each included blood test. As
for (
,
,
,
,
) refer to the included tests (
“
Age , Gender ,Total Bilirubin (TB) ,
Direct Bilirubin (DB) , Alkaline Phosphatase (ALKPHOS) ,Alamine_Aminotransferase(SGPT),
Aspartate Aminotransferase(SGOT), Total_Protiens(TP), Albumin, Ratio of Albumin and Globulin
(A/G)
”
) respectively. The description of each blood test is presented in the dataset section.
Table 2. The analysis of logistic regression for all tests.
Test β P value Odds
Ratio Confidence interval (%) Intercept -3.605 0.000 0.027 (Age) 0.018 0.004 1.018 1.006- 1.031 (Gender M) 0.031 0.8 1.031 0 .654- 1.628 (Total Bilirubin) 0.011 0.8 1.011 0 .853 - 1.199 ( Direct Bilirubin) 0.45 0.05 1.568 0 .977- 2.517 (Alkaline Phosphatase) 0.001 0.1 1.001 1.000- 1.003 (Alamine_Aminotransferase) 0.012 0.01 1.012 1.002 - 1.022 (Aspartate Aminotransferase) 0.002 0.4 1.002 0 .996 - 1.009 (Total_Protiens) 0.927 0.01 2.528 1.197 - 5.339 (Albumin) -1.695 0.02 0.184 0 .042 - 0.795 (Albumin_and_Globulin_Ratio) 1.808 0.1 6.099 0 .652 - 57.063
Later, logistic regression was used to calculate the coefficients of the covariates. Table 2 presents the outcome of applying logistic regression using covariates as independent variables and liver disease as the dependent variable. As evident from Table 2, some of the covariates have a significant association with the disease (P < 0.05) and therefore, have been included in the predictive model whereas insignificant variables have been disregard. After that, logistic regression was used again to calculate the coefficients of the involved variables (showed significant association in table 2) as presented in table 3.
Table 3. The analysis of logistic regression for the involved variables
Test β P value Odds Ratio Confidence Interval (%)
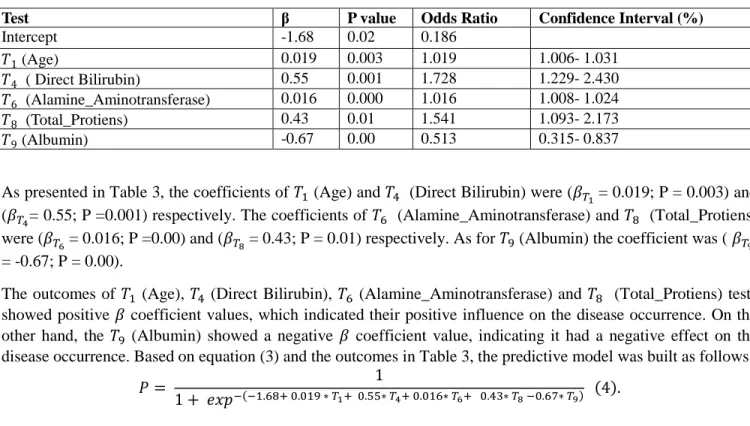
Intercept -1.68 0.02 0.186 (Age) 0.019 0.003 1.019 1.006- 1.031 ( Direct Bilirubin) 0.55 0.001 1.728 1.229- 2.430 (Alamine_Aminotransferase) 0.016 0.000 1.016 1.008- 1.024 (Total_Protiens) 0.43 0.01 1.541 1.093- 2.173 (Albumin) -0.67 0.00 0.513 0.315- 0.837
As presented in Table 3, the coefficients of (Age) and (Direct Bilirubin) were ( = 0.019; P = 0.003) and ( = 0.55; P =0.001) respectively. The coefficients of (Alamine_Aminotransferase) and (Total_Protiens) were ( = 0.016; P =0.00) and ( = 0.43; P = 0.01) respectively. As for (Albumin) the coefficient was ( = -0.67; P = 0.00).
The outcomes of (Age), (Direct Bilirubin), (Alamine_Aminotransferase) and (Total_Protiens) tests showed positive coefficient values, which indicated their positive influence on the disease occurrence. On the other hand, the (Albumin) showed a negative coefficient value, indicating it had a negative effect on the disease occurrence. Based on equation (3) and the outcomes in Table 3, the predictive model was built as follows:
After constructing the predictive model of liver disease based on the significant association variables, if new tests from the clinic are gained, for example, it is possible to use the predictive model to calculate the probability of liver disease occurrence.
The following cases are examples of applying the predictive model to determine the probability of liver’s disease. Assuming the following involving tests for patient A are ( (Age) = 65; (Direct Bilirubin) = 0.1; (Alamine_Aminotransferase) = 16; (Total_Protiens) = 6.8; (Albumin) = 3.3); Patient B are ( (Age) = 74;
(Direct Bilirubin) = 0.4; (Alamine_Aminotransferase) = 22; (Total_Protiens) = 8.1; (Albumin) = 4.1) and Patient C are ( (Age) = 45; (Direct Bilirubin) = 0.2; (Alamine_Aminotransferase) = 21; (Total_Protiens) = 5.7; (Albumin) = 2.5).
By applying equation (4) with the tests of the three patients, the probability of developing liver's disease of patient A can be calculated as follows:
Whereas the probability of patient C developing liver's disease can be calculated as follows
4. The Evaluation of the Predictive Model
We conducted an analysis and evaluation of the proposed predictive model. In this section, the dataset, experimental setup and the metrics used are presented.
4.1 Experimental Setup
All experiments were accomplished by SPSS version 20.0 (SPSS, Inc., Chicago, IL, USA) and R language on PC with Intel Core 5, CPU 3.4 GB, 16GB RAM running Windows 10 operating system. Various measures such as accuracy, sensitivity, specificity and confusion matrix measurements calculated to assess accomplishment of the predictive model.
Following is the description of the evaluation measures used in the current paper: For validation, we employed 10-fold validation (CV) to obtain a balanced evaluation of the generalization error. The 10-fold cross-validation (CV) divided the entire dataset into 10 sub-sets randomly: 9 sub-sets were employed for training stage (90%), and the remaining sub-set was exploited in testing stage (10%). This procedure is then repeated ten times with replacement in the tested folds. “The standard measurements such as accuracy, sensitivity, specificity, Type I Error and Type II Error were calculated to evaluate the performance of the predictive model”.
4.2 Dataset
In this study, a real well-known Indian Liver Patient Dataset (ILPD) used. ILPD is a public dataset existing in the Machine learning repository (UCI). The data collected in Andhra Pradesh region, India. ILPD contains 583 instances with various tests as listed in table 4. The dependent variable was stated depend on these tests. As result 416 cases were with liver disease and 167 cases were healthy. The information of the used data is presented in table 4.
Table 4. ILPD description
Test Description
Age Age of the patient
Gender Male or Female
TB Total Bilirubin
DB Direct Bilirubin
ALKPHOS Alkaline Phosphatase
SGPT Alanine Aminotransferase
SGOT Aspartate Aminotransferase
TP Total of Proteins
ALB Albumin
A/G Ratio of Albumin and Globulin
4.3 Performance Metrics
The area under the curve (AUC) which is also known as receiver operating characteristic curve (ROC) is used to assess the achievement of the predictive model for the current study. The ROC curve is an essential tool that is used for diagnose test evaluation. What follows below is a description of the evaluation measures applied in the current study:
Sensitivity: represents the number of participants correctly predicted with a positive disease.
Specificity: depicts the number of participants correctly diagnosed with a negative disease.
Accuracy: exposes the total number of participants correctly predicted with a positive and negative disease.
Type I Error (α): the probability of diagnosing patients into a control group.
Type II Error: represents the probability of diagnosing control subjects with the patient group.
5. Result
In this section, the experimental results and discussions are presented. Table 5 displays the confusion matrix of the predictive model. As is evident in the confusion matrix, the model has achieved predictive accuracy of 72.4%. The model has correctly predicted 381 patient out of 416 while 41 out of 167 healthy participants. This performance is achieved because of that all the included tests are significantly associated with the disease (P < 0.05).
Table5. Shows the confusion matrix
Class Healthy Patient
Healthy 126 41
Patient 35 381
The sensitivity achieved by the predictive model was 90.3 %, which refers to the number of patients that are correctly identified with a positive disease. In meanwhile, the obtained specificity by the model was 78.3 %. As for Type I Error, and Type II Error of the predictive model, they were 9.7 % and 21.7% respectively. This demonstrates that the model can be efficiently employed to predict the probability of liver disease occurrence.It is also possible to exploit such a model with different health conditions.
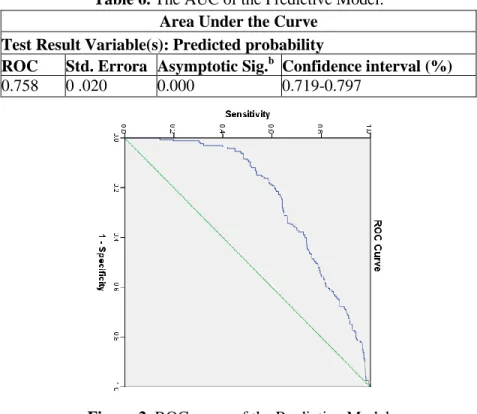
Table 6. The AUC of the Predictive Model. Area Under the Curve
Test Result Variable(s): Predicted probability
ROC Std. Errora Asymptotic Sig.b Confidence interval (%)
0.758 0 .020 0.000 0.719-0.797
Figure 2. ROC curve of the Predictive Model
Figure 2 clarifies the ROC curves of the predictive model and the details as listed in Table 6.As illustrated in Table 6, the ROC of the predictive model is 0.758% with a 95% confidence interval (0.719-0.797). Also, ROC is significantly different from 0.5 since P value (Asymptotic Significance) is < 0.05 meaning that the proposed predictive model has predicted the group significantly better than by chance.
6. Conclusion
This paper is presented a model to predict the probability of liver’s disease occurrence. The analysis and evaluation of the proposed model show that it is very efficient and easy to implement and use. The model provides high accuracy (72.4%), sensitivity (90.3 %) and specificity (78.3 %) as well as very good stability (0.758 %). This makes the model suitable for use by the healthcare providers to facilitate the planning of timely intervention and also creates greater awareness of the risk of the disease. The predictive model also confirmed that laboratory tests such as (Age; Direct Bilirubin (DB), Alamine_Aminotransferase (SGPT), Total_Protiens (TP), Albumin (ALB)) were significant predictors of the categories of liver disease. Thus the model can be used by healthcare providers if they have the results of the conducted tests. It can be suggested for monitoring the progress of liver disease, for example, implementing as a tool for web-based and mobile phone. This study, however, has limitations of feasibility and resource constraints. The small size of the sample, for example, may be raised as limitations of the present study; the sample would be more representative if more information from liver patients are collected. In the future, therefore we aim to increase the number of patients as well as using various tests. References
[1] T. C. ‐. Yip et al, "Laboratory parameter‐based machine learning model for excluding non‐alcoholic fatty liver disease (NAFLD) in the general population," Alimentary Pharmacology & Therapeutics, vol. 46, (4), pp. 447-456, 2017.
[2] W. Li et al, "Multiparametric ultrasomics of significant liver fibrosis: A machine learning-based analysis," European Radiology, vol. 29, (3), pp. 1496-1506, 2019.
[3] S. Rashid, A. Ahmed, I. Al Barazanchi, A. Mhana, and H. Rasheed, “Lung cancer classification using data mining and supervised learning algorithms on multi-dimensional data set,” Period. Eng. Nat. Sci., vol. 7, no. 2, pp. 438–447, 2019, 2016.
[4] S Sindhuja, D., and R. Jemina Priyadarsini. "A survey on classification techniques in data mining for analyzing liver disease disorder." International Journal of Computer Science and Mobile Computing 5, no. 5, pp. 483-488.
[5] S. Rashid, A. Ahmed, I. Al Barazanchi, and Z. A. Jaaz, “Clustering algorithms subjected to K-mean and gaussian mixture model on multidimensional data set,” Period. Eng. Nat. Sci., vol. 7, no. 2, pp. 448–457, 2019.
[6] N. Venkateswaran, A. Shekhar, and S. Changder, “Using machine learning for intelligent shard sizing on the cloud,” Period. Eng. Nat. Sci., vol. 7, no. 1, pp. 109–124, 2019.
[7] C. Fernández Carrillo et al, "Treatment of hepatitis C virus infection in patients with cirrhosis and predictive value of model for end‐stage liver disease: Analysis of data from the Hepa‐C registry," Hepatology, vol. 65, (6), pp. 1810-1822, 2017.
[8] S. Rashid, A. Ahmed, I. Al Barazanchi, A. Mhana, and H. Rasheed, “Lung cancer classification using data mining and supervised learning algorithms on multi-dimensional data set,” Period. Eng. Nat. Sci., vol. 7, no. 2, pp. 438–447, 2019.
[9] B. Lykiardopoulos et al, "Development of Serum Marker Models to Increase Diagnostic Accuracy of Advanced Fibrosis in Nonalcoholic Fatty Liver Disease: The New LINKI Algorithm Compared with Established Algorithms," PloS One, vol. 11, (12), pp. e0167776-e0167776, 2016.
[10] S. Liu et al, "Discriminating between adaptive and carcinogenic liver hypertrophy in rat studies using logistic ridge regression analysis of toxicogenomic data: The mode of action and predictive models," Toxicology and Applied Pharmacology, vol. 318, pp. 79-87, 2017.
[11] H. R. Bdulshaheed, Z. T. Yaseen, and I. I. Al-barazanchi, “New approach for Big Data Analysis using Clustering Algorithms in Information,” Jour Adv Res. Dyn. Control Syst., vol. 2, no. 4, pp. 1194–1197, 2019.
[12] H. Ma et al, "Application of Machine Learning Techniques for Clinical Predictive Modeling: A Cross-Sectional Study on Nonalcoholic Fatty Liver Disease in China," BioMed Research International, vol. 2018, pp. 4304376-9, 2018.
[13 H. Hagström et al, "Fibrosis stage but not NASH predicts mortality and time to development of severe liver disease in biopsy-proven NAFLD," Journal of Hepatology, vol. 67, (6), pp. 1265, 2017.
[14] M. Pons et al, "Basal values and changes of liver stiffness predict the risk of disease progression in compensated advanced chronic liver disease," Digestive and Liver Disease, vol. 48, (10), pp. 1214-1219, 2016.
[15] Y. Xie et al, "Evaluation of a logistic regression model for predicting liver necroinflammation in hepatitis B e antigen‐negative chronic hepatitis B patients with normal and minimally increased alanine aminotransferase levels," Journal of Viral Hepatitis, vol. 26, (S1), pp. 42-49, 2019.
[16] K. R. Bisaso et al, "A comparative study of logistic regression based machine learning techniques for prediction of early virological suppression in antiretroviral initiating HIV patients," BMC Medical Informatics and Decision Making, vol. 18, (1), pp. 77-77, 2018.
[17] M. A. Konerman et al, "Assessing risk of fibrosis progression and liver-related clinical outcomes among patients with both early stage and advanced chronic hepatitis C," PloS One, vol. 12, (11), pp. e0187344-e0187344, 2017.
[18] S. Petta et al, "Metabolic syndrome and severity of fibrosis in nonalcoholic fatty liver disease: An age‐dependent risk profiling study," Liver International, vol. 37, (9), pp. 1389-1396, 2017.
[19] S. Saokaew et al, "Clinical risk scoring for predicting non‐alcoholic fatty liver disease in metabolic syndrome patients (NAFLD‐MS score)," Liver International, vol. 37, (10), pp. 1535-1543, 2017.
[20] I. Al Barazanchi, S. A. Hamid, R. A. Abdulrahman, and H. Rasheed, “Automated telemedicine and diagnosis system ( ATDS ) in diagnosing ailments and prescribing drugs,” Period. Eng. Nat. Sci., vol. 7, no. 2, pp. 888–894, 2019.
[21] T. Hayashi et al, "Noninvasive Assessment of Advanced Fibrosis Based on Hepatic Volume in Patients with Nonalcoholic Fatty Liver Disease," Gut and Liver, vol. 11, (5), pp. 674, 2017.
[22] M. A. Konerman et al, "Machine learning models to predict disease progression among veterans with hepatitis C virus," PloS One, vol. 14, (1), pp. e0208141-e0208141, 2019.