MODELLING THE URBAN MICROCLIMATE AND ITS INFLUENCE
ON BUILDING ENERGY DEMANDS OF AN URBAN
NEIGHBOURHOOD
J. Allegrini1,2; J. Kämpf3; V. Dorer1; J. Carmeliet1,21: Empa, Laboratory for Building Science and Technology, Dübendorf, Switzerland 2: ETHZ, Chair of Building Physics, Zürich, Switzerland
3: EPFL, LESO, Lausanne, Switzerland
ABSTRACT
In the past decades the portion of the population living in urban areas has continuously increased. Due to the high building density, the microclimate in urban areas changed significantly compared to rural areas. The temperatures measured in urban areas are, due to the urban heat island (UHI) effect, higher compared to the rural temperatures. The UHI intensities are increasing with higher building densities and growing cities. Space cooling and heating demands of buildings are strongly affected by the local microclimate at the building sites. Due to the climate change and the limited energy resources, energy saving and sustainability are nowadays important issues. A significant part of the global energy consumption is used for space cooling and space heating of buildings. Thus its minimization for buildings in urban areas has great energy saving potential.
Most building energy simulation (BES) models were developed for stand-alone buildings and therefore do not consider effects of the urban microclimate. This can lead to inaccurate predictions of the space cooling and heating demands for buildings in urban areas. The aim of this paper is to investigate the urban microclimate and its potential influence on the energy demand of buildings in an urban context by conducting detailed flow, radiation and building energy simulations at the urban neighborhood scale. CitySim is used for the radiation and building energy simulations. In CitySim detailed radiation models for solar and longwave radiation are implemented that can account for the radiation exchange between neighbouring buildings. The flow around the buildings is modelled by running CFD (computational fluid dynamics) simulations using OpenFOAM. As a result it is shown, how the temperatures and wind speeds can strongly differ within different urban areas. Further an approach is presented, to consider the local microclimate in the building energy simulation tool CitySim.
Keywords: Urban microclimate, Urban heat island effect, Building energy simulations, CFD
INTRODUCTION
Energy demand predictions for buildings in an urban context have to account for heat fluxes at several scales, considering interactions between surrounding buildings at local scale as well as urban heat island (UHI) effects at micro- and mesoscale [1]. Akbari et al. 1992 [2] reported that for US cities the peak electricity loads increase by 1.5 – 2 % for a temperature increase of 1 °F. As compared to an isolated building, a building in an urban area experiences (i) increased maximum air temperatures due to the urban heat island effect, (ii) lower wind speeds, and consequently reduced convective heat exchange, due to wind-sheltering effect, (iii) lower energy losses during the night due to reduced sky view factors, (iv) changed solar heat gains due to shadowing and a modified radiation balance. All these effects have an important impact on the energy demand of buildings [3-5], as they affect the conductive heat
transmission through the envelope, the energy exchange by means of ventilation [6] and the potential to employ passive cooling by night-time ventilation. Further the buildings influence the local microclimate in the urban area, because they change the local wind flow conditions and increase the local air temperatures. This shows that the local microclimate and the energy demand predictions of buildings have to be analysed in a coupled way. The changed local microclimate not only influences the energy demand of buildings, but also has an impact on the human comfort and health in urban areas.
In this study building energy simulations for a group of 14 buildings are conducted with CitySim [7]. For four weather conditions with high temperatures (high cooling loads), the surface temperatures determined with CitySim, accounting for detailed longwave and solar radiation exchange between the buildings, are used as boundary conditions for the CFD simulations. With CFD detailed temperature and velocity fields around the buildings are determined. These local air temperatures and wind speeds are then used for the building energy simulations of buildings in urban areas. In a second part of this paper an approach is presented to produce more accurate climatic data with CFD simulations, which can improve the energy demand predictions of building energy simulations.
NUMERICAL MODEL
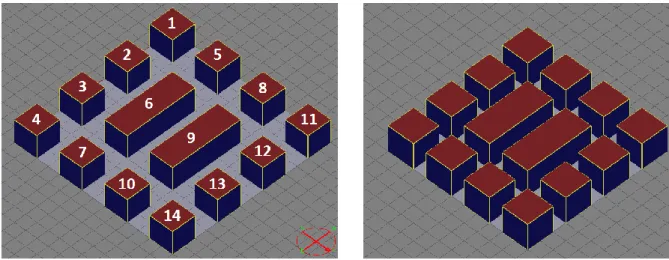
The building energy simulations are conducted with CitySim for the climate of Zürich (Switzerland). CitySim is a simulation tool which models the energy fluxes from a small neighbourhood to an entire city. It includes a radiation model based on Perez All Weather [8] and Simple Radiosity Algorithm [9] to compute the hourly irradiation on the building surfaces. In this paper 14 office buildings are studied (Figure 1). The buildings have a height (H), a width (W) and a length (L) of 10 m, except buildings 6 and 9, which are 30 m or 25 m long depending on the cases. Two cases are studied with different distance (D) between the buildings to analyse the influence of the building density on the urban microclimate. The first case has an aspect ratio (H/D) of 1 and the second case an aspect ratio of 2. Each building consists of four thermal zones. Each thermal consists of one exterior building wall and a quarter of the buildings volume. The four zones are connected in such a way that they have the same inside air temperature. Space heating and space cooling are used to keep the inside air temperatures between 23 °C and 26 °C. The building walls have a glazing fraction of 25 % and a short wave reflectance of 50 %. The outside surfaces of the walls are made of bricks for simplicity. Therefore buildings with rather moderate surface temperatures are modelled here. Modern highly glazed office buildings using highly reflecting solar shadings will lead to significantly higher surface temperatures and influence the urban microclimate even more.
For four weather conditions with rather high ambient temperatures CFD simulations are conducted with OpenFOAM (Table 1). These weather conditions are considered to be critical for space cooling.
Wind speed Wind direction Air temperature
Weather condition 1 0.3 m/s Normal 25.2 °C
Weather condition 2 5.5 m/s Normal 25.5 °C
Weather condition 3 0.6 m/s 45 ° 27.2 °C
Weather condition 4 4.7 m/s 45 ° 25.9 °C
Table 1: Different studied weather conditions (Normal: Wind flow normal to large facades of buildings 6 and 9; 45 °: Wind direction with an angle of 45 ° between the wind direction and the surface normal of the large facades of buildings 6 and 9.).
Steady 3D RANS (Reynolds-Averaged Navier-Stokes) CFD simulations are conducted with a k-turbulence model. For the near-wall modelling wall functions are used to limit the computational costs. The possible overestimation of the convective heat flux at the building facades due to using wall functions is assumed to be smaller than the influence of different weather conditions on the urban heat island intensity. The aim of this study is not a detailed quantification of the urban heat island intensity, but presenting importance of the urban heat island effect and how it can be modelled with CFD. A structured grid is built based on a grid sensitivity analysis. At the inlet of the computational domain vertical atmospheric boundary layer profiles of the mean horizontal wind speed, the turbulent kinetic energy and the turbulence dissipation rate are imposed. At the inlet the air temperature is set equal to the temperature from the meteorological data for the condisered weather condition. At the ground and building surfaces the temperature from the BES are imposed. To model buoyancy the Boussinesq approximation is applied.
RESULTS
First the wind flow between the buildings is studied in more detail. The wind speeds around the buildings are needed to determine the convective heat fluxes at the building surfaces. For BES commonly the wind speeds from meteorological data are used for the determination of the convective heat transfer. However in urban areas these commonly used correlations are not correct, because they are based on measurements of stand-alone buildings.
Figure 3: Contour plot of wind velocity 5 m above the ground for weather condition 2 (top) and 1 (bottom). Left: Aspect ratio 1; Right: Aspect ratio 2. Arrow indicates the wind direction.
Figure 3 shows contour plots of the wind speed for weather conditions 1 and 2. For weather condition 2 with high wind speeds, it can be observed that flow is accelerated around the buildings. For the first row of buildings there is also acceleration between the buildings, but further downstream the flow is slower between the buildings. For the determination of the convective heat transfer, different transfer coefficients have to be used for the different buildings. The convective heat losses are significantly lower for the buildings further downstream. The wind speeds are decreasing with higher building densities. For weather condition 1 the wind speeds are decreased to a lesser extent. For these low wind speeds the flow is mainly driven by buoyancy, what changes the flow fields and the wind flow between the buildings is less dependent on the approach flow.
Figure 4: Contour plot of wind velocity 5 m above the ground for weather condition 4. Left: Aspect ratio 1; Right: Aspect ratio 2. Arrow indicates the wind direction.
Figure 4 shows the same contour plots for oblique wind flow directions. It can again be observed that the wind speed between the buildings is decreased. Further it can be seen that now the wind is flowing along the street canyon, in contrast to Figure 3, where the approach flow is normal to the street canyon and a vortex is generated inside the street canyon.The flow along the street canyon increases the removal of heat and increases the convective heat transfer at the building facades. It can be concluded that the wind flow around buildings in urban areas is complex and the convective heat transfer cannot be predicted only as a parameter of the wind speed of the approach flow. Either CFD simulations or local measurements are needed to accurately model the convective heat transfer for BES simulations.
From the same simulations the air temperature increase in an urban area, caused by the heated building surfaces due to absorption of solar radiation, is studied. In Figure 5 air temperature differences between the approach flow and the air inside a street canyon (between building 6 and 9) is presented for different weather conditions and different building geometries. As a first conclusion, it can be seen that the local heat island intensities can be modelled with CFD. Further it can be seen that the local heat island intensities for the chosen weather conditions can be up to 2.5 °C. This is a significant temperature increase that causes directly higher space cooling demands. Three parameters were varied in this study (wind speed, wind direction and building density). The results show that there is a complex interaction between these parameters. A higher building density decreases the solar gains inside the street canyon. This would lead to lower air temperatures. But at the same time, it also lowers the wind speed and therefore the removal of heat from the street canyon. Figure 5 shows that for weather condition 1 the shadowing effect is dominant compared to the effect of the wind. Therefore the air temperatures for the wider street canyon are higher. For weather condition 2 on the other hand, the effect of the wind is stronger and higher temperatures can be found in the narrower street canyon. For weather conditions 3 and 4 the wind direction is oblique to the
street canyon and therefore the wind can remove more heat by flowing along the street canyon. Here we can again see a stronger effect of the wind compared to the shadowing and therefore the temperatures inside the street canyons are higher for narrower street canyons. This shows that local heat island intensity cannot be predicted by analysing the three parameters independently. Therefore we propose to run CFD simulations with surface temperatures as obtain from BES as input to predict the air temperatures.
Figure 5: Temperature difference between the local air temperature on the red line (at 5 m above the ground) and the inlet temperature for the different weather conditions (Table 1) and aspect ratios (AR).
OUTLOOK
In the previous section we showed the importance of accounting for the urban microclimate, when simulating the space cooling and heating demands for buildings in urban areas. Here we give an outlook on an approach that will be used for CitySim simulations to consider the urban microclimate. Because the buildings and the local microclimate strongly influence each other, models for the urban microclimate and the building have to be conducted in a coupled way. The computational costs are much higher for CFD than for BES. Therefore the number of CFD simulations needs to be minimized. Figure 6 sketches an approach to model the interaction between the buildings and the urban microclimate. First a BES is conducted to get realistic temperature boundary conditions for the CFD simulations. Then for limited number of weather conditions CFD simulations are conducted. With CFD more accurate convective heat transfer coefficients (CHTCs) are determined and used for a second BES. Final CFD simulations with updated surface temperatures are used to analyse the urban microclimate. The CHTCs are again updated for the final BES to study the energy demands.
CONCLUSION
In this study the urban microclimate was modelled using CFD (computational fluid dynamics) and BESs (building energy simulations). BESs were used to model the surface temperatures and the radiative fluxes that the building surfaces. CFD simulations were conducted to model the wind flow around the buildings and the air temperatures in a small urban area. The results show there is a complex interaction between the buildings and the local microclimate. There is a large number of parameters that influences the local microclimate leading to local heat islands and complex wind flow structures, which need to be considered in BESs. The complex interaction makes it impossible to use simple rule of thumb to predict the influence of the neighbouring buildings, when conducting BES for a specific buildings. Therefore we propose here an approach to conduct CFD and BESs in a simplified coupled way to improve the predicted space cooling and space heating demand of buildings by BESs and the prediction of the local microclimate in an urban area.
ACKNOWLEDGEMENTS
Funding by the Swiss Federal Office of Energy (project no. 154 143), EU Climate-KiC (Project Smart Urban Adapt) and CCEM (Project Urban Multi-scale Energy Modelling) is gratefully acknowledged.
REFERENCES
1. Rasheed, A.: Multiscale Modelling of Urban Climate, PhD thesis 4531, EPF Lausanne, 2009.
2. Akbari, H., Davis, S., Dorsano, S., Huang, J.,Winett, S.: Cooling our communities – a guidebook on tree planting and light colored surfacing. US Environmental Protection Agency, 1992.
3. Santamouris, M., Papanikolaou, N., Livada, I., Koronakis, I., Georgakis, C., Argiriou, A., Assimakopoulos, D.N.: On the impact of urban climate on the energy consumption of buildings. Solar Energy, Vol 70, pp 201-216, 2001.
4. Kolokotroni, M., Giannitsaris, I., Watkins, R.: The effect of the London urban heat island on building summer cooling demand and night ventilation strategies. Solar Energy, Vol 80, pp 383-392, 2006.
5. Allegrini, J., Dorer, V., Carmeliet, J.: Influence of the urban microclimate in street canyons on the energy demand for space cooling and heating of buildings. Energy and Buildings, Vol 55, pp 823-832, 2012.
6. Ghiaus, C., Allard, F., Santamouris, M., Georgakis, C., Nicol, F.: Urban environment influence on natural ventilation potential. Building and Environment Vol 41, pp 395-406, 2006.
7. Robinson D., Haldi F., Kämpf J., Leroux P., Perez D., Rasheed A., Wilke U.: CitySim: comprehensive micro-simulation of resource flows for sustainable urban planning. Proc. of eleventh international IBPSA Conference, Glasgow, Scotland, 2009.
8. Perez R., Seals R., Michalsky J.: Allweather model for sky luminance distribution - preliminary configuration and validation. Solar Energy Vol 50 (3), pp 235-243, 1993. 9. Robinson D., Stone A.: Solar radiation modelling in the urban context. Solar Energy Vol