ULTRA LOW POWER INDOOR AIR QUALITY
MONITORING SENSOR NETWORK
D.M.G. Preethichandra, Central Queensland University
(email: preethi@ieee.org)
Abstract
This research aimed to measure the air quality of built environment continuously and provide a continuous stream of information for seamless controlling of HVAC in building automation systems. Further this ultra-low power design enables provide vital air quality information under emergency and hazardous conditions even without grid power for a reasonable time. The proposed system has carbon dioxide, carbon monoxide, propane and methane sensors. This network uses a hardware platform available in the market with industrial grade gas sensors to develop the sensor nodes. The concept was verified with actual parameter measurements under different real life situations. The results reveal that the domestic indoor air quality is extremely poor compared to what is expected for quality living environment.
Keywords: Air quality, sensor networks, low power sensor network, gas sensor, online monitoring
1. Introduction
Indoor air quality monitoring is an essential part of built environment control systems to ensure the indoor environment is in an acceptable condition for living. The process of indoor air quality monitoring involves different technologies namely actual gas sensing, sensor networking, data mining and decision making. There are many prior work on this topic from different points of approach, but this paper focuses on ultra low power operation of sensor network for indoor air quality measurements (A. Somov. et. al. (2011), J.Y. Kim et. al. (2007), Wongchoosuk, C, et. al. (2012)). Accurate measurement of gas concentrations is the key of air quality monitoring. However, this has to be within the budget of the monitoring system as well. Therefore it is common to select only a number of target gases and sacrifice a bit from the accuracy to bring down the budget while getting data within an acceptable resolution.
Online air quality monitoring can be used in many different applications ranging from quality of life improvement to military operations. Occupancy monitoring is a typical application where the number of occupants is estimated from the amount of carbon dioxide detected in a given environment. This information may be used to effectively control the heating, ventilation and air conditioning(HVAC) system in the building or may be used to remotely spy on the population in the room(Zhenyu Han et. al. (2012)). However the military usage is out of scope of this research and this paper mainly focuses on use of online gas concentration monitoring only for civil purposes. This paper mainly focuses on monitoring air quality to improve the living condition of built environments and gather information in disaster management situations. Carbon dioxide, carbon monoxide, methane and propane are the most common gases of interest in built environments. Carbon dioxide is added to the environment in moderate quantities from respiration under normal situations and in excessive quantities from fire under hazardous conditions. Carbon monoxide is mainly added to the built environment from automobiles. A common source of methane is the common garbage collected at designated areas adjacent to the building. Propane is mainly from cooking and heating gas lines. Any of these gases may be life threatening if gone above the accepted range for a considerable period of time. Therefore continuous monitoring of each of them is vital in indoor air quality monitoring system.
2. Thick film metal oxide gas sensors
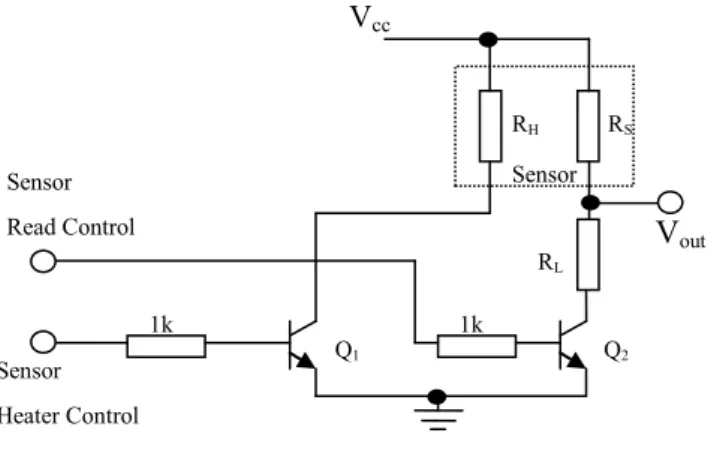
Semiconductor gas sensors are very common in industrial gas monitoring systems where the gas concentration is represented by an electrical parameter. A common type of gas sensors is thick film semiconductor gas sensor where the semiconductor substrate resistance is varied dependent on the amount of target gas presence. In this research a series of semiconductor thick film type gas sensors with good selectivity has been used for the target gasses. The manufacturer, Figaro(Japan) prescribes precise control signals to the sensor in order to obtain accurate measurements. The sensor consists of two major parts, namely the heater and the sensor substrate. The substrate has two terminals and its resistance is measured as a representation of the amount of gas in the environment while the heater provides the stabilized temperature needed for the measurement. Figure 1 shows the recommended setting for the measurement
where the heater control signal and sensor measurement signal are coming from the sensor node microcontroller while the sensor resistance is read by the same microcontroller.
Figure 1. Schematic diagram of thick film gas sensors and control circuit.
The manufacturer’s specification provides the heater turn on timing and sensor resistance read timing. For example, the carbon monoxide sensor (TGS2442) has a 14ms heating pulse in every second and a 5ms read-control signal immediately after the heater pulse is off. The actual read should occur at the middle of the read-control pulse, in other words 2.5ms after the read-control pulse is on.
If the current through RS is iS, heater resistance is RH, and Sensor Resistance is RS, when the Q2
is turned on by read control pulse,
𝑉𝑜𝑢𝑡 = 𝑖𝑆𝑅𝐿+ 𝑉𝐶𝐸(𝑄2) − − − (1) 𝑅𝑆= 𝑉𝐶𝐶 − 𝑉𝑜𝑢𝑡 𝑖𝑆 − − − (2) 𝑅𝑆= 𝑉𝐶𝐶 − 𝑉𝑜𝑢𝑡 𝑅𝐿 𝑉𝑜𝑢𝑡 − 𝑉𝐶𝐸(𝑄2) − − − (3)
The value of sensor resistance can be calculated from the equation 3 using Voutvalue read from
the sensor circuit. The microcontroller looking after this sensor sends the heater and read control signals at required intervals and the analog to digital converter(ADC) of the microcontroller converts the Voutvoltage into a digital quantity and stored in microcontroller’s memory. Then
the RS/R0 is used in conjunction with manufacturer’s datasheet to obtain the target gas
concentration where R0 is the resistance of the sensor substrate at a known gas concentration.
Sensor resistance RS is dependant on the ambient temperature and humidity. To have an
accurate measurement of gas concentrations, the two parameters have also to be measured. The chosen Libelium Waspmote hardware platform has a built in temperature monitor and the humidity sensor has to be integrated on to the sensor module. Further, the sensor control module has a software programmable real time clock which will be useful if a particular node of the sensor is to be programmed to activate at desired time intervals of the day. Moreover, when the
Vcc Sensor Read Control V out Sensor Heater Control RH RS RL 1k Sensor 1k Q1 Q2
network become highly populated with large number of nodes and the links become busier, then the time stamp from each node will be very useful. Since this real time clock is software programmable, the base station can synchronize all the nodes to its clock easily.
3. Sensor node design
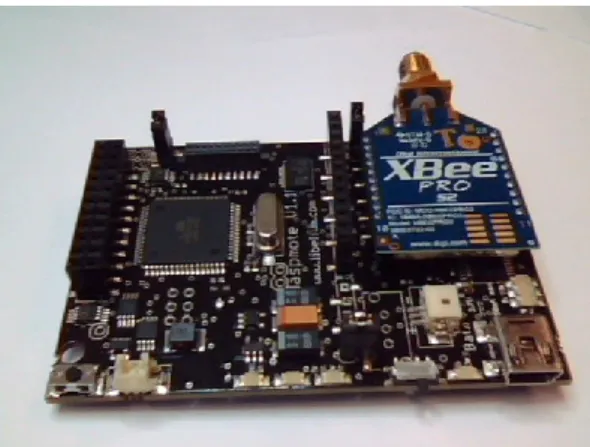
The intended sensor node design consists of several modules controlled by a microcontroller. the main modules are RF module, control module, sensor module and power module. The RF communication was handled through ZigBee protocol using a XBEE module from Digi International. Figure 2 illustrates the RF communications module with 2dB antenna which can communicate over 200m line of site distance, which is more than enough for indoor operations.
Figure 2. RF transmission module
One of the main objective of this research is to develop a microcontroller based ultra low power sensor node to gather information on indoor air quality. However, in the first phase, we decided to utilize a ready to use sensor node available in the market as proof of concept. The sensor control module prototype has been designed with a Waspmote hardware module available from Libelium Communications. Figure 3 shows this hardware fitted with the RF module.
The selected sensor control module has a built in power control circuit which recharges a battery either from USB or from a solar panel of 12V. The control system also provides provisions for eight analog ports which can be configured as inputs or outputs individually, and eight digital I/O pins. These were used to implement the control and data busses to communicate with the sensor module. The sensor module consists of carbon dioxide, carbon monoxide, methane and propane gas sensors integrated into it.
Figure 4. Sensor node schematic diagram
Figure 4 illustrates the block diagram of the designed sensor node. A separate node without the sensor module act as the base station or the gateway to the host computer. Each RF module has a 16digit IP address and they can be configured to have a common network ID or different network IDs. Depending on the requirement these nodes can be reprogrammed to change the network topology. Only the last six digits change from RF module to RF module and any particular sensor node using a RF module with known IP address can directly be addressed without disturbing the other nodes in the neighbourhood.
Under the current configuration all network nodes in the network have the same network ID making the RF communications local to the network. The base station is connected to a PC via USB port and the measurement data are fed into a database in the PC. However the base station can send data via RF link to another node connected to a remote PC in a different geographical locations for emergency conditions.
The network topology selected for the initial testing network is the star topology with auxiliary multiple hop links to find a lost node in case of repetitive direct communications problems. This situation is a common scenario in built environment as objects may come in between two RF modules blocking their line of sight. If the obstructing object acts as a RF signal absorber then the direct link will be lost. Therefore the network is programmed in a way that the established network links are tested for a predefined number of times for transmission and if not successful the base station will send a command to adjacent nodes to relay the message to the missing node. Control Module Power Module Microcontroller RF Module Data Control Sensor Module
3.1 Power consumption
Power consumption is not a major issue as long as the built environment is connected to the power grid where these sensors can directly be fed from it. However, indoor gas condition monitoring is vital in emergency evacuation situations where the mains power may be cut off under high danger situations or by the emergency itself. Each sensor node has its own rechargeable battery which getting charged from the mains power when available, and automatically switches to battery power whenever the mains power is cut off. The chosen Wasp mote sensor hardware can seamlessly transfer from mains to battery, therefore no rebooting will occur during the changeover. An ultra low-power sensor network node is vital in such situations where it can sense and send information on indoor air quality for a longer time without mains power for disaster management team to make correct decisions.
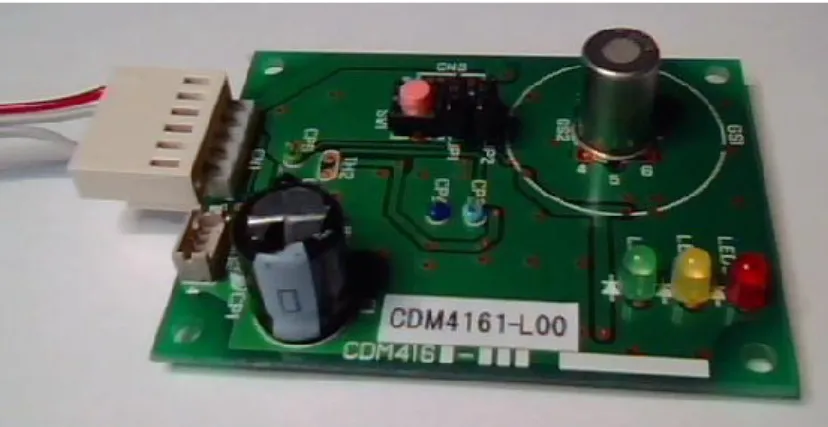
Figure 5. The Carbon Dioxide sensor module
However, the manufacturer recommends that the gas sensor in the sensors module needs to be heated-up for more than two hours before taking reliable readings. Therefore this module has to be powered up continuously, but the average power consumption is very small as the heater pulse is a 50mA, 14ms pulse in every 1000ms. The recommended heater current for the CO2
sensor TGS4161 is 50mA. Therefore the average heater power is 3.5mW. If it has four sensors of similar order it needs only 14mW of continuous power to keep them in the thermally stabilized state where an accurate gas concentration measure is possible at any time. However the CO2 module used at this stage has a comprehensive integrated circuit with its own
microcontroller and it needs 300mW of power. This module is used only at the proof of concept stage and will be replaced by author’s design for combinational sensors module in the next stage with less power consumption. Figure 5 shows the CO2 gas sensor module from Figaro, used in
the first stage of the project.
4. Implementation
The first stage of proposed sensor network was implemented using Libelium Waspmote sensor nodes with gas sensors from Figaro. Each sensor node is programmed to measure the target gas concentration in real time and transmit measured value upon receiving a request from the base station. Individual node will autonomously measure the gas concentrations at set time intervals
and store them against real time in a local database. They will be transferred to the base station when interrogated by the base station and the successfully transmitted data will be deleted from the local database.
As mentioned earlier the base station will activate direct links to individual sensor node in a round robin single-cast pattern, however it may use multicast transmission commands to recover a missing node in the network. If a particular sensor node has difficulties for direct RF communications with the base station for a prolonged time, the base station will send an alarm to system administrator to look in to the matter.
In the first stage of the project a carbon dioxide sensor module was used with a sensor node to measure indoor CO2 concentrations in a bedroom during the night time. The sensor node
measures CO2 concentration at every 20 seconds and sends measurement data to the base station
upon an interrogation over the RF link using ZigBee protocol. The selected bedroom is 4mx4m in size and all windows were closed for two hours without any occupants before starting the measurements. The sensor node was placed 1.5m above the ground closed to the wall opposite to the bed head. Room fan was not operated during the night.
5. Results and discussion
Figure 6. CO2 concentration measured in a bedroom overnight
Figure 6 shows the measured CO2 concentration in the selected bedroom during the night from
7:00pm to 6:00am. The graph clearly shows that the CO2 concentration is in the range of
400ppm, which is the standard concentration in clean air, before the occupants were accommodated. It starts to rise at a lower rate when the occupants were in but still the door was open while the windows were closed. The next section of the graph shows a linear increment in CO2 concentration when all the openings to the room were closed while the occupants were
morning. It can be clearly seen that the fresh air from outside has brought down the CO2
concentration rapidly when the windows and door were open. The couple of sharp spikes shown on the graph are due to the operator go close to the sensor node to check the operating conditions and breathing out at very close proximity to the sensor.
Even though the occupants didn’t notice it and got used to this condition for a long time, the carbon dioxide concentration is more than four tines the normal and well above the permissible level for healthy living. This measurement data can be used to activate ventilation system in an automated HVAC system to provide fresh air. Therefore this kind of continuous air condition monitoring will be an essential integrated part in future built environment systems to ensure a good quality of living.
The proposed sensor node will have ultra-low power consumption under normal operating conditions and will be able to provide gas concentrations for a considerable time even when disconnected from the grid power supply and this will be an added advantage of this sensor network in order to obtain built environment air quality information under emergency conditions.
References
A. Somov., A. Baranov, A. Savkin, D. Spirjakin, A. Spirjakin, and R. Passerone(2011) “Development of wireless sensor network for combustible gas monitoring”, Sensors and Actuators A: Physical, Vol.171, Issue 2, 398-405
J.Y. Kim, T.Z. Shin, and M.K. yang(2007) “ Design of a Smart gas Sensor System for Room Air-Cleaner of Automobile(Thick-Film metal Oxide Semiconductor gas Sensor)”, Journal of Electrical Engineering and Teechnology, Vol.2, Issue 3, 408-412
Wongchoosuk, C, Khunarak, C., Lutz, M., and Kerdcharoen, T.(2012) “WiFi electronic nose for indoor air monitoring”, 9th International Conference on Electrical Engineering/Electronics, Computer, Telecommunications and Information Technology (ECTI-CON), 1-4
Zhenyu Han, Gao, R.X., and Zhaoyan Fan(2012) “Occupancy and indoor environment quality sensing for smart buildings”, Instrumentation and Measurement Technology Conference (I2MTC), 882-887