PYROLYSIS OF SUGARCANE
PYROLYSIS OF SUGARCANE
PYROLYSIS OF SUGARCANE
PYROLYSIS OF SUGARCANE
BAGASSE
BAGASSE
BAGASSE
BAGASSE
by
Thomas Johannes Hugo
Thesis submitted in partial fulfilment of the requirements for the Degree
of
MASTER OF SCIENCE IN ENGINEERING
(CHEMICAL ENGINEERING)
in the Department of Process Engineering
at the University of Stellenbosch
Supervised by
Prof. J.H. Knoetze
Prof. J.F. Görgens
STELLENBOSCH
December 2010
iii
Declaration
I, the undersigned, hereby declare that the work contained in this thesis is my own original work and that I have not previously in its entirety or in part submitted it at any university for a degree.
……….. ……….
Signature Date
Copyright © 2010 Stellenbosch University All rights reserved
iv
v
Abstract
The world’s depleting fossil fuels and increasing greenhouse gas emissions have given rise to much research into renewable and cleaner energy. Biomass is unique in providing the only renewable source of fixed carbon. Agricultural residues such as Sugarcane Bagasse (SB) are feedstocks for ‘second generation fuels’ which means they do not compete with production of food crops. In South Africa approximately 6 million tons of raw SB is produced annually, most of which is combusted onsite for steam generation. In light of the current interest in bio-fuels and the poor utilization of SB as energy product in the sugar industry, alternative energy recovery processes should be investigated. This study looks into the thermochemical upgrading of SB by means of pyrolysis.
Biomass pyrolysis is defined as the thermo-chemical decomposition of organic materials in the absence of oxygen or other reactants. Slow Pyrolysis (SP), Vacuum Pyrolysis (VP), and Fast Pyrolysis (FP) are studied in this thesis. Varying amounts of char and bio-oil are produced by the different processes, which both provide advantages to the sugar industry. Char can be combusted or gasified as an energy-dense fuel, used as bio-char fertilizer, or upgraded to activated carbon. High quality bio-oil can be combusted or gasified as a liquid energy-dense fuel, can be used as a chemical feedstock, and shows potential for upgrading to transport fuel quality. FP is the most modern of the pyrolysis technologies and is focused on oil production. In order to investigate this process a 1 kg/h FP unit was designed, constructed and commissioned. The new unit was tested and compared to two different FP processes at Forschungszentrum Karlsruhe (FZK) in Germany. As a means of investigating the devolatilization behaviour of SB a Thermogravimetric Analysis (TGA) study was conducted. To investigate the quality of products that can be obtained an experimental study was done on SP, VP, and FP.
Three distinct mass loss stages were identified from TGA. The first stage, 25 to 110°C, is due to evaporation of moisture. Pyrolitic devolatilization was shown to start at 230°C. The final stage occurs at temperatures above 370°C and is associated with the cracking of heavier bonds and char formation. The optimal decomposition temperatures for hemicellulose and cellulose were identified as 290°C and 345°C, respectively. Lignin was found to decompose over the entire temperature range without a distinct peak. These results were confirmed by a previous study on TGA of bagasse.
SP and VP of bagasse were studied in the same reactor to allow for accurate comparison. Both these processes were conducted at low heating rates (20°C/min) and were therefore focused on char production.
vi
Slow pyrolysis produced the highest char yield, and char calorific value. Vacuum pyrolysis produced the highest BET surface area chars (>300 m2/g) and bio-oil that contained significantly less water compared to SP bio-oil. The short vapour residence time in the VP process improved the quality of liquids. The mechanism for pore formation is improved at low pressure, thereby producing higher surface area chars. A trade-off exists between the yield of char and the quality thereof.
FP at Stellenbosch University produced liquid yields up to 65 ± 3 wt% at the established optimal temperature of 500°C. The properties of the bio-oil from the newly designed unit compared well to bio-oil from the units at FZK. The char properties showed some variation for the different FP processes. At the optimal FP conditions 20 wt% extra bio-oil is produced compared to SP and VP. The FP bio-oil contained 20 wt% water and the calorific value was estimated at 18 ± 1 MJ/kg. The energy per volume of FP bio-oil was estimated to be at least 11 times more than dry SB. FP was found to be the most effective process for producing a single product with over 60% of the original biomass energy. The optimal productions of either high quality bio-oil or high surface area char were found to be application dependent.
vii
Opsomming
As gevolg van die uitputting van fossielbrandstofreserwes, en die toenemende vrystelling van kweekhuisgasse word daar tans wêreldwyd baie navorsing op hernubare en skoner energie gedoen. Biomassa is uniek as die enigste bron van hernubare vaste koolstof. Landbouafval soos Suikerriet Bagasse (SB) is grondstowwe vir ‘tweede generasie bio-brandstowwe’ wat nie die mark van voedselgewasse direk affekteer nie. In Suid Afrika word jaarliks ongeveer 6 miljoen ton SB geproduseer, waarvan die meeste by die suikermeulens verbrand word om stoom te genereer. Weens die huidige belangstelling in bio-brandstowwe en ondoeltreffende benutting van SB as energieproduk in die suikerindustrie moet alternatiewe energie-onginningsprosesse ondersoek word. Hierdie studie is op die termo-chemiese verwerking van SB deur middel van pirolise gefokus.
Biomassa pirolise word gedefinieer as die termo-chemiese afbreking van organiese bio-materiaal in die afwesigheid van suurstof en ander reagense. Stadige Pirolise (SP), Vakuum Pirolise (VP), en Vinnige Pirolise word in hierdie tesis ondersoek. Die drie prosesse produseer veskillende hoeveelhede houtskool en bio-olie wat albei voordele bied vir die suikerindustrie. Houtskool kan as ‘n vaste energie-digte brandstof verbrand of vergas word, as bio-houtskoolkompos gebruik word, of kan verder tot geaktiveerde koolstof geprosesseer word. Hoë kwaliteit bio-olie kan verbrand of vergas word, kan as bron vir chemikalië gebruik word, en toon potensiaal om in die toekoms opgegradeer te kan word tot vervoerbrandstof kwaliteit. Vinnige pirolise is die mees moderne pirolise tegnologie en is op bio-olie produksie gefokus. Om die laasgenoemde proses te toets is ‘n 1 kg/h vinnige pirolise eenheid ontwerp, opgerig en in werking gestel. Die nuwe pirolise eenheid is getoets en vegelyk met twee verskillende vinnige pirolise eenhede by Forschungszentrum Karlsruhe (FZK) in Duitsland. Termo-Gravimetriese Analise (TGA) is gedoen om die ontvlugtigingskenmerke van SB te bestudeer. Eksperimentele werk is verrig om die kwaliteit van produkte van SP, VP, vinnige pirolise te vergelyk.
Drie duidelike massaverlies fases van TGA is geïdentifiseer. Die eerste fase (25 – 110°C) is as gevolg van die verdamping van vog. Pirolitiese ontvlugtiging het begin by 230°C. Die finale fase (> 370°C) is met die kraking van swaar verbindings en die vorming van houtskool geassosieer. Die optimale afbrekingstemperatuur vir hemisellulose en sellulose is as 290°C en 345°C, respektiewelik, geïdentifiseer. Daar is gevind dat lignien stadig oor die twede en derde fases afgebreek word sonder ‘n duidelike optimale afbrekingstemperatuur. Die resultate is deur vorige navorsing op TGA van SB bevestig.
viii
SP en VP van bagasse is in dieselfde reaktor bestudeer, om ‘n akkurate vergelyking moontlik te maak. Beide prosesse was by lae verhittingstempo’s (20°C/min) ondersoek, wat gevolglik op houtskoolformasie gefokus is. SP het die hoogste houtskoolopbrengs, met die hoogste verbrandingsenergie, geproduseer. VP het hootskool met die hoogste BET oppervlakarea geproduseer, en die bio-olie was weens ‘n dramatiese afname in waterinhoud van beter gehalte. Die meganisme vir die vorming van ‘n poreuse struktuur word deur lae atmosferiese druk verbeter. Daar bestaan ‘n inverse verband tussen die kwantiteit en kwaliteit van die houtskool.
Vinnige pirolise by die Universiteit van Stellenbosch het ‘n bio-olie opbrengs van 65 ± 3 massa% by ‘n vooraf vasgestelde optimale temperatuur van 500°C geproduseer. Die eienskappe van bio-olie wat deur die nuwe vinnige pirolise eenheid geproduseer is het goed ooreengestem met die bio-olie afkomstig van FZK se pirolise eenhede. Die houtskool eienskappe van die drie pirolise eenhede het enkele verskille getoon. By optimale toestande vir vinnige pirolise word daar 20 massa% meer bio-olie as by SP en VP geproduseer. Vinnige pirolise bio-olie het ‘n waterinhoud van 20 massa% en ‘n verbrandingswarmte van 18 ± 1 MJ/kg. Daar is gevind dat ten opsigte van droë SB die energie per enheidsvolume van bio-olie ongeveer 11 keer meer is. Vinnige pirolise is die mees doeltreffende proses vir die vervaardiging van ‘n produk wat meer as 60% van die oorspronklike biomassa energie bevat. Daar is gevind dat die optimale hoeveelhede van hoë kwaliteit bio-olie en hoë oppervlakarea houtskool doelafhanklik is.
ix
Acknowledgements
Firstly I would like to thank my supervisors, Professor Knoetze and Professor Görgens, for their guidance and support over the past years.
I would like to say special thanks to Dr. Marion Carrier for her guidance and support. I am deeply indebted to her for all she has taught me over the last year.
I would like to thank my project sponsor Steve Davis from SMRI, as well as CRSES for funding for this project.
I would like to thank Dr. Stahl at Forchungszentrum Karlsruhe (FZK), who made the visit to Germany possible, as well as my friend and colleague Wale Aboyade who worked alongside me at FZK.
I would like to thank the Oppenheimer Memorial Trust for providing me with the necessary funding for the visit to FZK.
I would like to thank the workshop, especially Oom Anton, Oom Jannie, and Ulrich Büttner for their help in the construction of the fast pyrolysis unit.
I would like to thank Hanlie Botha, and the other technicians who did analyses.
I would like to thank my parents, brother, friends and loved ones for their support over the last two years. I would like to thank my God.
x
Abbreviations and Nomenclature
Abbreviation Abbreviated Word
AC Activated Carbon
ar Arrive ( as is, original) dwt% Dry Weight Percentage ESP Electrostatic Precipitator FBR Fluidized Bed Reactor FPU Fast Pyrolysis Unit
FZK Forschungszentrum Karlsruhe Liquid phase or
(Bio – oil)
All liquid products for pyrolysis. This includes water and oil fractions.
maf Moisture and Ash Free
mf Moisture Free
n.a. Not Applicable
n.d. Not Determined
Oil phase or
(organic liquid phase) All organics from the liquid product. (No water) PDU Process Demonstration Unit
Pyrolytic water Portion of liquid phase collected in ice traps during slow and vacuum pyrolysis.
SA Surface Area
SMRI Sugar Milling Research Institute Solid phase or
(Char or Bio-char) Pyrolysis char (includes ash)
SU or (US) Stellenbosch University (University of Stellenbosch) Sugarcane Bagasse or
(Bagasse) or (SB) The remnants from sugarcane after extraction of sugars Tar phase High viscosity liquid phase. Typically contains only ~3%
moisture. (Only referred to in vacuum and slow pyrolysis.) Water phase All water from liquid product. This includes water from the
biomass (moisture) and pyrolysis reaction water. WC or (MC) Water Content (Moisture Content)
wt% or (m%) Weight Percentage or Mass Percentage
Yield % or (Y) Weight option of respective product expressed as a
xi
Abbreviation Name Units
∆Tm Mean temperature difference °C [or K]
A Surface Area m2 Ar Archimedes number - Cp Specific heat kJ/kg.K E Energy J f Fluid - g Gravitational acceleration m2/s h Heat transfer coefficient W/m2.K
H Bed depth m
Hevap Heat of evaporation kJ/kg
HHV Higher heating value, (or calorific value) MJ/kg HHV (dry) HHV of sample containing no water MJ/kg
Hr Heat of reaction kJ/kg
ID Inner Diameter m
k Thermal conductivity W/m.K
L Length m
M Mass flow rate kg/h
n Reaction order -
p Particle -
P Pressure kPa [or Bar]
Q Heat transferred per unit time W (or kJ/h)
r Radius m
R Universal gas constant J/kg.K
Re Reynolds number -
RPM Revolutions per minute -
T Temperature °C [or K]
t Time s [or min]
u Velocity m/s Umf Minimum fluidization m/s Ut Terminal velocity m/s Y Yield % α Conversion - ε Voidage - µ Viscosity Pa.s ρ Density kg/m3
τ Residence time s [or min]
xii
List of figures
Figure 1: Mind map ... 3
Figure 2: Sugarcane bagasse ... 5
Figure 3: Applications for bagasse ... 10
Figure 4: Primary cellulose decomposition according to Waterloo-mechanism ... 12
Figure 5: Global pyrolysis concept ... 13
Figure 6: Typical products from FP of wood ... 14
Figure 7: Applications of bio-oil ... 21
Figure 8: Bio-char applications ... 26
Figure 9: Scanning electron microscope reveals the surfaces of SB ... 27
Figure 10: Pyrolysis of sugarcane bagasse ... 30
Figure 11: The results from fix bed pyrolysis ... 31
Figure 12: A simplified slow pyrolysis setup ... 31
Figure 13: A simplified vacuum pyrolysis setup ... 33
Figure 14: Fast pyrolysis of sugarcane bagasse ... 35
Figure 15: Sub processes of fast pyrolysis ... 36
Figure 16: (Left): Fluidized bed reactor; (Right): Circulating fluidized bed reactor. ... 39
Figure 17: Left: Auger reactor (LR mixer reactor); Right: Rotating cone reactor. ... 39
Figure 18: Ablative reactor ... 40
Figure 19: Simple representation of a fluidized bed fast pyrolysis setup ... 41
Figure 20: Thermo-chemical processes ... 42
Figure 21: Biomass subcomponents ... 45
Figure 22: Mass balance ... 48
Figure 23: Instrument and component diagram for the FPU1 ... 50
Figure 24: Energy balance ... 51
Figure 25: Fluidization of sand ... 53
Figure 26: (A): Drawing of the original (single stage) electrostatic precipitator. (B) Modified design: Two two-stage ESPs; one updraft, and one downdraft gas flow. ... 66
Figure 27: Shows the temperatures inside the oven and reactor during heating of the oven. ... 67
Figure 28: (A) Standard cyclone dimensions (Coulson and Richardson, 2005); (B) Final dimensions of cyclone (mm) ... 69
Figure 29: Experimental set-up ... 75
xiii
Figure 31: Evolution of BET surface areas of charcoals according to the temperature and the heating rate:
... 84
Figure 32: Evolution of HHV of charcoals according to the temperature and the heating rate ... 84
Figure 33: Evolution of water yields according to the temperature and the heating rate ... 86
Figure 34: Evolution of oil yields according to the temperature and the heating rate ... 87
Figure 35: Evolution of higher heating values according to the temperature and the heating rate for vacuum pyrolysis... 88
Figure 36: TG and DTG curves of CC and SB at various heating rates ... 102
Figure 37: Influence of heating rate on extent of conversion temperature for CC and SB ... 104
Figure 38: Friedman’s plots for CC and SB ... 106
Figure 39: Apparent activation energy and pre-exponential factor dependence on conversion for CC and SB ... 107
Figure 40: Deconvoluted DTG curves from thermogravimetric analysis of CC and SB at 20 C/min ... 110
Figure 41: Deconvolution computation of DTG curves from thermogravimetric analysis of CC and SB at 20°C/min. ... 111
Figure 42: Schematic diagram of FPU0.1 ... 115
Figure 43: Schematic diagram of FPU10 ... 116
Figure 44: Product yields from FPU1 of SB at different temperatures. ... 121
Figure 45: The variation of gas components volumetric flow rate for FPU10 run 05 at 500°C ... 128
Figure 46: Liquid product yield from slow, vacuum, and fast pyrolysis. ... 136
Figure 47: Product yield distributions for FP, SP, and VP ... 137
Figure 48: The density of nitrogen as a function of temperature. ... 159
Figure 49: The reduction of velocity due diameter changes inside the reactor shown for different volumetric flow rates at 1bar. ... 161
Figure 50: Front view of screw inside tube with different levels of particle filling (A, B) and side view (C) of feeder screw. ... 162
Figure 51: Chiller cycle: (1) Hot side (2) Chiller (3) Pump (4) Water bath (5) Cooling tower ... 165
Figure 52: Cyclone and container (C05 and C06) ... 169
Figure 53: Reactor (R04) ... 170
Figure 54: Oven ... 171
Figure 55: Liquid collection vessel (D08) ... 172
Figure 56: Electrostatic separators (EP 09) and (EP10) ... 173
Figure 57: Cooling tower (T07) ... 174
xiv
Figure 59: Picture of cyclones (C05 & 06), reactor (R04) and feeding system (F02). ... 176
Figure 60: Picture of the cooling tower (T07), electrostatic precipitator (T09), cyclones (C05&06) and reactor (R04) (From left to right) ... 176
Figure 61: Feed rate of bagasse at 10% moisture and 2 mm sieve size. ... 178
Figure 62: Calibration of flow controller. ... 179
Figure 63: Temperature difference between top and bottom of the reactor ... 182
Figure 64: Pyrolytic water plotted as a function of temperature for runs on FPU at SU.. ... 190
Figure 65: An illustration of char product yield from Slow, Vacuum, and Fast pyrolysis at optimal liquid producing heating rates ... 190
xv
List of tables
Table 1: Typical product distribution from various biomass conversion techniques ... 2
Table 2: Ash content of different particle size ranges ... 7
Table 3: Bagasse equivalence of sugarcane residues ... 8
Table 4: Sugarcane production in South Africa ... 9
Table 5: Cane throughput for sugarcane mills in SA ... 11
Table 6: Summary of process conditions, effects and modelling ... 16
Table 7: Comparison of physical properties of bio-oil with heavy fuel oil ... 17
Table 8: Volumetric energy density of dry bagasse, bio-char, bio-oil and fuel oil ... 19
Table 9: The representative chemical composition of fast pyrolysis liquids ... 20
Table 10: Chemicals from biomass fast pyrolysis ... 24
Table 11: Bagasse and bagasse bio-char from vacuum pyrolysis. ... 25
Table 12: The essential features of a fast pyrolysis process ... 33
Table 13: Main fast pyrolysis technology providers ... 34
Table 14: Typical results for bagasse and wood pyrolysis ... 35
Table 15: Heating mechanisms for FP reactors ... 38
Table 16: Comparison of some of the key features of fast pyrolysis systems ... 40
Table 17: Comparison of fluidized-bed FPUs... 47
Table 18: Design mass balance for pyrolysis plant ... 49
Table 19: Heating requirements ... 52
Table 20: Cooling requirements ... 52
Table 21: Gas velocities in the fluidized bed ... 55
Table 22: Design values for nitrogen gas density ... 56
Table 23: Calculation for flow rate at 50% filling of screw ... 59
Table 24: Different configurations of isopar cooling to provide over 2 kW of cooling ... 61
Table 25: Calculation of time required to achieve heat exchange inside the cooling tower. ... 62
Table 26: Comparison of size and linear velocity of different ESPs ... 65
Table 27: Reactor temperature (°C) at different oven set points ... 67
Table 28: Component summery ... 70
Table 29: Experimental conditions for the vacuum and slow pyrolysis of the sugarcane bagasse. ... 74
Table 30: Distribution of particle sizes for 1 kg of original sugarcane bagasse. ... 76
Table 31: Main characteristics of the milled sugarcane bagasse (* obtained by subtraction) ... 77
xvi
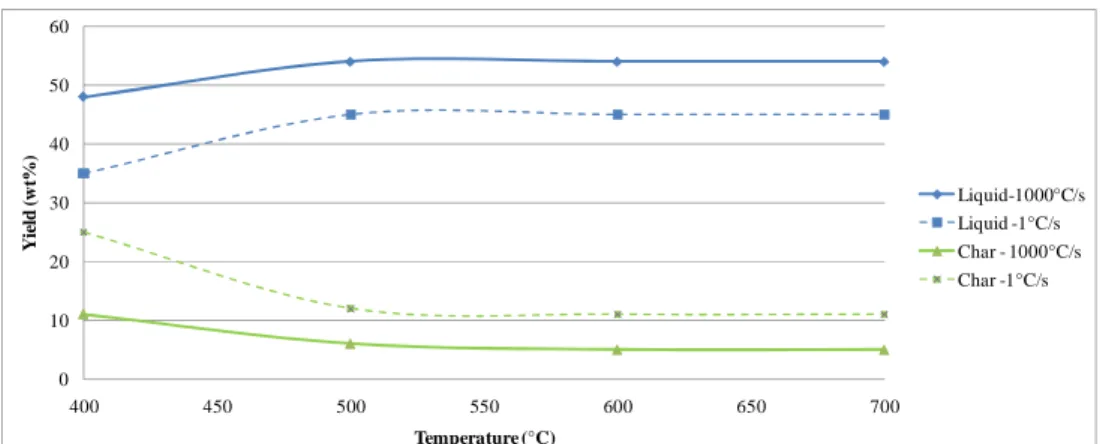
Table 33: Yields of products from slow and vacuum pyrolysis studies (* with losses). ... 80
Table 34: Ash, BET and HHV of charcoals from vacuum pyrolysis of sugarcane bagasse (8 kPa abs) .... 82
Table 35: Ash, BET and HHV of charcoals from slow pyrolysis of sugarcane bagasse under 1 mL min-1of nitrogen ... 83
Table 36: Ranges of temperature (T) in ºC and heating rate (HR) in ºC min-1 to obtain the optimal yields, BET and HHV of charcoals. ... 89
Table 37: Optimum experimental conditions for yields and product properties. ... 90
Table 38: Kinetic parameters for the pyrolysis of sugarcane bagasse and corncobs previously reported in literature ... 96
Table 39: Physical and chemical characteristics of corncobs (CC) and sugarcane bagasse (SB) ... 97
Table 40: Devolatilization parameters for CC and SB at different heating rates ... 101
Table 41: Values of kinetic parameters from previous works dealing with SB Pyrolysis ... 109
Table 42: Determination of average bond energy for pseudo-components of plant biomasses ... 109
Table 43: Different pyrolysis units that were used in this study ... 114
Table 44: The proximate analysis, ultimate analysis and HHV of bagasse. ... 117
Table 45: Pyrolysis yields for R1–R4 on FPU1 ... 119
Table 46: Pyrolysis yields for R5 – R9 on FPU1 ... 119
Table 47: Process conditions for runs R5 – R9 on FPU1 ... 120
Table 48: The mass balance from experiments on FPU0.1 ... 122
Table 49: Shows the mass balance from the FPU10 ... 123
Table 50: Comparison of yields from different FPUs. ... 123
Table 51: Water content (WC), ash content, elemental composition and HHV of bio-oil from FPU1 and FPU10. ... 125
Table 52: AC, elemental composition, BET surface area and HHV for the different chars obtained from FPU1 and FPU10. ... 126
Table 53: The chemical and elemental composition of the incondensable gas from FPU10 ... 127
Table 54: Comparison of gas composition to literature (based on at least two runs) ... 128
Table 55: A summary of the energy balance from pyrolysis 500°C ... 129
Table 56: Optimal conditions for bio-oil yield. ... 133
Table 57: Shows the conditions at which the highest quality chars were obtained ... 135
Table 58: Constants for gas density calculation ... 158
Table 59: Calculation of sphericity (for two different cases)... 159
xvii
Table 61: Calculation of minimum fluidization velocity: the RHS and LHS refer to the Right and Left
Hand Side of Equation 7. Excel function ‘Solver’ was used to minimize the difference. ... 160
Table 62: Calculation of transport particle velocity: the RHS and LHS refer to the Right and Left Hand Side of Equation 11. Excel function ‘Solver’ was used to minimize the difference. ... 161
Table 63: Variables for the design of the screw ... 161
Table 64: Calculation of heat transfer rate inside pipe ... 162
Table 65: Properties of isopar G (www.exxonmobil.com, 2010) ... 163
Table 66: Cooling tower nozzle types ... 163
Table 67: Calculation of mean temperature difference ... 164
Table 68: Specification sheet for biomass feeding (zone 1) and control ... 166
Table 69 : Component specification sheet for heating section (Zone 2) ... 167
Table 70: Specification sheet for cooling section (zone 3) ... 168
Table 71: selection of pipe sizes ... 180
Table 72: Sizing of the cyclone ... 181
Table 73: Oven calibration runs ... 181
Table 74: Summary of instrumentation ... 183
Table 75: Operation manual ... 184
Table 76: Risk assessment ... 187
Table 77: Specific Mass Balance for FPU1 ... 189
Table 78: An example of ANOVA calculation in excel. ... 191
Table 79: Single factor ANOVA for comparison of FZK and SU data ... 191
Table 80: (Complete version) Product energy distribution for SU and FZK FP experiments ... 192
xviii
Table of contents
Abstract v Opsomming vii Acknowledgements ix Abbreviations xList of figures xii
List of tables xv 1 Introduction ... 1
1.1 Objectives and scope ... 2
1.2 Mind map ... 3
2 Background and literature study ... 5
2.1 Sugarcane bagasse ... 5
2.2 Sugar industry ... 8
2.3 Biomass pyrolysis reactions ... 11
2.4 Influence of process conditions ... 13
2.5 Bio-oil ... 16
2.6 Bio-char ... 25
2.7 Slow pyrolysis ... 28
2.8 Vacuum pyrolysis ... 31
2.9 Fast Pyrolysis (FP) ... 33
2.10 Other thermo-chemical processes ... 42
2.11 Thermogravimetric analysis ... 44
2.12 Implementation of FP in the sugar industry ... 45
2.13 Conclusions and problem statement ... 46
3 Design of a fast pyrolysis reactor ... 47
xix
3.2 Review: Fast Pyrolysis Units (FPUs) ... 47
3.3 Mass and energy balance ... 48
3.4 Fast pyrolysis Fluidized Bed Reactor (FBR) ... 52
3.5 Feeding system ... 57
3.6 Direct contact cooling tower ... 60
3.7 Electrostatic Precipitators (ESPs) ... 63
3.8 Additional equipment ... 66
3.9 Safety ... 70
3.10 Summary ... 70
4 Comparison of slow and vacuum pyrolysis of sugarcane bagasse ... 71
4.1 Abstract: ... 71
4.2 Introduction ... 72
4.3 Methods and materials ... 73
4.4 Results and Discussion ... 76
4.5 Conclusions ... 89
4.6 Acknowledgements ... 91
5 Non-isothermal kinetic analysis of the devolatilization of corn cobs and sugarcane bagasse in an inert atmosphere ... 93
5.1 Abstract ... 93
5.2 Introduction ... 94
5.3 Material and Methods ... 96
5.4 Results and Discussion: ... 100
5.5 Conclusions ... 112
5.6 Acknowledgments ... 112
6 Comparison of different types of fast pyrolysis of sugarcane bagasse ... 113
6.1 Introduction ... 113
xx
6.3 Results from FPU1 ... 118
6.4 Results from FPU0.1 ... 122
6.5 Results from FPU10 ... 122
6.6 Comparison the different FPUs and their products ... 123
7 Preferred pyrolysis process for bio-oil and bio-char production from bagasse ... 131
7.1 Introduction ... 131
7.2 Review of slow and vacuum pyrolysis data ... 131
7.3 Preferred conditions for bio-oil production ... 132
7.4 Preferred conditions for bio-char production ... 134
7.5 Effect of pyrolysis temperature on product yields ... 135
8 Conclusions ... 139
9 Recommendations and future work ... 143
9.1 TGA ... 143
9.2 Fast pyrolysis unit ... 143
9.3 Bagasse pyrolysis ... 144
9.4 Ash ... 144
9.5 Sugarcane agricultural residues ... 144
10 References ... 145
10.1 References for chapter 2 ... 145
10.2 References for chapter 3 ... 148
10.3 References for chapter 4 ... 149
10.4 References for chapter 5 ... 150
10.5 References for chapter 6 ... 153
10.6 References for chapter 7 ... 154
10.7 Bibliography ... 155
11 Appendix ... 157
xxi
11.2 Appendix for chapter 3 ... 158 11.3 Appendix for chapter 6 ... 189 11.4 Appendix for chapter 7 ... 195
1
1
Introduction
The world’s depleting fossil fuels and increasing Green House Gas (GHG) emissions have given rise to much research into renewable and cleaner energy. Biomass is unique in providing the only renewable source of fixed carbon. It is termed ‘carbon neutral’ because all CO2 released form biomass combustion was previously absorbed from the air. It is recognized that biomass surpasses many other renewable energy sources, because of its abundance, high energy value and versatility. In South Africa (SA) approximately 6 million tons raw bagasse is produced annually (www.smri.org, 2009). Most large and medium sized mills can use up to 75 % of this bagasse onsite to generate heat and electricity (Zandersons
et al., 1999).
The projected renewable energy demand for 2013 is approximately 4% of South Africa’s total energy demand. Currently almost all national electricity is provided by coal and nuclear power, 92.8 and 6.7 % respectively. Only a very small fraction is supplied by biomass, solar, wind and hydropower. Because low cost electricity plays a key role in the economic growth of this country, coal is likely to remain a very attractive energy source. However, the Department of Minerals and Energy (DME) has set a target of 10 000 GWh to be produced from renewable energy sources (mainly from biomass, wind, solar and small-scale hydro) by 2013. The bio-fuels task team aim to achieve 75% of South Africa’s renewable energy needs. This strategy focuses on bio-ethanol and biodiesel.
By implementing thermo-chemical upgrading of bagasse the energy efficiency can be increased significantly, resulting in energy savings and surplus energy products (Pippo et al., 2007; Garcia-Perez et
al., 2002). Thermo-chemical processes include combustion, pyrolysis and gasification of which the latter
two are upgrading techniques. These upgrading processes are used to convert biomass into energy-dense bio-fuels namely char, bio-oil and non-condensable gasses. Different types of thermo-chemical decomposition produce different product qualities and ratios by controlling the oxygen content and process conditions. Table 1 illustrates typical weight distributions among products for different thermo-chemical processes. Fast pyrolysis is optimized for high liquid yield production; gasification maximizes gas production; vacuum pyrolysis gives a more even spread of products; slow pyrolysis and torrefaction give char as main product; and finally combustion produces heat.
2
Table 1: Typical product distribution from various biomass conversion techniques (Bridgwater et al., 2003; Mohan et al., 2006)
Process Typical process conditions
Char wt%
Liquids
wt% Gas wt%
Fast pyrolysis 500°C, high heating rate, short vapour
residence time (< 2s) 10-20 60-75 10-20 Vacuum pyrolysis 450°C, low heating rate, long - medium
vapour residence time (few minutes) 20-30 35-45 25-35 Slow pyrolysis 500°C, low heating rate, long - long
vapour residence time (5 min -30 min) 25-35 30-45 25-35 Torrefaction 300°C, low heating rate, long vapour
residence time 70 0 30
Gasification >800°C, high heating rate, long vapour
residence time 10 5 85
Great economical advantages lie in the potential upgrading of the pyrolysis products. Liquid fuel has some advantages in transport, storage, combustion, retrofitting and flexibility in production and marketing (Bridgwater et al., 1999). The alternative is char production by means of slow or vacuum pyrolysis. The char can be upgraded to activated carbon which is a high-value product, and is also used by the sugar industry to clarify raw sugar for white sugar production. This study looks into the use of pyrolysis for increasing the efficiency of bagasse utilization in the sugar industry as well as contributing to the projected renewable energy demand for South Africa in 2013.
1.1 Objectives and scope
In this project the main objective is to compare Slow Pyrolysis (SP), Vacuum Pyrolysis (VP) and Fast Pyrolysis (FP) of bagasse aimed at implementation in the sugar industry. Based on product yields and qualities from optimized experimental conditions, a qualitative comparison is possible. In order to accomplish this objective the following tasks are required:
1. The design, construction and commissioning of a Fast Pyrolysis Unit (FPU) for use in the experimental program.
3
2. An experimental evaluation of SP of bagasse to study the effect of heating rate and temperature on product yields and properties.
3. A comparison to a similar experimental study on VP (Carrier et al., 2010) on the same pyrolysis unit.
4. Thermogravimetric Analysis (TGA) to study thermal decomposition behaviour of bagasse. 5. An experimental study on FP of bagasse to study the effect of temperature on product yields and
properties on the newly constructed FPU.
6. The comparison of the newly constructed FPU with two different FPUs at Forschungszentrum Karlsruhe (FZK).
7. The final task is to produce a comparative report on SP, VP and FP to highlight the preferred pyrolysis process for production of bio-oil and bio-char.
1.2 Mind map
The mind map in Figure 1 illustrates how the different tasks fit together.
5
2
Background and literature study
2.1 Sugarcane bagasse
Sugarcane Bagasse (SB or bagasse) is the biomass that is studied in this project. Bagasse is the crushed remnants of sugarcane after syrup extraction (Devnarain et al., 2002). Sugarcane is a type of grass with peripheral fibres enclosing a soft central pith (Nassar et al., 1996). Sugarcane utilises solar energy by means of photosynthesis, to grow and therefore produce biomass. During photosynthesis CO2 is extracted from the air and this CO2 is released back into the atmosphere during combustion rendering the whole process CO2 neutral. This energy is then released either by means of natural decay, or it can be harvested by means of controlled combustion or chemical reactions. Sugarcane is the crop that produces the highest yield of biomass over an average year. Up to 8 tons/acre of carbohydrate (sugar and bagasse) can be produced annually (Calvin, 1974). Sugarcane is a fibrous plant which causes the crushed remnants to be thin long particles that are interwoven with each other (Figure 2). Therefore bagasse has very poor flow characteristics and it tends to bunch together (Rasul et al., 1999). Additional size reduction before pyrolysis will enhance the flow ability of bagasse.
Figure 2: Sugarcane bagasse
The particle density of the bagasse is particularity difficult to determine accurately because of the porosity of the particles, the voidage between the particles, and the different types of particles. Bagasse consists mainly of fibre particles, with a large length to width ratio, and small spongy dust-like particles (Rasul et
al., 1999). The dust-like particles have a much lower density of 220 kg/m3, compared to the fibrous particles density of 550 kg/m3 (Garcia-Perez et al., 2002). A large variation is reported in literature on the density of bagasse. A test was done in the present study to determine the bulk density of South African bagasse (without compression); it varied between 100 - 200 kg/m3 due to large void spaces between particles.
6
These differences in size, shape and density cause the different particles to segregate easily into an inhomogeneous mixture of the different particles of bagasse. Normal sampling at various depths will not produce a representative sample if the sample is segregated. To avoid sampling only certain particles a representative sample should be evenly spread on a table. Numerous samples should be taken randomly across the table each time taking precaution to collect all the biomass in a certain area. This method is repeated until a small enough representative sample is obtained (standard method applied for biomass sampling at The Department of Forestry at SU). Segregation occurs primarily as a result of size difference (Rhodes, 2005). Size reduction reduces the bulk density of bagasse, because void spaces become smaller (Rhodes, 2005).
The properties of bagasse vary with the type of sugarcane, its maturity, harvesting methods, milling methods, handling methods and sugar extraction methods. In South Africa the diffusion process is commonly used to extract sugars from cane, which may render the chemical and physical properties of bagasse different from bagasse produced in other countries (Devnarain et al., 2002; Rasul et al., 1999). The alternative to sugar extraction by diffusion is to squeeze and wash the cane (www.smri.org). Bagasse is a lignocellulosic compound which implies that it contains varying amounts of cellulose, hemicellulose and lignin. The study of lignocellulosic compounds is relevant to pyrolysis because decomposition these components occurs at different temperatures. Hemicellulose typically decomposes in the range of 160-360°C, while cellulose degrades at the higher temperature range of 240-390°C. The loss of lignin typically occurs at a slower rate over a much wide temperature range of 180-900°C (see detail discussion in Chapter 5). Cellulose and hemicellulose are both polymeric carbohydrate structures, termed polysaccharides. Cellulose is a polymer, consisting of linear chains of 1, 4-D-glucopyranose units. Hemicellulose a complex polysaccharide found mostly in cell walls, which is a branched structure composed almost entirely of sugars such as glucose, mannose, xylose, arabinose, methlyglucoronic and galaturonic acids. Cellulose is crystalline and strong whereas hemicellulose has an amorphous structure with little strength. The main difference between cellulose and hemicellulose is that cellulose is glucose derived and hemicellulose is derived from a variety of sugars (Mohan et al., 2006). Lignins are highly branched, substituted, mononuclear aromatic polymers in the cell walls of certain biomass, especially woody species. Lignin is an amorphous cross linked resin with no distinct structure, which binds the fibrous cellulosic particles. The building blocks of lignin are believed to be a three-carbon chain attached to rings of six carbon atoms, called phenyl-propanes (Mohan et al., 2006). Bagasse contains 35-50 wt% cellulose, 20 – 30 wt% hemicellulose, 20 – 27 wt% lignin, and 8 – 12 wt% extractives and ash (Garica-Perez et al., 2001).
7
The ash content of SB is critical. Ash is the name given to all components that are not considered organic or water. It consists mostly of metal oxides. These metal oxides contaminate the products, be it chars for activated carbon or bio-oil, and therefore the ash content of the sample should ideally be as low as possible (Luo et al., 2004). Ash also acts as a catalyst for unwanted reactions during pyrolysis (Bridgwater et al, 1996; Raveendran et al., 1995). Bagasse has a high ash content, which is usually in the region of 3 wt% or higher (Sugar conference, 2001). In a previous study the ash composition of South African SB ranged between 1.8 - 5.4 wt% thereby illustrating how inhomogeneous samples can be (Devnarain et al., 2002). Soil contamination has been reported to increase the ash content from 2.5 wt% to as high as 12 wt% (Turn, 2002). A small fraction of soil has a significant effect on the overall ash content, because it contains mostly inorganic components.
Several methods exist to remove the unwanted soil and ash from bagasse. Depending on the process, sugarcane milling may remove much of the soil from bagasse. If the soil content remains high a washing step may be included. Alternatively bagasse can be pre-treated to remove ash by means of water leaching under mildly acidic conditions (Das et al., 2004). The resulting leachate was found to have potential to be used in ethanol fermentation, which could increase the economic feasibility of including this process step (Das et al., 2004). The final method for reducing ash content is by discarding the smallest particle size fraction. Garcia-Perez et al. (2002) determined the ash content of the different size fractions of bagasse. They concluded that the ash content of the smaller particles was significantly higher. Therefore it is desirable to remove the small particles after milling. In Table 2 the ash content of the different particle size ranges is shown. By removing the finest particles, the ash content may be reduced by about a third.
Table 2: Ash content of different particle size ranges, (Garcia-Perez et al., 2002)
Particle size, d (mm) Dry bagasse
(wt %) Ash (wt %) d > 4.75 34 1.3 0.85 < d < 4.75 44 1.6 0.45 < d < 0.85 15 2.3 0.25 < d < 0.45 4 13 d < 0.25 3 27.7
2.1.1 Use of sugar cane agricultural residue (SCAR)
SCAR is the remainder of the sugarcane plant that was not harvested and is composed of sugarcane leaves and cane tops and trash (roots, stems and leaves). In many countries SCAR it is burnt to facilitate easier
8
harvesting, or left in the field to decompose and regenerate the soil nutrients. The main drawbacks for using SCAR as energy feedstock are: collection from field, a high ash content of 6 to 10 wt%, and potential soil degradation due to high recovery of biomass (Pippo et al., 2007; Beeharry et al., 2000). SCAR and bagasse have similar heating values of approximately 17MJ/kg (Pippo et al., 2007). A comparison of the energy value of SCAR and bagasse relative to their respective proportions is shown in Table 3.
Table 3: Bagasse equivalence of sugarcane residues (Beeharry et al., 2000)
Biomass Availability (% cane) Moisture content (%) Bagasse equivalence Bagasse 30 50 1
Cane tops and leaves 31.2 68 0.62
Trash 10.2 19.3 1.61
From these results it was concluded that more that 50 % of the fibrous energy produced by the cane plant is biomass that is stored as cellulosic fibres in SCAR. Assuming effective collection of SCAR, biomass production can be boosted up to 22 dry tonnes per hectare (Beeharry et al., 2000). In reality the recovery of these residues adds additional cost and complications and is therefore more expensive to use than bagasse. With ever changing economic conditions, SCAR may still become a usable energy product in the future.
2.2 Sugar industry
The South African sugarcane industry is one of the world’s leading cost-competitive producers of sugar, and is ranked worldwide within the top 15 sugar exporters. Cane is predominantly produced in KwaZulu-Natal, Mpumalanga and the Eastern Cape, which are considered the most productive cultivation areas in South Africa. Approximately 320 000 ha of sugar cane is harvested each season, with an energy potential of up to 1000 GJ/ha/year (Banks et al., 2006). There are currently approximately 38 200 cane growers are registered within the South African cane growers sector (www.sasa.org.za, 2010). Of these cane growers 96% are small-scale growers that produce 9 % of the total crop. In 2008 there were 14 mills located throughout the eastern part of South Africa (www.sasa.org.za, 2009). Five of these mills are owned by Illovo Sugar Ltd, four by Tongaat Hullet Sugar Ltd, two by TSB Sugar RSA Ltd, one by UCL Company Ltd and one by Ushukela Milling (Pty) Ltd. In Table 4 a summary of the total crop of sugarcane as given
9
by the South African Sugar Industry Directory of the 2007/2008 season is shown for the past 7 years
(www.sasa.org.za, 2009). On average 22 million tons of cane is crushed annually.
It is important to draw the line between crushed sugarcane and obtainable energy. For every 1 (wet) ton of sugarcane approximately 100 kg of sugar is produced, 35 kg molasses, and 270 kg wet bagasse (Garcia-Perez et al., 2002). Wet bagasse typically contains approximately 50 wt% moisture. In the 2001 season SA crushed over 21 million tons of sugarcane, resulting in approximately 6 million tons bagasse (50% moisture). According to a recent article on sugarcane energy production in SA this amount of bagasse could produce approximately 2600 GWh by direct combustion. Currently this by-product of the sugar industry is used as a fuel resource for industry (Norris et al., 2007). Low efficacy boilers are typically used in the sugar industry to generate power by direct combustion of bagasse with a maximum efficiency of 26%. Pyrolysis and gasification can achieve higher energy conversion than combustion (Garcia-Perez
et al., 2002).
Table 4: Sugarcane production in South Africa
Season Million tons cane crushed Dry bagasse produced *
2001/2002 21.16 5.71 2002/2003 23.01 6.21 2003/2004 20.42 5.51 2004/2005 19.09 5.16 2005/2006 21.05 5.68 2006/2007 20.28 5.48 2007/2008 19.72 5.33
*27 wt% wet bagasse (Garcia-Perez et al., 2002; Drummond et al., 1996)
2.2.1 Uses of bagasse
Bagasse is mainly used for onsite combustion (Asadullah et al., 2007). The remainder is typically used to produce paper pulp, chemical reactants, or animal feed additives (Devnarain et al., 2002). Implementing thermo-chemical processing of bagasse will extend its uses to high-density energy products (char and bio-oil) as well as activated carbon and high quality fertilizer (from char). Bagasse is a by-product from the sugar industry and is therefore a second-generation biofuel, which implies that it does not compete with food crop production. Sacrificing agricultural land for fuel production may in the future become viable if fuel prices increase significantly.
10
Figure 3: Applications for bagasse
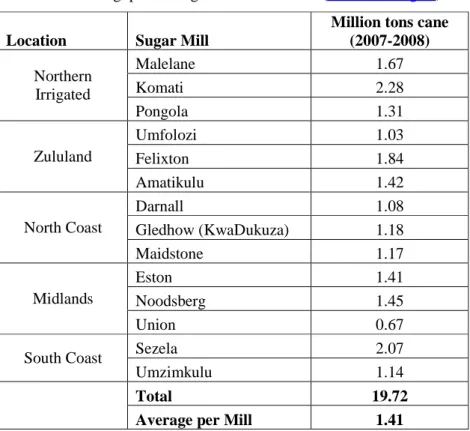
When considering the implementation of further processing of bagasse it is vital to review the sizes of the respective mills in SA. As is evident from Table 5, on average approximately 1.4 million tonnes SB is crushed per season per mill. Bagasse is burnt to produce heat or electricity in most sugar mills around the world (Garcia-Perez et al., 2002). When excess electricity is generated it is sold to the electricity grid. This process is called ‘co-generation’. A number of sugar mills have proposed to keep generating electricity in the off season, to add value to the industry. Large quantities of bagasse will need to be stored for use in the off season. Stockpiling of bagasse makes it susceptible to degradation if stored for too long in warm humid conditions (Pippo et al., 2007). Pelletisation provides a more compact method for storage of bagasse (Erlich et al., 2006). Energy densification before storage can reduce storage per volume significantly. Storage, transport volume, and the degradation of energy resource will be greatly reduced by the implementation of pyrolysis as energy densification method (Pippo et al., 2007).
11
Table 5: Cane throughput for sugarcane mills in SA (www.sasa.org.za, 2009)
Location Sugar Mill
Million tons cane (2007-2008) Northern Irrigated Malelane 1.67 Komati 2.28 Pongola 1.31 Zululand Umfolozi 1.03 Felixton 1.84 Amatikulu 1.42 North Coast Darnall 1.08 Gledhow (KwaDukuza) 1.18 Maidstone 1.17 Midlands Eston 1.41 Noodsberg 1.45 Union 0.67
South Coast Sezela 2.07
Umzimkulu 1.14
Total 19.72
Average per Mill 1.41
2.3 Biomass pyrolysis reactions
Pyrolysis is defined as the thermo-chemical conversion of biomass to char, bio-oil and gas, in the absence of oxygen and other reactants (Balat et al., 2009; Goyal et al., 2008). It always occurs before combustion and gasification where complete or partial oxidation is allowed to proceed. Pyrolysis is a complex non-equilibrium process where the biomass undergoes multistage decomposition resulting in large changes in specific volume. The reaction rate, order and product yields depend on parameters such as temperature, heating rate, pre-treatment, catalytic effects etc. (Bridgwater et al., 1996 and 2002). The reaction mechanism can be approximated by combining the yields from the three lignocellulosic compounds, despite synergetic effects. Therefore the study of individual components forms the basis of the expected reaction pathways (Van de Velden et al., 2010). Cellulose is the focus of much research because it is the dominant lignocellulosic compound, and therefore cellulose decomposition is best understood. The primary cellulose reaction is described by the Waterloo-mechanism, illustrated in Figure 4 (Van de Velden et al., 2010).
12
Figure 4: Primary cellulose decomposition according to Waterloo-mechanism
At low temperatures (< 350°C) dehydration is dominant which favours char, water and gas production. Depolymerisation dominates at temperatures between 300 and 450°C which produce anhydrous sugars like levoglucosan. Fragmentation of cellulose to carbonyl compounds, acids and alcohols is optimized at around 600°C. Further increases in temperature (> 650°C), or very long vapour residence times, will cause secondary reactions to occur between vapour and solid phase to form gas (Bridgwater et al., 1999). The relevant secondary reaction for pyrolysis is cracking and the water-gas shift reaction: H2O + CO2 ↔ H2 + CO2 (Vande Velden et al., 2010).
It has been suggested that the primary heat of reaction of wood pyrolysis is low, and that secondary reactions are the main cause of heat generation (Ahuja et al., 1999). Because of the variety of reactions that take place during pyrolysis the reaction may be either endothermic or exothermic. For small particles with immediate removal of vapours the pyrolysis reaction is considered endothermic, whereas pyrolysis reactions in larger particles and longer vapour residence times are likely to be exothermic (Ahuja et al., 1999). Pyrolysis heat requirements between 200 and 400 J/g were reported for various biomasses by Van de Velden et al. (2010). The current generally accepted global mechanism for lignocellulosic biomass pyrolysis is shown in Figure 5 (Van de Velden et al., 2010). This is only a rough approximation because it has not been possible to establish a more detailed correlation for the biomass as a whole (Rabe, 2005).
13
Figure 5: Global pyrolysis concept (Radlein et al., 1991)
Some variations on this global mechanism have also been published. In 2001 De Jongh et al. proposed a slightly different mechanism where a distinction was made between vapours (long-chain compounds) and gasses (short-chain compounds). A high degree of conversion was attained during the first stage (cracking of macro molecules) during which most volatile components are released. The second stage occurs at a higher temperature, and is caused by cracking of the residual low molecular weight components to gasses and chars (Rabe, 2005). Generally all the models agree that primary reactions are ideal for bio-oil production and that secondary reactions favour char and gas production.
2.4 Influence of process conditions
This section discusses the most relevant theory on the pyrolysis process and the process conditions with special attention to design implications. Therefore the focus is on fast pyrolysis (FP) but the principles can be applied to any of the pyrolysis technologies. This theory will clarify why different pyrolysis conditions lead to different product yields and quantities.
2.4.1 Temperature
Temperature can be said to be the most dominant process variable with regard to pyrolysis product yields. For most types of woody biomass, the liquid yields in FP are optimized in the temperature range 500-520°C (Bridgwater et al., 1999). If the reaction temperature is too low, char formation increases. At lower temperatures only certain lignocellulosic components react. Figure 6 shows a typical temperature-yield
14
curve for pyrolysis of wood (Bridgwater et al., 1999). Similar results have been published (Gerdes et al., 1999; and Asdullah et al., 2007). Clearly the liquid yield is optimized around 500°C, which favours the depolymerisation reaction described in Figure 4. If the temperature is increased further, the liquid yield will decrease as a result of secondary reactions.
Figure 6: Typical products from FP of wood (Bridgwater et al., 1999)
2.4.2 Heating rate
A higher heating rate produces a higher liquid product yield (Bridgewater et al., 1999). This is can be seen from flash processes which are optimized for liquid production and uses high heating rates, up to 104 C/s (Horne et al., 1996). Bahng et al. (2010) differentiated between fast and flash pyrolysis at their respective heating rates of 200°C/s and >1000°C/s, which is dependent on their respective particle size, <2mm and <200μm (Van de Velden et al., 2010). Producing powdered biomass <200μm for pyrolysis is expensive and therefore unrealistic to run at large scale.
It is difficult to control or accurately measure the heating rate of FP. Instead the heating rate is simply maximized for FP. For slow pyrolysis heating rates are much lower and are mostly operated between
10-0 10 20 30 40 50 60 70 450 500 550 600 Y ie ld , w t% o n d ry f ee d Reaction temperature ( C) Organic liquid Gas Water Char
15
50 °C/min. When higher heating rates are used, the emphasis will typically shift to that of oil or vapour yield, and not char production. A slower heating rate will cause an increase in char yield, and higher temperature will reduce the yield but increase the Higher Heating Value (HHV). Heating rate had a less significant effect on the BET surface area of the chars, than hold time or temperature (Lua et al., 2006). Studies on heating rates inside FP reactors have not been reported. This is because the heating rate and flux are dependent on local condition inside a continuously fluidized-bed reactor. Heating rate effects have only been studied on batch and fixed bed scale where the heating rate is controllable. Thermogravimetric Analysis (TGA) equipment is typically used for these studies. From these test it was concluded that a higher heating rate produces an increased oil yield (Garcia-Perez et al., 2002). Typical TGA experiments will study low heating rates of up to 50°C/min. However, it is not clear how experiments under controlled heating conditions with small samples can be translated to larger scale continuous reactors with high heating rates (Kersten et al., 2005). Modelling devolatilization kinetics might be the most accurate method for understanding the relation.
2.4.3 Feed-particle size
The feed particle size is determined by the desired heat transfer rate to the particle. The thermal conductivity of biomass is very low: 0.1 W/mK along the grain and 0.05 W/mK across the grain (Bridgwater et al., 1999). Therefore if the particles are too large, char formation will increase because of slow heating of the core, and secondary reactions become increasingly significant (Scott et al., 1984). Particle size therefore has a direct affect on heat transfer. Scott et al. (1982) found that particle sizes smaller that 2 mm do not significantly affect FP product yields. Van de Velden et al. (2010) modelled heat transfer in small particles and found that thermal gradients only become insignificant for particles smaller than 200 μm. The generally accepted particle size for fast pyrolysis is 2 mm or smaller according to Bridgwater et al. (1999). The gas velocity in fluidized-bed reactors is limited to the sand blow-out velocity and maximum particle size capable of being fed through the feeder.
2.4.4 Vapour residence time and secondary reactions
The vapour residence time is defined as the average time a molecule spends inside the reactor, and is a function of reactor volume and sweep gas flow rate (Equation 1).
16 ] / [ ] [ 3 3 s m Q m V =
τ
Equation 1 Scott el al. (1999) measured the effect of vapour residence time on liquid yield. An increased residence time caused a rapid decrease in oil yield. It was concluded that the decrease is due to secondary cracking reactions, which reduce specific chemicals and overall liquid yield. At lower temperatures (lower than 400°C), secondary condensation occurs, which lowers the molecular weight of the liquid product. In essence the vapour residence time should be short, less than 2 seconds secondary reactions (Yaman et al., 2004; Bridgwater et al., 1999). It was also reported that the amount of char in the reactor had a significant effect on the rate of the secondary reaction. The composition of oil is also affected by the residence time. A mechanism was proposed by Antal et al. (1995) that suggests that primary tar can be rapidly converted into gasses and refractory tar (less reactive), after which the two tars form a single solution upon condensation. Ash, and char components carried over from the reactor acts as a catalyst for these secondary reactions, which is also unfavourable (Das et al., 2004). A summary of the process conditions is given in Table 6.Table 6: Summary of process conditions, effects and modelling
Parameter Condition Optimal condition for fast pyrolysis
Reaction temperature 500 – 520°C Constant Vapour residence time < 2s Shorter is better
Secondary cracking Avoid Bad for product quality and yield Heat transfer rate 200°C/s High as possible to increase liquid yield. Particle size Typically <2mm Large particles limit heat transfer, feeding and
fluidization. Kinetic modelling Batch wise for
low hearing rates
Difficult to relate to fast pyrolysis with high heating rate and large sample sizes.
2.5 Bio-oil
2.5.1 Composition and physicochemical properties
Bio-oil is a dark brown, free-flowing organic liquid that is a mixture of highly oxygenated compounds and water, and is immiscible with other hydro-carbonaceous fuels. The immiscibility is attributed to high water content, which serves to suspend different molecules in a micro emulsion. It has a distinctive smoky
17
odour. Bio-oil is also known as pyrolysis oil, pyrolysis liquids, bio-crude oil, wood liquid, wood oil, or liquid smoke (Qi et al., 2007; Mohan et al., 2006). Because of the high oxygen and water content the heating value is significantly less than that of conventional fossil fuels. During combustion the water is evaporated which absorbs a significant portion of energy. Bio-oil is a complex mixture of different types and sizes of molecules derived from depolymerised lignocellulosic compounds. Table 7 shows the typical properties of bio-oil, compared to that of heavy fuel oil. A separate column for bio-oil from bagasse, and normal bagasse is included for comparison. It is apparent that bio-oil quality is significantly lower than that of petroleum based fuel oil. The formation of fossil fuels by anaerobic biomass degradation over geologic time is thought to produce mainly peat, lignite and coal. This is consistent with pyrolysis models for ‘long residence times’ and low heating rates which maximizes solid product, and minimizes liquid product (Bridgwater et al., 1999).
Table 7: Comparison of physical properties of bio-oil with heavy fuel oil (Czernik et al., 2004, Mohan et
al., 2006, Garcia-Perez et al., 2002, Bridgwater et al., 1999)
Physical property Dry Bagasse Bagasse bio-oil Wood bio-oil Heavy fuel oil Water content (wt %) 0 13.8 10.2 - 35 0.1 pH n.a. 2.7 2-3.5 SG (20°C) (kg/L) 0.1-0.15 1.21 1.21-1.24 0.94 Elemental composition (wt %) C 47.5 54.6 44-63.5 85 H 5.9 6.45 5.2-7.2 11 O 40.7 38.07 32-46 1 N 0.29 0.73 0.07-0.39 0.3 Ash 5.6 0.05 0.03-0.3 0.1 Calorific Value (MJ/Kg) 18.8 22.4 15-24.3 40 Viscosity (@ 50°C; cP) n.a. 16.4 9-137 180
Solids wt % (methanol insoluble material) n.d. 0.38 0.17-1.14 1
The properties that have a negative impact on bio-oil relative to fuel oil will now be discussed, and suitable upgrading methods will be suggested.
18
2.5.1.1 Water content
Less water is considered beneficial for the energy density, transportation cost, stability and acidity (Oasmaa et al., 1999). Typically 20-30 wt% water is contained in bio-oil which decreases the heating value of bio-oil by up to 25% to 17 MJ/kg, which is less than half that of fuel oil (Bridgwater et al., 2002). Decreasing the water content of bio-oil is a difficult process, which leads to a viscosity increase. Below 15 wt% water the viscosity increases exponentially; for example at 4 wt% water the viscosity of the oil is 80000 cP (20°C) at which point pumping will become problematic (Westerhof et al., 2007). High fluidity is essential for internal combustion in engines. Sipilae et al. (1998) found that viscosities were reduced by higher water content and less insoluble components. Research at the NREL showed that the increase of viscosity during storage could be reduced by adding 10-20% of an alcohol to the mixture (Dieblod et al., 1999). For combustion in normal boilers, viscosity is not a big a concern.
2.5.1.2 Oxygen content
Bio-oil oxygen content is approximately 45-50 wt%, respectively distributed over most of the more than 300 components that have been identified (Mohan et al., 2006). The high percentage oxygen present in the bio-oil makes it less energy dense, and is also the main cause for the immiscibility of hydrocarbons and bio-oil. Bio-oil shows a wide range of boiling points because of the many different species present therefore complicating the distillation process. Many of the unwanted characteristics of bio-oil are associated with the high oxygen content. Therefore the removal of oxygen from bio-oil could render it usable as transport fuel. Oxygen can be rejected as water (during reaction with H2) or as CO2. Three main routes to transport fuel are possible. The first process is hydro-treating or hydro-cracking. In this process a hydrogen producing solvent is used together with catalysts, under pressurized conditions of hydrogen or CO to remove oxygen from the oil. The removed oxygen is then collected as H2O or CO2. A naphtha-like product is obtained that is upgraded to diesel. This process is very expensive because of the high hydrogen requirements (Bridgwater et al., 2000). The second route is catalytic cracking. Bio-oils can be catalytically decomposed to hydrocarbons with removal of oxygen. There are still some concerns with catalyst stability and life (Bridgwater et al., 2000). This route is regarded as the cheaper option, however it also results in a high degree of coking (8-25%), and a reasonably low fuel quality. The final upgrading option is emulsification of bio-oil with hydrocarbons by the use of a surfactant. The optimal range of surfactant concentration was 0.5-2 wt% to achieve acceptable viscosity. Ikura et al., (2003) found that by mixing 10-20 % bio-oil with diesel the viscosity and corrosiveness was greatly reduced (Qi et al., 2007).
19
2.5.1.3 Acidity
Carboxylic acids are present in bio-oil which causes the pH to drop to the region of 2-3. This acidity makes bio-oil corrosive, and at elevated temperatures even more so (Qi et al., 2007). Corrosive resistant materials of construction should be used.
2.5.1.4 Density
Bio-oil density is higher than that of conventional fuels and therefore the energy per volume is also higher. On a volume basis bio-oil has ~60% as much energy as fuel-oil, whereas on mass basis it is less than half. In terms of energy density bio-oil shows a significant improvement on dry bagasse as illustrated in Table 8.
Table 8: Volumetric energy density of dry bagasse, bio-char, bio-oil and fuel oil
Bio-fuel HHV (MJ/kg) Density (kg/L) Volumetric energy density (MJ/L) Energy equivalence relative to dry SB Dry bagasse 18.7 0.1 1.9 1 Bio-char* 30 0.3 9 5 Bio-oil (20 wt% water) 18 1.2 21.6 12 Fossil oil 40 0.9 37.6 20
*Van de Velden et al., 2010
2.5.1.5 Storage instability
Diebold et al. (2001) reviewed mechanisms of storage stability of FP fuels. The addition of methanol or ethanol, leads to esterification and acetalization which upgrades the fuel. The viscosity, acidity and aging rate are decreased and the heating value, volatility, and miscibility with diesel fuels are increased. This reflects on the instability of bio-oil which is exacerbated when the temperature is increased. Consequently, even when storing bio-oil at room temperature, aging causes the viscosity to increase, volatility to decrease and phase separation to occur. This is a result of processes such as polymerisation, condensation, etherification, esterification and agglomeration of oligomeric molecules (Bridgwater et al., 2002).
20
2.5.1.6 Ash content
Some ash remains in the bio-oil which can cause corrosion and increase instability due to catalytic effects. Therefore the ash content should preferably be less than 0.1 wt% for use in engines (Qi et al., 2007). Hot gas filtration can be used to reduce the ash content to less than 0.01 wt% and the alkali content to less than 10 ppm. The filtered oil performed well in tests done on a diesel engine (Shihadeh et al., 2000; Bridgwater et al., 2002).
2.5.1.7 Chemical composition
A broad range of chemicals is produced from the reaction of the diverse lignocellulosic structure of biomass described in chapter 2.3. Bridgwater et al. (2002) reported the representative chemical composition of FP liquids as shown in Table 9. Hemicellulose typically produces acetic acid and furfurals; cellulose produces levoglucosan, acetol, aldehyde and 5-hydroxymethylfurfural; lignin produces small amounts of monomer phenols but mostly oligomeric product with high molecular weight (900-2500 u). The production of specific chemicals from pyrolysis is discussed in paragraph 2.5.2.6 in more detail.
Table 9: The representative chemical composition of fast pyrolysis liquids (Bridgwater et al., 2002)
Major bio-oil components Wt %
Water 20-30 Lignin fragments 15-30 Aldehydes 10-20 Carboxylic acids 5-10 Carbohydrates 2-5 Phenols 1-4 Furfurals 2-5 Alcohols 2-5 Ketones 1-5 2.5.2 Bio-oil applications
Bio-oils can be produced from a range of biomass feedstocks and are cleaner than fossil fuels (releases 50% less nitrogen oxides). It produces a net zero CO2 emissions and no sulfoxide emissions (Mohan et
21
the lower quality of bio-oil poses some limitations on its application, there are still various processes available which can use bio-oil. Figure 7 shows different uses of pyrolysis liquids.
Bio-oil Upgrading Chemical extraction Turbine & Engine
Boiler & Co-Firing Chemcials Transport fuels Electricity Heat Fast pyrolysis Bio-char Gas Bio-char applications Pyrolysis heat Pyrolysis heat
Figure 7: Applications of bio-oil (Bridgwater et al., 2007)
2.5.2.1 Boiler fuel
The heating value of bio-oil is about half that of fossil fuel, and it contains a significant portion of water. Bio-oil has been successfully used as fuel at various institutions (Canmet in Canada, MIT, Neste in Finland). Among problems reported were high viscosity which was corrected by the addition of methanol and inline preheating. The boiler or furnace still required preheating with conventional fuels before bio-oil could be used (Bridgwater et al., 2000). Because of the more sophisticated start-up procedure co-firing of bio-oil in coal utility boilers has also been used (Bridgwater et al., 2000). Bio-oil burns cleaner than fossil fuel because it has a low sulphur and nitrogen content (Balat et al., 2009).
2.5.2.2 Electricity production
Electricity production is favoured over heat production because of its easy distribution and marketing. Over recent years numerous diesel engines have been tested with bio-oil (Bridgwater et al., 2002).