Audit Fees In Family Firms: Evidence
From U.S. Listed Companies
Chiraz Ben Ali, IPAG Business School, France Cédric Lesage, HEC Paris, France
ABSTRACT
Family businesses are an important part of the world economy (Anderson & Reeb, 2003) and differ considerably from non-family firms with regard to corporate governance. However, despite their difference, family businesses have received relatively little research attention. Our study contributes to this growing research by empirically investigating the relationship between family shareholding and audit pricing. Using a sample of 3,291 firm-year observations of major U.S. listed companies, for the 2006–2008 period, our results demonstrate that audit fees are negatively associated with family shareholding after taking into account time-varying effects and industry effects as well as traditional control variables. The empirical results are robust to alternative family shareholding measures and estimation model specifications. Our results are consistent with the convergence-of-interests hypothesis suggesting that family firms face lower manager/shareholders agency costs. Auditors charge lower fees for family firms because of lower information asymmetry and risk given that the controlling family is well informed about the firm and is better able to monitor managerial decisions.
Keywords: Family Firms; Audit Fees; Agency Conflicts; Corporate Governance
I. INTRODUCTION
rior research posits that family ownership is both prevalent and substantial. Even in the United States, where ownership is relatively dispersed (La Porta et al., 1999), Anderson and Reeb (2003) find that families are present in one-third of S&P 500 and account for 18 percent of outstanding equity. Also recent research documents that family firms present significant differences from non-family businesses across many accounting dimensions including information asymmetry, earnings quality, corporate governance, firm value, and performance (Lennox, 2005; Dechun, 2006; Ali et al., 2007; Chau & Gray, 2010). Indeed, compared to non-family firms, family firms exhibit lower agent (i.e. manager vs. shareholders) agency costs and higher principal-principal (i.e., controlling vs. minority shareholders) agency costs (Ali et al., 2007). Auditing being an agency cost borne by the shareholders to reduce information asymmetry (Jensen & Meckling, 1976), these characteristics are likely to influence audit effort and risk premium. Surprisingly, despite the importance of family businesses worldwide and the substantial differences between family and non-family firms, there has been very limited research on family businesses in auditing (Trotman & Trotman, 2010). Our study investigates whether auditors are sensitive to these agency problems by examining the relation between audit fees and family shareholding.
Prior research documents that family firms face lower principal–agent conflicts than firms with diffuse ownership. First, a controlling family is well informed about firm decisions since family members participate in the management or serve as directors on the board (Chen et al., 2008). Second, families have less diversified portfolios and large blocks of shares, giving them strong incentives to monitor managers, in turn reducing potential manager opportunism. Third, families have good knowledge about their firms’ activities, which enables them to better monitor managers (Anderson & Reeb, 2003). Previous studies suggest a substitution effect between internal corporate governance control and external auditing; hence, better internal control should be associated with lower audit fees. These previous developments suggest that family shareholding negatively influences audit fees. Other research shows that family-owned firms have higher earnings quality, as proxied by lower abnormal accruals and greater earnings informativeness (Wang, 2006). Therefore, the demand for assurance that the financial statements do not include significant errors is expected to be weak in family firms.
On the other hand, family firms suffer from more severe principal–principal conflicts. A controlling family is likely to have an effective control over the firm through a high percentage of voting rights and board positions. This control gives the family power to seek private benefits at the expense of other shareholders, in turn increasing the agency conflict between controlling and minority shareholders. Also, family shareholders can extract private benefits more easily if the firm’s board of directors is dominated by family members. In that case, the family can wield considerable influence on, among other aspects, the choice of the other board members (Hope et al., 2012). Ho and Wong (2001) argue that the monitoring of a board’s effectiveness could be impaired when its composition is determined by family members. Other studies document that the effectiveness of audit committees is significantly reduced when family members are present on corporate boards (Jaggi & Leung, 2007). Khalil et al. (2008) posit that auditors need to increase the scope of their audit for firms with high agency conflicts because of increased audit risk (inherent and/or audit risk) and auditor business risk (litigation risk). Hence, auditors charge higher audit fees for family firms to cover supplemental audit cost.
We use regression analyses on 1,131 U.S. non-financial listed companies in the 2006–2008 period to examine the relation between audit fees and family shareholding. Consistent with the first hypothesis, regression results show (1) a negative relationship between audit fees and family ownership and (2) a negative relationship between audit fees and the presence of a family controlling shareholder. Our results are robust after taking into account time-varying, industry effects as well as traditional control variables (e.g., audit costs, client-specific litigation risk, Big 4 fee premium, busy season effect, and audit demand effect). These findings are consistent with lower principal–agent (manager vs. shareholders) agency costs in family firms as well as with Ali et al. (2007)’s results concerning family firms’ disclosures. They suggest that the effect of the reduced manager–shareholders agency problem dominates the potential increase in the principal–principal agency problem with regard to audit fees. As the United States has traditionally been considered as one of the countries with the most dispersed ownership (La Porta et al., 1999), very little research examines family firms in the U.S. context. However, recent studies show that family businesses are an important part of the U.S. economy (Holderness, 2009). Our study brings new evidence on how auditors assess risk in family firms and respond to a prior call for research on auditing family businesses (Trotman & Trotman, 2010; Ben Ali & Lesage, 2012). We also contribute to corporate governance research in evidencing the prevalence of principal-agent conflict compared to principal-principal conflict in determining audit pricing for family firms.
The paper is organized as follows. The next section (Section II) presents the research design and Section III provides the sample selection procedures and descriptive statistics. Regressions results are disclosed in Section IV, with robustness analyses reported in Section V. Finally we summarize the main findings and conclude in Section VI.
II. MODEL
The seminal model of Simunic (1980) includes two components: audit effort and risk premium: AUDFEE = p*q + E(Loss)
Where AUDFEE is the amount of audit fees, q: number of auditing hours, p: hourly pricing, E(Loss): risk premium, assessing the probability of loss exposure after the audit engagements.
The first component (p*q) of the model represents the audit effort needed and is based on the inherent risk and the control risk. The inherent risk represents the risk that a significant error exists in the financial statements, while the control risk is the risk that the firm-internal control could not detect it. Hence, auditors charge higher audit fees for firms with a higher risk level to compensate their effort. Firms with higher/lower agency problems are likely to have higher/lower audit fees. The second component of the Simunic model: E(Loss) deals with risk premium. Auditing research has extensively examined litigation risk, which is defined as the risks of incurring liability payments and damaged reputation by audit firms for signing financial statements with errors.
As previously established, family shareholding mitigates the agency conflict between manager and shareholders and negatively influences audit fees. Therefore we develop two hypotheses. The first hypothesis (H1)
states that audit fees are negatively associated with family shareholding. However, family firms face higher agency conflicts between controlling and minority shareholders, suggesting higher audit fees. Our second hypothesis (H2) states that audit fees are positively associated with family shareholding.
We use the following regression model to test our hypotheses:
AUDFEEit = 0 + 1 FAMit +
10
1 k
δk CONTROLit + Fixed effects + it
Where AUDFEE is defined by the natural logarithm of audit fees (in k$) and CONTROL denotes firm-specific variables. The test variable for H1 and H2 is FAM (family shareholding), which we proxy with two different measures: CAPFAM and FAMILY_3. CAPFAM represents the ownership of family blockholders, while FAMILY_3 is a dummy variable that takes 1 if there is a family shareholder between the top three top blockholders, and 0 otherwise. The coefficient on FAM (1) captures the audit fee discount/premium in the case of family shareholding. We expect (1) 1 to be negative if the principal–agent conflict dominates the principal–principal conflict or (2) 1 to be positive in the case of the prevalence of principal–principal conflict.
Consistent with the Simunic model (1980), our audit fees model includes two types of firm-specific control variables, which control for (1) audit costs (size and complexity) and (2) the risk premium. Size is coded by SIZE (natural logarithm of total assets expressed in k$). We proxy for client complexity using INVREC (sum of inventories and receivables, scaled by total sales), LOGNBS (natural log of (number of business segments+1)) and INTPCT (percentage of international sales). To measure the client-specific litigation risk, we include LOSS (potential firm loss), LEV (firm leverage), and ROA (Return On Assets). We also include the audit firm size (BIG) to capture the Big 4 premium (Hay et al., 2006) and the busy season (YEAR_PEAK) to capture the auditor’s peak activity at December 31 (Hay et al., 2006). We also control for the industry in which the client is operating and include BTM (Book-to-Market ratio) to assess the audit demand effect. All model specifications include year-fixed effects and industry-fixed effects.
III. SAMPLE AND DESCRIPTIVE STATICTICS
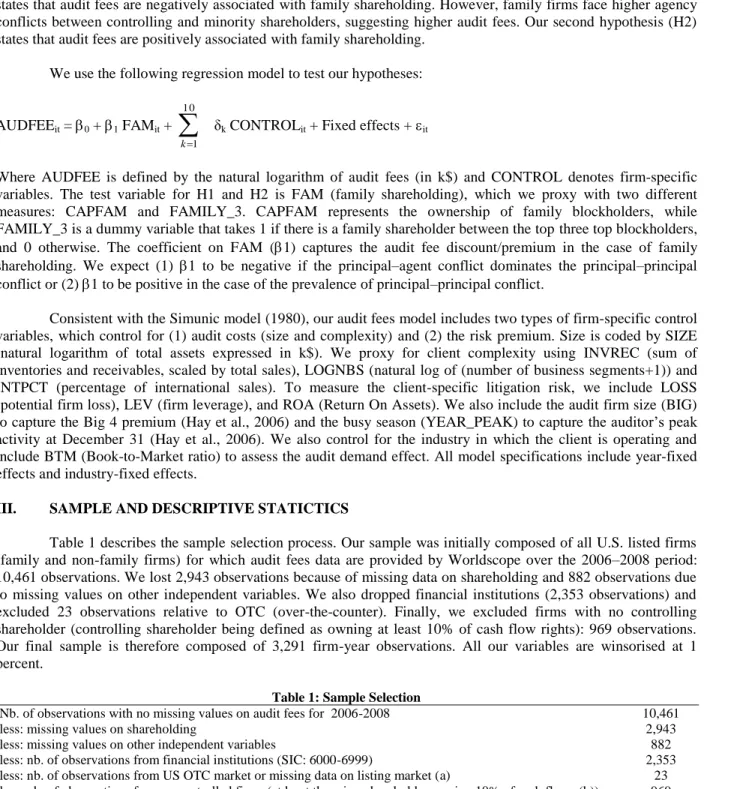
Table 1 describes the sample selection process. Our sample was initially composed of all U.S. listed firms (family and non-family firms) for which audit fees data are provided by Worldscope over the 2006–2008 period: 10,461 observations. We lost 2,943 observations because of missing data on shareholding and 882 observations due to missing values on other independent variables. We also dropped financial institutions (2,353 observations) and excluded 23 observations relative to OTC (over-the-counter). Finally, we excluded firms with no controlling shareholder (controlling shareholder being defined as owning at least 10% of cash flow rights): 969 observations. Our final sample is therefore composed of 3,291 firm-year observations. All our variables are winsorised at 1 percent.
Table 1: Sample Selection
Nb. of observations with no missing values on audit fees for 2006-2008 10,461
less: missing values on shareholding 2,943
less: missing values on other independent variables 882
less: nb. of observations from financial institutions (SIC: 6000-6999) 2,353
less: nb. of observations from US OTC market or missing data on listing market (a) 23
less: nb. of observations for non-controlled firms (at least there is a shareholder owning 10% of cash flows (b)) 969
Total Data 3,291
(a) U.S. OTC market requirements are lower for auditors (Leuz et al., 2008). (b) Following La Porta et al. (1999), we consider 10% ownership level to define the controlling shareholders.
Similarly to Anderson and Reeb (2003), we notice that prior research presents poor definitions of family firms and provides limited guidance on how to ascertain family firms. However, although many studies did not give precise details on how to proxy family firms, most studies consider firms in which founders or their family members are blockholders to be family firms (Ali et al., 2007; Chau & Gray, 2010; Ho & Fei, 2013). We define firms as being
family firms when one of the top three major blockholders is a member of the founding family. We use the Thomson ONE Banker database to identify the nature of a blockholder.
Table 2 shows descriptive statistics of key variables. Audit fees range between $190,000 and $44 million and are, on average, over $3 million. Our sample consists of 21.7% of family-controlled firms that have on average 5.317% of cash flow rights. We find that family shareholding ranges between 0% and 69.99%. Finally, Table 2 shows the broad range of control variables, which illustrates the diversity of the selected firms within our sample.
Table 2: Descriptive Statistics
No. of observations Median Mean Minimum Maximum
AUDIT FEES 3,291 1,746 3,618 190 44,208 FAMILY_3 3,291 0 0.217 0 1 CAPFAM 3,291 0 5.317 0 69.99 SIZE 3,291 13.824 14.028 11.416 18.678 INVREC 3,291 0.245 0.256 0.022 0.748 INTPCT 3,291 0.22 0.284 0 0.993 LOGNBS 3,291 1.099 1.083 0.693 2.197 LOSS 3,291 0 0.17 0 1 ROA 3,291 6.303 5.194 -38.888 32.072 LEV 3,291 0.202 0.217 0 0.708 BTM 3,291 0.429 0.482 0.044 1.467 BIG 3,291 1 0.871 0 1 YEAR_PEAK 3,291 1 0.598 0 1
The variables are defined as follows: AUDIT FEES = audit fee in thousands of U.S dollars; FAMILY_3 = 1 if there is a family shareholder between the top three major blockholders, 0 otherwise; CAPFAM = % of family shareholders cash flow rights on total cash flow rights; SIZE = natural log of assets in thousands of U.S dollars; INVREC = sum of inventories and receivables divided by total sales; INTPCT = foreign sales divided by total sales; LOGNBS = Log (number of business segments+1); LOSS = 1 if a firm reports a loss; ROA = return on assets; LEV = ratio of year-end total debt to total assets; BTM = book-to-market ratio; BIG = 1 if a firm uses one of the big 4 auditors, 0 otherwise; YEAR_PEAK = 1 if firm i ends its fiscal year end at December 31, and 0 otherwise.
Table 3 discloses the correlation matrix of the dependent variable: AUDFEE (natural logarithm of audit fees (in k$)) and the whole set of independent variables. This matrix shows that AUDFEE is negatively and significantly correlated at 1% to family ownership (CAPFAM), the presence of a family-controlling shareholder (FAMILY_3), and book-to-market (BTM) and at 5% to the occurrence of a loss (LOSS). AUDFEE is also positively and significantly correlated at 1% to client size (SIZE), inventories and receivables (INVREC), international sales (INTPCT), business segments (LOGNBS), leverage (LEV) and audit quality (BIG). The direction of correlations is consistent with prior research on control variables and support the alignment effect developed in our first hypothesis. However, we must run the multivariate analysis before reaching any conclusion on the relations. The correlation between the two measures of family shareholding (CAPFAM and FAMILY_3) equals 0.773 and is significant at 1%. However, these two variables are presented in two different model specifications in the next section. Except for the correlation between the two performance measures (ROA and LOSS), the magnitudes of the pairwise correlations among control variables do not exceed 0.4. Hence, we may have no multicollinearity concerns.
Table 3: Correlation Matrix
AUDFEE CAPFAM FAMILY_3 SIZE INVREC INTPCT LOGNBS LOSS ROA LEV BTM BIG YEAR_PEAK
AUDFEE 1.00 CAPFAM -0.303*** 1.00 FAMILY_3 -0.276*** 0.773*** 1.00 SIZE 0.801*** -0.303*** -0.275*** 1.00 INVREC 0.066*** 0.00 -0.02 -0.031* 1.00 INTPCT 0.398*** -0.160*** -0.143*** 0.240*** 0.293*** 1.00 LOGNBS 0.367*** -0.084*** -0.075*** 0.316*** 0.084*** 0.106*** 1.00 LOSS -0.038** -0.03 -0.056*** -0.114*** 0.03 0.01 -0.082*** 1.00 ROA 0.02 0.040** 0.060*** 0.083*** -0.050*** 0.01 0.049*** -0.730*** 1.00 LEV 0.183*** -0.062*** -0.071*** 0.290*** -0.067*** -0.080*** 0.082*** 0.092*** -0.184*** 1.00 BTM -0.054*** 0.033* 0.02 -0.032* 0.071*** -0.056*** 0.038** 0.165*** -0.278*** 0.02 1.00 BIG 0.363*** -0.254*** -0.223*** 0.327*** -0.098*** 0.132*** 0.076*** 0.00 0.00 0.082*** -0.110*** 1.00 YEAR_PEAK 0.02 0.00 -0.02 0.049*** -0.044** -0.02 0.051*** 0.059*** -0.036** 0.149*** -0.048*** -0.01 1.00 * p < 0.10, ** p < 0.05, *** p < 0.01; N = 3,291
IV. RESULTS
Table 4 presents the regression results. All tables presented here report the ordinary least squares (OLS) estimates for the models discussed above. P-values are computed using robust standard errors. We include a fixed-year effect and a fixed industry effect in all regressions.
Table 4: Regression Results
Pred. signs b/se p b/se p
CAPFAM n/d -0.002** 0.015 -0.001 FAMILY_3 n/d -0.058** 0.021 -0.025 SIZE + 0.509*** 0.000 0.508*** 0.000 -0.008 -0.008 INVREC + 0.140 0.094 0.142 0.089 -0.084 -0.084 INTPCT + 0.590*** 0.000 0.588*** 0.000 -0.039 -0.040 LOGNBS + 0.327*** 0.000 0.327*** 0.000 -0.027 -0.027 LOSS + 0.105*** 0.006 0.107*** 0.005 -0.038 -0.038 ROA - -0.003 0.050 -0.003 0.053 -0.001 -0.001 LEV + -0.032 0.594 -0.029 0.626 -0.060 -0.060 BTM - -0.090** 0.016 -0.089** 0.017 -0.037 -0.037 BIG + 0.280*** 0.000 0.277*** 0.000 -0.032 -0.032 YEAR_PEAK + -0.016 0.453 -0.015 0.480 -0.021 -0.021 _cons -0.623*** 0.001 -0.614*** 0.001 -0.187 -0.187
Year effects Included Included
Industry effects Included Included
Number of observations 3,291 3,291
Adj.R2 0.732 0.732
p-value 0.000 0.000
** p < 0.05, *** p < 0.01 (two-tailed)
Table 4 shows the results of applying our audit fee model. Consistent with prior research, our model explains approximately 73% of the variation in audit fees. With the exception of INVREC, LEV, ROA, and YEAR_PEAK, all variables are at least significant at the 5% level. We find a negative significant association between audit fees and (1) CAPFAM (coeff.: -0.002, p < 0,051) and (2) FAMILY_3 (coeff.: -0.058, p < 0,05). This validates our first hypothesis. These results suggest that after controlling for other risk factors, auditors consider agency conflicts in determining audit fees. The negative coefficients of the two family variables support prior research. Indeed, “compared to non-family firms, family firms face less severe action and hidden-information agency problems due to the separation of ownership and management” (Ali et al., 2007). Auditors charge lower audit fees because of reduced effort and risk when auditing family firms. As previously developed, two arguments exist for a negative (alignment effect) or a positive (entrenchment effect) relation between audit fees and family shareholding. Our results confirm that the alignment effect dominates the entrenchment effect of family shareholding and are consistent with the findings of Ali et al. (2007). We suggest that the audit fees discount resulting from the reduced manager-shareholders agency problem exceeds the audit fees premium resulting from the increase of the principal-principal agency problem.
With respect to our predicted signs on control variables, we find a positive and significant relation at the 1% level between audit fees and (1) size measured by the natural logarithm of total assets, (2) the proportion of
international sales, (3) the number of business segments, the occurrence of a loss and (4) the big 4 premium. Table 4 also reports a negative and significant coefficient of the BTM variable (coeff.: -0.09, p < 0,05). This last result is consistent with the audit demand effect.
V. ROBUSTNESS ANALYSES
Given the significance of size in audit fee models (Hay et al., 2006), we also use a second proxy for client size: SALES (natural logarithm of sales expressed in k$). Results are qualitatively similar. Table 5 presents the regression results and shows that audit fees are negatively associated with (1) family shareholdings (coeff.: -0.003, p < 0,01) and (2) the existence of a controlling family (coeff.: -0.087, p < 0,01). These results confirm the expected discount of audit fees due to family block-holding.
Table 5: Robustness Analyses
Pred. signs b/se p b/se p
CAPFAM n/d -0.003*** 0.010 0.000 FAMILY_3 n/d -0.087*** 0.010 -0.030 LOGSALES + 0.506*** 0.000 0.507*** 0.000 -0.010 -0.010 INVREC + 0.604*** 0.000 0.602*** 0.000 -0.130 -0.130 INTPCT + 0.713*** 0.000 0.716*** 0.000 -0.060 -0.060 LOGNBS + 0.220*** 0.000 0.220*** 0.000 -0.040 -0.040 LOSS - 0.060 0.130 0.060 0.150 -0.040 -0.040 ROA + -0.006*** 0.000 -0.006*** 0.000 0.000 0.000 LEV - 0.258*** 0.000 0.254*** 0.000 -0.080 -0.080 BTM + -0.112** 0.020 -0.113** 0.020 -0.050 -0.050 BIG + 0.264*** 0.000 0.267*** 0.000 -0.050 -0.050 YEAR_PEAK + 0.030 0.330 0.030 0.350 -0.030 -0.030 _cons -0.546 0.060 -0.557 0.050 -0.290 -0.290
Year effects Included Included
Industry effects Included Included
Number of observations 3,291 3,291
Adj.R2 0.738 0.738
p-value 0.000 0.000
** p < 0.05, *** p < 0.01 (two-tailed)
VI. CONCLUSION
This study considers the relationship between audit fees and both family control and ownership in the U.S. context. Indeed, family firms face lower principal–agent conflict and higher principal–principal conflict compared to widely held firms. Our objective is to examine auditors’ sensitivity to agency conflicts in family firms. Understanding how auditors charge fees for family firms is important for at least two reasons: (1) Family businesses are an important part of the world economy (Anderson & Reeb, 2003); (2) Prior audit studies focused on widely held firms despite a call for research on the auditing of family firms (Trotman & Trotman, 2010).
Using a sample of 3,291 firm-year observations of major U.S. listed companies, for the 2006–2008 period, we find that audit fees are negatively associated with family cash flow rights and the presence of a controlling
family. These results are robust to alternate measures of client size and consider most control variables identified by prior research (Choi et al., 2009). Our findings provide an interesting perspective on the determination of audit fees as well as on the agency conflicts of family firms, namely that in family firms audit fees include a discount due to the decreased agency conflict between manager and shareholders. Consistent with previous studies, family firms face higher principal–principal conflicts and lower principal–agent conflicts compared to non-family firms (Ali et al., 2007). However, our study posits that when considering the global effect of these two agency conflicts, family firms face lower agency problems compared to non-family firms, suggesting that the decrease in manager-shareholders conflict dominates.
Our research is subject to some limitations. First, following Fan and Wong (2005), we assume that controlling and management ownership are stable over the studied period. Second, we focus only on the U.S. context, where the market is well-regulated and investors are highly protected. Similarly to the Maury (2006) study, we find that family ownership in well-regulated environments does not seem to harm minority shareholders but instead profit them. Despite these limits, our findings have implications for policymakers from other institutional settings and could serve to encourage them to enforce investor protection. Indeed, by improving minority shareholder protection, the efficiency gains from family control generates higher value creation, which can benefit all shareholders of a firm. Also, our study contributes to our understanding of the complex relationships between audit fees and ownership structure, which remains very limited (Hay et al., 2006; Ben Ali & Lesage, 2012). Future research is needed to evaluate the generality of our results in other institutional contexts.
AUTHOR INFORMATION
Chiraz Ben Ali, Ph.D. Associate Professor at IPAG Business School, France. E-mail: chiraz.benali@ipag.fr (Corresponding author)
Cédric Lesage, Ph.D. Head of the Department of Accounting and Management Control at HEC Paris, France. E-mail: lesage@hec.fr
REFERENCES
1. Ali, A., Chen, T.-Y., & Radhakrishnan, S. (2007). Corporate disclosures by family firms. Journal of Accounting and Economics,44(1-2), 238-286.
2. Anderson, R. C., & Reeb, D. M. (2003). Founding-family ownership and firm performance: Evidence from the S&P 500. Journal of Finance,58(3), 1301-1328.
3. Ben Ali, C., & Lesage, C. (2012). Audit pricing and nature of controlling shareholders: Evidence from France. China Journal of Accounting Research,6(1), 21-34.
4. Chau, G., & Gray, S. J. (2010). Family ownership, board independence and voluntary disclosure: Evidence from Hong Kong. Journal of International Accounting, Auditing and Taxation,19(2), 93-109.
5. Chen, S., Chen, X. I. A., & Cheng, Q. (2008). Do family firms provide more or less voluntary disclosure?
Journal of Accounting Research,46(3), 499-536.
6. Choi, J.-H., Kim, J.-B., Liu, X., & Simunic, D. A. (2009). Cross-listing audit fee premiums: Theory and evidence. Accounting Review,84(5), 1429-1463.
7. Dechun, W. (2006). Founding family ownership and earnings quality. Journal of Accounting Research, 44(3), 619-656.
8. Fan, J. P. H., & Wong, T. J. (2005). Do external auditors perform a corporate governance role in emerging markets? Evidence from East Asia. Journal of Accounting Research,43(1), 35-72.
9. Hay, D. C., Knechel, W. R., & Wong, N. (2006). Audit fees: A meta-analysis of the effect of supply and demand attributes. Contemporary Accounting Research,23(1), 141-191.
10. Ho, J. L., & Fei, K. (2013). Auditor choice and audit fees in family firms: Evidence from the S&P 1500.
Auditing,32(4), 71-93.
11. Ho, S., & Wong, K. S. (2001). A study of the relationship between corporate governance structures and the extent of voluntary disclosure. Journal of International Accounting, Auditing & Taxation,10(2), 139-156. 12. Holderness, C. G. (2009). The myth of diffuse ownership in the United States. Review of Financial Studies,
13. Hope, O.-K., Langli, J. C., & Thomas, W. B. (2012). Agency conflicts and auditing in private firms.
Accounting, Organizations & Society,37(7), 500-517.
14. Jaggi, B., & Leung, S. (2007). Impact of family dominance on monitoring of earnings management by audit committees: Evidence from Hong Kong. Journal of International Accounting, Auditing & Taxation, 16(1), 27-50.
15. Jensen, M., & Meckling, W. (1976). Theory of the firm: Managerial behavior, agency costs and ownership structure. Journal of Financial Economics,3(4), 305-360.
16. Khalil, S., Magnan, M. L., & Cohen, J. R. (2008). Dual-class shares and audit pricing: Evidence from the Canadian markets. Auditing,27(2), 199-216.
17. La Porta, R., Lopez-de-Silanes, F., & Shleifer, A. (1999). Corporate ownership around the world. Journal of Finance,54(2), 471-517.
18. Lennox, C. (2005). Management ownership and audit firm size. Contemporary Accounting Research, 22(1), 205-227.
19. Leuz, C., Triantis, A., & Yue Wang, T. (2008). Why do firms go dark? Causes and economic consequences of voluntary SEC deregistrations. Journal of Accounting & Economics,45(2/3), 181-208.
20. Maury, B. (2006). Family ownership and firm performance: Empirical evidence from Western European corporations. Journal of Corporate Finance,12(2), 321-341.
21. Simunic, D. A. (1980). The pricing of audit services: Theory and evidence. Journal of Accounting Research,18(1), 161-190.
22. Trotman, A. J., & Trotman, K. T. (2010). The intersection of family business and audit research: Potential opportunities. Family Business Review,23(3), 216-229.
23. Wang, D. (2006). Founding family ownership and earnings quality. Journal of Accounting Research,44(3), 619-656.