Risk mitigating strategies in the food supply chain
Swati Agiwal
Department of Applied Economics University of Minnesota
agiwa001@umn.edu
Hamid Mohtadi
Department of Applied Economics University of Minnesota Department of Economics, University of Wisconsin at Milwaukee
mohtadi@umn.edu, mohtadi@uwm.edu
April 2008
Selected Paper prepared for presentation at the American Agricultural Economics
Association Annual Meeting, Orlando, FL, July 27-29, 2008.
Copyright 2008 by Swati Agiwal and Hamid Mohtadi. All rights reserved. Readers may make verbatim copies of this document for non-commercial purposes by any means, provided that this copyright notice appears on all such copies.
Abstract
Food safety events in the recent past have generated significant media attention and resulted in increased concerns over the food on the plate. A recent study (Degeneffe et al., 2007) on consumer perceptions of bio-terrorism and food safety risks shows increasing concern over food safety and corresponding decreasing confidence in security of the U.S. food supply. While there are some mandated safety and security practices for thefirms in the food supply chain the economic incentives for the firms to actively address food safety throughout the supply chain are less clear. Security practices often require significant investments in both within the firm and across the supply chain but do not show tangible returns. Also, higher investments in securing the firms’ processes and products do not necessarily make the food products more safe if the supply chain partners exhibit higher risks. However, a risk that is realized can potentially bankrupt the firm. Some high-profile cases of food safety outbreaks have had substantial economic consequences such as, lost sales, recall and compensation costs, damaged goodwill and hence impact on future markets. Such incidents can lead the firms out of business and the impact is not contained just at the firm level but also felt throughout the food supply chain.
The issues of economic incentives and disincentives for risk mitigation strategies and investments, in a highly vulnerable area such as food sector, are an emerging area of concern both in private and public sector management as well as academic research. The research questions of interest that this paper addresses are: How much should the firm invest to address the security and safety risks that it faces? The optimum investment levels, among other things, are a function of the probabilities of contamination levels exceeding the maximum acceptable standards set. We consider a specification for the contamination levels follow gamma distribution as it exhibits the fat tail
property which suggests that extreme events are more likely than predicted by the normal Gaussian form. Previous work by Mohtadi and Murshid(2007) has highlighted the fat-tail nature of extreme events for chemical, biological and radionuclear (CBRn) attacks, which are of intentional nature. However, for food safety risks of unintentional nature the fat-tail nature of the distribution though suggested, is not yet established in literature. The present model leaves less scope for analytical solutions but lends itself to numerical methods, which we employ to examine thefirm strategies.
Our preliminary model and its analysis suggest that infact for very low levels of risk exposure no investment in security is required! However, as the standards loosen and risk increases the optimum amount of investments also increase. Though the result here are intuitively consistent, they are largely dependent on the parametric specification of the model and their sensitivity to the parameter values is yet to be tested.
1
Introduction
One of the most important supply chain networks in the U.S. economy is the food supply chain, which includes crops, livestock, distribution, processing, retail, transportation and storage and accounts for about 13 percent of the U.S. GDP and around 18 percent of domestic employment (FDA report, 2003). While there are several pressing issues facing the U.S. food supply- climate change, nutrition and obesity, genetic tinkering, carbon footprinting to name a few, the two key questions that have garnered much attention of late are: (1) Is the food safe?; (2) Is the supply chain secure?
1.1
Unintentional risks
This highly critical U.S. "farm-to-table chain" has also been exposed to many inadvertant conta-mination events resulting in over 76 million illnesses, 325,000 hospitalizations, and 5,000 deaths each year in the U.S. (FDA report, 2003). Some major food related outbreaks both within U.S. and internationally worth reiterating are: Outbreak of Salmonella typhimurium infection that af-fected approximately 170,000 people in 1985 and was linked to post-pasteurization contamination of milk from a U.S. dairy plant; An outbreak of hepatitis A caused by tainted clams affected nearly 300,000 people in China in 1991; Outbreak of Salmonella Enteritidis infection in 1994, linked to contaminated ice cream pre-mix sickening an estimated 224,000 people in 41 states in the U.S; E. coli 0157:H7-tainted radish sprouts served in school lunches, in 1996, that resulted in about 8,000 children in Japan getting ill, and some dead; Foot and Mouth Disease(FMD) epidemic 2001 in UK involving 2030 cases spread across the country, with about 6 million animals culled (4.9 million sheep, 0.7 million cattle and 0.4 million pigs), resulting in losses of some £3.1 billion to agriculture and the food chain (Defra report, 2004); the 2006 E. coli 0157:H7 outbreak in spinach. These food
safety risks arise not only due to microbial agents but also from significant residuals from pesticides, toxic chemicals and even due to mislabeling of products containing allergens. The U.S. food supply chain has significantly global interlinkages with the rest of the world. This has further contributed to an increase in its own exposure to the food safety risks and vulnerabilities that its trading country firms face. For example, in 1989, approximately 25,000 people in 30 states in the U.S. were sickened by Salmonella chester in cantaloupes imported from Mexico. In 1996 and 1997, 2,500 people in 21 states in the U.S. and two Canadian provinces developed Cyclospora infections after eating tainted Guatemalan raspberries. More recently, in March 2007, pet food contamination through tainted wheat gluten imported from China, sickened and killed a large unknown number of pets, largely cats and dogs1.
1.2
Intentional risks
Cases of intentional contamination, as opposed to unintentional contamination incidents, are not very infrequent either. World Health Organization (WHO) (2002) report on terrorist threats to food considers food terrorism as a real and current threat, and that deliberate food contamination at one location could have global public health implications. There have been reported intentional contamination incidents of salad bars with salmonella bacteria, food at a laboratory with Shigella dysenteriae, 200 pounds of ground beef with a nicotine based pesticide within the U.S (FDA, 2003). The most detailed chronology to date of intentional use of chemical, biological and radionuclear (CBRn) agents worldwide that involve food events, though not limited to them, (Mohtadi and Mur-shid, 2006), is available at the website of the National Center for Food Protection and Defense.
1There are only 14 cases reported but due to lack of database on animal sickness an exact number is unavailable.
Mohtadi and Murshid (2006) analyze CBRn event data using extreme value theory that suggests probability distributions of extreme events such as food terrorism have fatter tails than those pre-dicted by normal distribution. This implies greater frequency of such extreme events than that predicted by the normal distributions. Many of the contamination agents in the case of intentional events are the same pathogens that have been linked to significant outbreaks of foodborne illness due to unintentional contamination. Thus, outbreaks not linked to criminal intent can actually expose the vulnerabilities in food supply and may increase the threat of a terrorist act.
1.3
Safety and security
Food safety is a credence2 characterisitc and hence the credibility of the food product needs to be
established by some forms of food safety policies, if the market fails to provide sufficient information about this attribute (Cho and Hooker, 2002). While there are some mandated safety and security practices for the firms in the food supply chain the issue of economic incentives for the firms to actively address food safety throughout the supply chain is unclear. These practices often require significant investments in capital3 and labor4 too, but do not have tangible returns. It is difficult to
estimate the value of preventing a safety incident. However, a risk that is realized can potentially bankrupt thefirm5. Some high-profile cases of food safety outbreaks have had substantial economic
consequences such as, lost sales, recall and compensation costs, damaged goodwill and hence impact
2Safety is a credence characteristic of a product. This implies that it is an attribute of the product that cannot be
observed or inferred by direct inspection, on consumption or even after consumption (Latvala and Kola, 2004).
3for example, pasteurizing euipment for milk
4for example, education and training in safe food handling practices
5E. coli contamination of ground meat led to bankruptcy of Topp’s Meat company, which by 2007 was one of the
on future business. Although such incidents can lead the firms out of business, the impact is not contained just at the firm level but also felt throughout the food supply chain. Supply chains are often faced with various risks of supply disruptions and uncertain demand conditions, these food safety events and security events arising from either intentional or unintentional events pose risks that are above and beyond the common operational and market risks, bringing the overall level of risk to unprecedented new levels. There is a greater emphasis in highlighting the role of product safety, especially in the food industry, given the recent spate of several high profile food safety incidents (such as recalls for ground beef, pet food, green onions and spinach scare, etc.) and decreasing consumer confidence in food supply (Degeneffe et al., 2007).As a result, a supply chain manager’s "best practice" model today is to strive to achieve not only a fully integrated and efficient supply chain, capable of creating and sustaining competitive advantage (Christopher and Towill, 2002), but also one with sufficient flexibility and redundancy to enable the firm to respond to extreme events (Sheffi 2005). Natural calamities, port lock-outs, labor disputes, terrorist events, major recalls, outbreaks and epidemics are examples of such intentional and unintentional events that lie beyond market uncertainties and could cripple not just firms but entire supply chains. There is a strong argument for building robust and flexible systems that effectively handle contamination incidents and increase the buoyance of thefirm in the wake of an event (Sheffi, 2005).
1.4
Research Approach
Firms’ investments in safety and security measures can be braodly classified into two areas: firm-centric investments that secure thefirms’ own premises, such as investments in information systems, employee training and education, Hazard and Critical Control Point(HACCP); supply chain
collab-oration efforts and investments, such as verification of supply chain partner’s safety and security measures, auditing partners’ procedures, colloborating on security training and education. In this paper we attempt to model the strategies of the firms along these two broad but complementary areas of investments. Wefind a strong argument for this approach in an earlier work by Agiwal and Mohtadi(2008). Thus, the question of interest then is: How much should the firm invest in each of these areas given the risky nature of its operations. The model presented here is in its development stage and hence the the results provided here are preliminary. We discuss the possible areas of improvement and extension to the present model.
2
Past studies on security investments
Most research on supply chain revolves around issues in inventory management, network planning, coordinating demand and supply, logistics and such which have resulted in better tools and tech-nologies for supply chain managers and improved the overall process and performance. Planning for supply chain disruption risks is also an actively researched area (Kleindorfer and Saad, 2005; Tomlin, 2006; Hendricks and Singhal, 2005; Jüttner, Christopher and Lee, 2004; Chopra et al., 2007) although most of the focus is on managing disruption risks arising out of normal operations of thefirm. Post 9/11, however, there is increased concern on risks arising out of extreme events like terrorism, natural calamities, port lockouts and also food safety outbreaks (given the recent surge in such events). There is limited but growing amount of literature on justifying supply chain security investments (Sheffi, 2001 and 2005, Peleg-Gillai et al. 2006) and improving security quality (Lee and Whang, 2003). The methodological focus in these studies has been on experiential analyses.
plan-ning can significantly mitigate the effect of a disruption: Home Depot’s policy of planning for various types of disruptions based on geography helped it get 23 of its 33 stores within Katrina’s impact zone open after one day and 29 after one week. Wal-Mart’s stock pre-positioning helped make it a model for post hurricane recovery. Similarly, Nokia weathered the 8 minutefire at Phillips semi-conductor plant in 2001 through superior planning and quick response, allowing it to capture a substantial portion of its slow-to-respond competitor Ericsson’s market share. Sheffi(2005) makes a case for two types of investments — security investments encompassing security and safety concerns, and re-silience investments that are directed towards buildingflexibility and redundancy to protect against disruption risks. Hendricks and Singhal (2003,2005) analyzed announced shipping delays and other supply chain disruptions reported in the Wall Street Journal during 1990s and showed based on matching sample comparisons, thatfirms experiencing disruptions under-perform their peers signif-icantly in stock performance as well as operating performance as reflected in costs, sales, and profits (Kleindorfer and Saad, 2005). The globalization of the supply chain with suppliers, manufacturers, retailers and consumers spread far and wide for most of the products makes the supply chain more vulnerable. Hence when thinking about reducing firm’s vulnerability to disruptive events, Sheffi
and Rice (2005) advocates that managers need to look into increasing not just safety measures but also safety awareness and a proactive safety culture thereby making firms and supply chains more resilient.
Food safety events in the recent past have generated significant media attention and resulted in increased concerns over the food on the plate. A recent study (Degeneffe et al., 2007) conducted in three waves (July 2005, March 2007, May 2007) on consumer perceptions of bio-terrorism and food safety risks shows increasing concern over food safety and corresponding decreasing confidence in
safety of the food supply. The findings also suggest an increasing concern over potential terrorist events in the food supply, although post 9/11 no such incident of national significance has been reported. However, there have been widely publicized food recalls and food safety incidents. All this is suggestive of a significant confounding between food safety and food terrorism incidents in the U.S. consumers. Comparing this confounding between safety and security risks to the guidelines established by the World Health Organization (WHO), which state that the outbreaks of both unintentional and deliberate foodborne diseases can be managed by the same mechanisms (WHO, 2002), indicate the spillover effects of food safety investments from increasing safety to improving security and vice versa. There are strategic complementarities that arise from investments in safety and security in addressing both inadvertent and delibrate risks in the food supply and in this research we focus on such complementary nature of investments.
Mohtadi et al.(2007) investigate a question similar to the one addressed in our research, of opti-mum investments for food safety breaches of intentional nature. This study focuses on catastrophic risks in the food sector and they use a probability model calibrated using data from Chemical Bi-ological and Radionuclear (CBRn) attacks from 1960 to 2005. While catastrophic risk insurance is available for specifically such types of risks this study cites the limited availability of such forms of insurance. Muermann and Kunreuther (2006) study on optimal investment in self-protection of insured individuals implies that in a market equilibrium there would be underinvestment in self-protection. The Terrorism Risk and Insurance Protection Act of 2002 was established precisely for federal provision of insurance claims in the case of such terrorism events. However, this provision is set to phase out by the end of this year(2007). Kunreuther and Michel-Kerjan(2006) paper points out that in the wake of 9/11 attacks, natural disasters and the significant stock market declines,
most reinsurers were left with a significantly reduced capital base, which resulted in them reducing their terrorism coverage drastically or even completely stopping from covering this risk. USDA’s Economic Research Service (ERS) has estimated the medical costs and productivity losses that can be expected to occur from E. coli 0157:H7 infection. The estimates range from $216 million annu-ally for the low estimate of cases to $580 million annuannu-ally for the high estimate. This places it as the fourth most costly foodborne disease for which ERS has estimated costs, behind one parasite (Toxoplasma gondii) and two bacteria (Salmonella and Campylobacter)(Marks, 2007).
For modeling investment strategies for firms where there are significant interdependencies and hence spillovers of both risks and benefits, a game theoretic approach has been considered and developed in a series of papers by Kunreuther and Heal (2004, 2005 and 2006). Their work highlights the fact that when expectations about others’ choices influence investments in risk-management then the outcome can be sub-optimal for everyone. They look at terrorism risks in airline industry (2005) as well as the common features of pollution risks, computer security breaches and airline baggage risks (2005). When accounting for the adaptive nature of such security risks Cremonini and Nitzovtsev (2007) show that the effect of a given security measure is much stronger and not calculating this in could lead to underinvestment in security or even a misallocation in security resources. Similar to the framework developed by the Kunreuther and Heal body of work, Zhuang et al. (2007) examine the equilibrium strategies for multiple interdependent defenders in a model where threats occur over time. Their study shows that existence of myopic agents can make it undesirable for non-myopic agents to invest in security when it wold be otherwise in their interests to do so and hence they explore subsidizing strategies for such investments. While the studies cited here use a horizontally interdependent framework, our analysis focuses on the interdependences that arise in a vertical,
supply chain framework.
The other stream of literature relevant to this research is in the area of computer security. To promote the disclosure and sharing of cyber security information amongfirms, the U.S. federal gov-ernment has encouraged the establishment of many industry-based Information Sharing and Analysis Centers (ISACs) (under Presidential Decision Directive(PDD) 63 in 2001) for critical infrastructure, of which IT is one, as well as internet security reporting centers such as Computer Emergency Re-sponse Team (CERT) and InfraGard (Gal-Or and Ghose, 2005). This is has spurred the debate on economic incentives for information sharing and has led to developing a new focus area on economics of information security. Some relevant papers that deal with security investments in this area by Gal-Or and Ghose (2005), Gordon and Loeb (2002), Gordon, Loeb and Lucyshyn (2003). These papers provide economic models for both information sharing and security investments in informa-tion sharing technologies. Gordon and Loeb (2002) provides a general framework for determining optimum security investments for protecting an information set with a specific vulnerability and a given potential loss. An empirical analysis by Tanaka et al. (2005) of e-local government in Japan supports such relation between vulnerability and investment. The model the decision problem of a risk-neutralfirm to determine the amount to invest in information security by comparing expected benefits of the investment with cost of the investment and using two different functional specifica-tions for security breach probability. Their model predicspecifica-tions are that the optimal investment in information security is always less than or equal to 36.79% (or 1/e) of the loss that would be expected in the absence of any investment in security. However their model does not address the problem of externalities arising from the security investments. These predictions have been under attack by Hausken (2006) where he shows that alternate specifications of the security breach probability
func-tions the optimum investments can no longer be capped at 36.79% of the losses. A separate study by Willemson (2007) shows that only slightly modifying the assumptions of Gordon-Loeb (2001) security breach probability function, the optimum investments can be upto 50% or even 100% of the potential losses.
As opposed to the cost based approach used by Gordon-Loeb (2002) framework, Gal-Or-Ghose (2005) starts with a demand function facing the firm with an in-built net benefit function. Their net benefit function captures both, information sharing strategies and investments in information security and also includes the spill-over effects of information sharing. Theirfindings suggest that (1) security technology investments and security information sharing are strategic complements, and (2) joint associations like ISAs would result in higher sharing and investment levels than under market conditions, but lower than socially desirable levels.
3
Theoretical Framework
For this study we define safety as the assurnace that the contamination in the product will be contained at a maximum allowable standard. Contamination could arise due to existence of elements that were not designed to be in the product. It could be intentional or deliberate and could cover possibilities of impurities, pesticides, allergens, tampering or fatal mislabeling. Some degree of contamination is present in all products, however, the safety level in a product must be reasonably high for it to be acceptable and not lead to significant losses. We assume here that the distribution of the safety attribute follows a fat-tail distribution. This implies that the probabilities of the safety being compromised are higher than those suggested by the normal symmetric distributions. This we defend as a reasonable assumption given earlier work in the area of safety and security events
(Mohtadi et al. 2006). Also, if the cost considerations are high the rewards for maintianing higher than acceptable standards are low. But given that we do not involve pricing issues here we can assume that the safety follows a gamma distribution.
We consider a one-period model of the firm’s decision to determine its optimum security in-vestments based on risk considerations. The security inin-vestments can be in capital, equipment for sanitizing, or for inspection, or labor, such as training and education programs for employees. We do classify the investments in two broad areas offirm centric investments,kfand supply chain col-laborative investments, ks. The assumption here is that these security enhancing investments help in minimizing the potential losses that thefirm faces in case of an event. These investments can pos-sibly have spillover effects on resilience of thefirm and hence influence the estimates of losses faced by the firm. However, we do not consider such effects for now. Although the risks can come from different sources we consider safety risks that arise fromfirms association with its suppliers, primar-ily through the inputs received from the suppliers’ inputs. We assume a risk neutral manufacturer who knows the probability distribution of contamination in the inputs she receives. Alternately, the manufacturer may infer the probability distribution of contamination, based on their historical records.
Food safety and security risks have important economic considerations for thefirm. Faced with a large product recall can make a leading and established food manufacturer shut down its operations, the Topps Meat Company’s closure after facing the second largest recall of ground beef in U.S. history6 is a case in point. Thus, though firms face enormous cost considerations when deciding
6In October 2007, Topps Meat, leading manufacturer and supplier of premium branded frozen beef products for
supermarkets and mass merchandisers closed shop after 67 years in operation due to the economic impact of the
what level of food safety to choose, these considerations are not the only constraints that enter the decision managers’ planning. The losses arising from contaminated products are large and can threaten the very business of thefirms. Safety and security investments can then be thought in the context of self protection against possible losses for thefirms. Thefirms will make these investments only upto the point where the expected loss reduction is greater than the cost of investment itself. This optimum level of investment is now modeled as a function of the loss reduction benefits provided by it. The framework for determining optimum investment is based on earlier work by Gordon-Loeb (2002) and Mohtadi et al.(2007). The important distinction of the Stage 1 of model presented here with respect to Gordon and Loeb (2002) and Mohtadi et al. (2007), lies in the formulation of the expected loss. Gordon and Loeb (2002) include the concept of firm’s vulnerability, v, and a contingent loss L. The expected loss then is simply vL. Mohtadi et al. (2007) take a slightly different approach and model thefirm’s loss in profits as the expected loss. In this paper we invoke the expectd net benefit function as in Gordon and Loeb (2002) but include use risk exposure arising due to thefirm’s association with its supplier as well.
3.1
Model
Consider a single manufacturer, denoted by M, of a product, for which she sources inputs from supplier, sayS. The inputs sourced from this supplier have a certain safety level. LetX be amount of contamination level tolerated in the input received from supplierS. ThenX is a random variable probability distribution denoted byP(X)and a cumulative distribution function denoted byF(X). Suppose S has a contamination acceptance standard set at s¯, measured in terms of the amount
of contamination tolerated (say as parts per million of the input 1). Lets¯be tolerable amount of contamination acceptance standard by M. We also assume here that the dispersion parameter in the probability function for X depends on the amount of supply chain collaborative investments undertakenks.Thus, the total expected loss when no investments are made is given by,
E(L|kf = 0, ks= 0) =λ0(1−F(X = ¯s|ks)L
while, total expected loss when investmentskf andksare made is given by,
E(L|kf >0, ks>0) =λ(kf)(1−F(X = ¯s|ks)L+kf+ks
where P(X > s¯) = 1− F(X = ¯s|ks) is the probability that the contamination level in the input exceeds the contamination standards.¯
To mitigate or even reduce the risk of contamination that maybe present in the inputs received by the manufacturer, the manufacturer undertakes two types of investments-firm centric investments
kf and supply chain collaborative investments ks. These investments can be thought of as a one time costs that help reduce the loss faced by the manufacturer from λ0 (when the manufacturer makes no investments, that is,kf = 0) toλ(kf), where0≤λ(kf)≤λ0.
The loss functionλ(kf)must be such that as investmentskf increase the loss levels should fall, that is, ∂λ(kf)
∂kf <0.Also,klimf→0λ(kf) =λ0andkflim→∞λ(kf) = 0.If we assume here decreasing marginal
rate of return on investmentskf then we can specify the loss functionλ(kf):
λ(kf) =
λ0 1 +kf
where, ∂λ(kf) ∂kf = −λ0 (1 +kf)2 <0, ∂ 2λ(k f) ∂k2 f = λ0 (1 +kf)3 >0
Several functional specifications for such a loss function with decreasing marginal rate of return as specified above exist in literature (Gordon and Loeb, 2002; Mohtadi et al., 2007, Willeamson, 2007). Hausken (2006) summarizes specifications that assume logistic or bounded marginal rates of return. The notion of food safety risk is captured here by the probability distribution of contamination level in the inputs received by the manufacturer. This probability could be informed by past inspec-tion level data of each suppliers’ inputs or through historical observainspec-tion of number of outbreaks associated with the underlying input for each supplier. For purposes of illustration, here we consider that the contamination levels follow gamma distribution with scale parameter θ and shape para-meter η. Ifη is an integer then one can think of the distribution representing sum of η events of contamination level exceeding the specified standard, where each such event is itself exponentially distributed with meanθ.With this specification the average number of such events occurring is given byηθ(mean ofgamma(η, θ)) and the variance is given byηθ2(variance ofgamma(η, θ)). We chose gamma distribution as it exhibits the fat tail property which suggests that extreme events are more likely than predicted by the normal Gaussian form. Previous work by Mohtadi and Murshid(2007) has highlighted the fat-tail nature of extreme events for CBRn attacks, which are of intentional nature. However, for food safety risks of unintentional nature the fat-tail nature of the distribution is not yet established7. For now, we consider that each supplier has different parameters for the gamma distribution and that the contamination levels for each supplier are independent. Thus,
7The recent reporting of outbreaks and food recalls provides some support for this hypothesis, but I am still
X˜Gamma(η, θ(ks)).Then, P(x) =xη−1 e− x θ θηΓ(η) and, F(¯s) = Z ¯s 0 xη−1 e− x θ θηΓ(η)dx
Nowθhere is the scale or dispersion parameter which accounts for the variation in the data. We examine the effect of change in dispersion on the cumulative probabilities of the event andfind that,
∂(1−F)
∂θ >0 .
See Appendix A for the details. Thus, as dispersion in the data increases the cumulative prob-abilities fall and the probprob-abilities of contamination levels greater than the set standard rise. This probability of contamination level greater than a specified level is what we label as exposure to risk. This can be interpreted as - increase in risk arising due to the variability in the data increases the probability that the impurity levels exceed the set standards.
Note however, that the dispersion paramter itself is assumed to eb a function of the amount of supply chain investments made by thefirms. As thefirm invests more in supply chain collaborative efforts the dispersion in the the safety level of the attributes is assumed to decrease. This implies that thefirms that invest more in colloborative efforts have better understanding and co-ordination with their suppliers and hence lower risks arising from their association with them. We specify the dispersion as a function ofkssuch that ∂θ(k∂kss)<0and
∂2θ(k
s)
∂k2
to the loss function, that is, θ(ks) = 1+kθ0s, where θ0 is some intial value of θ not influenced by investmentsks.
The manufacturer’s problem is then to decide on the level of investments kf, ks that would maximize her benefit from investing in security. We formulate the manufacturer’s decision problem as determining the level of security investments that she must make for given acceptance standard and the probabilities of impurity levels exceeding the set standards.
Manufacturer’s problem of maximizing her expected net benefit function (ENBF) from making safety investmentskf, ks : M ax kf,ks EN BF = M ax kf,ks { E(L|kf = 0, ks= 0)−E(L|kf >0, ks>0)} = M ax kf,ks λ0(1−F(X= ¯s|ks)L−(λ(kf)(1−F(X = ¯s|ks)L+kf+ks) FOCs are: −∂λ∂k(kf) f (1−F(X = ¯s|ks))L= 1 ⇒kf = p λ0(1−F(X= ¯s|ks)L−1 and, −λ(kf) ∂(1−F(X= ¯s|ks)) ∂ks L= 1
⇒ −λ(kf) ∂(1−F(X = ¯s|ks)) ∂θ(ks) ∂θ(ks) ∂ks L= 1
The one of the second order conditions that needs to be satisfied isηθ <¯s.This implies that the acceptance standard must be sufficiently larger than the mean of the distribution. See Appendix B for details on second order conditions.
3.2
Numerical Analysis
The given problem formulation does not provide explicit analytical solution for k∗
f, ks∗.Also, note that the optimum values depend on cumulative distributions of impurity levels. From thefirst order conditions we see that for very low levels of risk exposure no firm centric investments in security are required. In fact it may be counter productive to invest inkf for lower levels of expected losses. The results forksare less clear. Any further conclusions using the analytical exposition at this stage are not clear and show great deal of dependencies on the parameters of this model. We, hence have attempted a simple numerical solution fork∗
f, ks∗.Assuming the following values for the parameters of this problem: η= 5, θ0= 5, λ0= 0.9.We use numerical methods to arrive at the optimizing values ofk∗
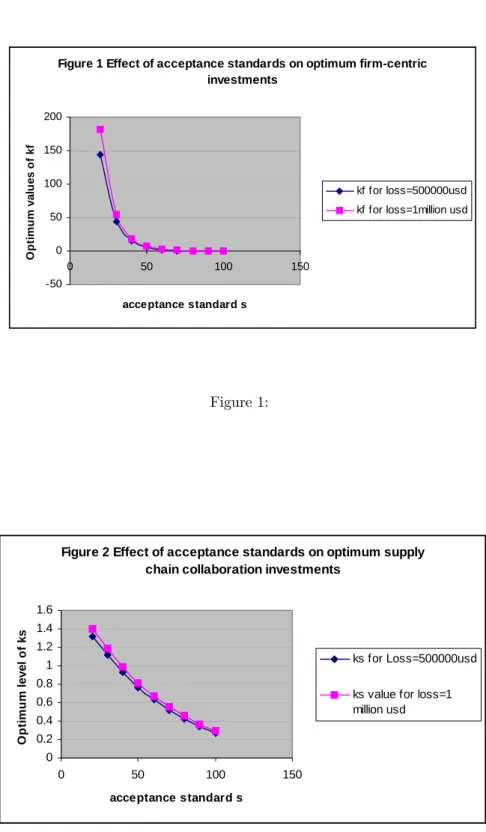
f, k∗s for different values of acceptance standard ¯sat lossesL= $500,000 and atL= $1million for illustrative purposes. The effect of tightened standards on the optimum investment levels k∗
f is illustrated in the Figure 1 and that forks∗ is illustrated in Figure 2.
Insert Figure 1 about here Insert Figure 2 about here
Thefigures illustrate that when acceptance standards are tight, that is the value ofs¯is small the optimum investments, both k∗f and k∗s are high. As the standards loosen shifting the s¯further to
the right the optimum levels of investments go down. For very high levels of tolerance for risks the optimum levels of investment are actually negative suggesting that at such high tolerance levels it is better for thefirm to not invest or even divest from security investments. This makes intutive sense, as the firm’s appetite for risk increases, its investments in reducing the risk decreases. The impact offirm centric investments is modeled to be greater than that of supply chain centric investments, which is reasonable considering thefirm faces larger liabilities for security compromises on its own premises than through risks due to its supply chain partners. The numerical solutions support this. The interesting result here is that the optimum level offirm centric investments decline much sharply as compared to supply chain investments. Firms allocate a larger share of their security investments infirm centric measures. As security investments declinek∗
f sees a much larger fall than the smaller share of k∗
s. Though the results here are intuitively consistent, they are largely dependent on the parametric specification of the model and their sensitivity to the parameter values needs to be tested.
4
Conclusions
With the given model formulation there are certain issues that we need to address. In the current version of the paper we have specified gamma distribution for its fat tail nature. Given that the results can be highly sensitive to the nature of the distribution specified we will aim to test the robustness of the results for other fat-tailed ditributions such as Pareto distribution. The loss values used here are ad hoc. Mohtadi and Murshid (2007) provide certain loss values based on their analysis andfitting of the CBRn data. We also attempt to explore different studies in the risk and insurance (Henriet et al.2006), and food safety literature for inputs in this exercise. With the present model we have not considered the interaction between thefirm and its supply chain partners that influence
the risk profile of the firm. The supply chain colloaboration investments are modeled for a firm independently of the investments made by its supply chain partners. Often there arise externalities from such investments and modeling them explicitly would lead to a fuller analysis. The influence of firm size, market power and supply chain scope are found to have significant impact onfirm’s security bhavior (Agiwal et al., 2008). Our analysis needs to be expanded to include these important considerations in thefirms optimum investment decision.
There is significant dearth of literature in the area of food safety as well as security risks faced byfirms in the food sector. The question of economic incentives and disincentives for risk mitiga-tion strategies and investments, in a highly vulnerable area such as food sector, is not sufficiently addressed. Though this is a important issue facing both, private and public sector management and policy development there is little research done to address the economic issues involved. With this paper we aim to bring to front these issues in food sector research.
References
Agiwal, Swati and Hamid Mohtadi, Jean Kinsey, "Security-Preparedness offirms in food supply chains", Sloan Industry Working Paper, April 2008
Henriet, Dominique, Michel-Kerjan, Erwann O. "Optimal Risk-Sharing Under Dual Asymmetry of both Information and Market Power: A Unifying Approach." Working Paper, 2006,.
Kleindorfer, Paul R. and Germaine H. Saad. "Managing Disruption Risks in Supply Chains." Production and Operations Management, 2005, 14 (1), pp. 53.
Sheffi, Yossi. "Supply Chain Manageemnt Under the Threat of International Terrorism." Inter-national Journal of Logistics Management, 2001, 12 (1).
Sheffi, Yossi and James B. Rice Jr., "Building the Resilient Enterprise", MIT Sloan Management Review, Vol 47, No.1, Fall 2005
Snyder, Laurence V., M. P. Scaparra, Mark S. Daskin and Richard L. Church. "Planning for Disruptions in Supply Chain Networks." INFORMS TutORials, 2006,.
Latvala, Terhi and Jukka Kola, "Consumers’ Willingness to Pay for Additional Information on Food Quality and Safety", Conference Paper, 84th EAAE Seminar, 2004
Cho, Bo-Hyun and Neal H. Hooker, "A Note on Three Qualities: Search, Experience and Cre-dence Attributes", The Ohio State University, Working Paper: AEDE-WP-0027-02, October 2002
Muermann, Alexander and Howard Kunreuther, "Self-Protection and Insurance with Interde-pendencies", Working paper, The Wharton School, December, 2006
Heal, Geoffrey and Howard Kunreuther, "Modelling Interdependent Risks", Wharton Risk man-agement and decision Processess Center, Working paper, November 2006
Resolution, Vol. 49, No. 2, April 2005
Heal, Geoffrey and Howard Kunreuther, "Interdependent Security: A General Model", Working paper, September 2004
Zhuang, Jun, Vicki M. Bier and Ashish Gupta, " Subsidies in Interdependent Security With Heterogeneous Discount Rates",The Engineering Economist, Vol. 50, 2007
Cremonini, Marco and Dimitri Nizovtsev, " Understanding and Influencing Attacker’s Decsions: Implications for Security Investment Strategies", Working paper, 2007
Gal-Or, Esther and Anindya Ghose, " The Economic Incentives for Sharing Security Informa-tion", Information Systems Research, Vol 16, No.2, June 2005
Hausken, Kjell, "Returns to information security investment: The effect of alternative security breach functions on optimal investment and sensitivity to vulnerability" Information Systems Front, Vol 8, December 2006
Gordon, Lawrence and Martin P. Loeb, " The Economics of Information Security Investment", ACM Transactions on Information and System Security, Vol. 5, November 2005
Willemson, Jan, "On the Gordon & Loeb Model for Information Security Investment", Working paper, Institute of Computer Science, University of Tartu, Estonia, 2007
Mohtadi, Hamid and Swati agiwal, "Optimum Investments to Mitigate Catastrophic Risk: Ap-plication to Food Industry Firms", Working paper, 2007
Mohtadi, Hamid and Antu Panini Murshid, "The Risk of Catastrophic Terrorism: An Extreme Value Approach", Forthcoming in Journal of Applied Econometrics, June 2007
Christopher, Maritn and Helen Peck, "Building the Resilient Supply Chain", Working Paper, Cranfield School of Management, 2006
Sheffi, Yossi, "The Resilient Enterprise", The MIT Press, 2005
FDA Statement on Foodborne Illness Risk Assessment, http://www.cfsan.fda.gov/~dms/rabtact.html#ftn24, October 13, 2003
Economic Research Services (ERS) Report on Food Safety, http://www.ers.usda.gov/briefing/foodsafety/, October 11, 2007
World Health Organization(WHO), "Terrorist Threats to Food: Guidance for Establishing and Strengthening Prevention and Resposne Systems" Food Safety Department, 2002
Christopher, M. and D.R. Towill, "Developing market specific supply chain strategies", Interna-tional Journal of Logistics Management", Vol. 13 No.1, pp.1-14.,2002
Tanaka, Hideyuki, Kanta Matsurra and Osamu Sudoh, "Vulnerability and Information Security Investment: An Empirical Analysis of e-local Governement in Japan", Journal of Accounting and Public Policy, 24:37-59, 2005
Gordon, Lawrence, Martin Loeb and William Lucyshyn, "Sharing Information on Computer Systems Security: An Economic Analysis", Journal of Accounting and Public Policy, 53(6), 2003
Lee, Hau and Seungjin Whang, "Higher Supply Chain Security with Lower Cost: Lessons from Total Quality Management", Stanford GSB Research Paper No. 1824. Available at SSRN: http://ssrn.com/abstract=465626, October 2003
Defra (Department for environment food and rural affairs) Report 2004, Animal Health and Welfare: FMD Data Archive accessed at http://footandmouth.csl.gov.uk/
Degeneffe, Dennis, Jean Kinsey, Tom Stinson and Koel Ghosh, "Consumer Perceptions of Bioter-rorism and Food Safety Risks", Working Paper, The Food Industry Center, University of Minnesota, 2007
Appendix A: E
ff
ect of increase in dispersion (scale) parameter on the cumulative
distribution for Gamma
X ~Gamma(k, θ), wherek >0is the shape parameter8,θ >0is the scale parameter,
contami-nation levelx >0
Probability density function is then given by:
f(x;k, θ) =x
k−1e−x/θ
θkΓ(k) x >0, k, θ >0 The mean iskθ and the variance iskθ2
and the cumulative density function is given by: ¯s
F(¯s;k, θ) = ¯ s R 0 uk−1e−u/θ θkΓ(k) du u >0; k, θ >0
Deriving the results for the derivative of the c.d.f. with respect to the scale parameterθ: ∂F(¯s;k,θ) ∂θ = ∂ ∂θ ¯ s R 0 uk−1e−u/θ θkΓ(k) du u >0; k, θ >0 = 1 Γ(k) ∂ ∂θ( ¯ s R 0 uk−1e−u/θ θk du) = 1 Γ(k) ∂ ∂θ ¯ s R 0 uk−1e−u/θ θk du =Γ(k)1 ¯ s R 0 uk−1 ∂ ∂θ e−u/θ θk du =Γ(k)1 ¯ s R 0 uk−1[θ−k e−u/θ u θ2 +e−u/θ(−k)θ− k−1 ]du =Γ(k)1 [θ12 ¯ s R 0 (uθ)ke−u/θdu+−k θ2 ¯ s R 0 (uθ)k−1e−u/θdu] =Γ(k)1 [θ12 ¯ s θ R 0 zke−zθdz+−θ2k ¯ s θ R 0 zk−1e−zθdz]...by transformation of variables: uθ =z⇒du=θdz = 1 Γ(k)[ 1 θ ¯ s θ R 0 zke−zdz+−k θ ¯ s θ R 0 zk−1e−zdz] = 1 Γ(k)[ 1 θγ(k+ 1, ¯ s θ) +− k θ γ(k, ¯ s θ)]...
...by definition of incomplete gamma function: a R 0 zk−1e−zdz=γ(k, a) =Γ(k)1 [1θ[kγ(k,sθ¯)−(¯sθ)ke−¯sθ1]−k θγ(k, ¯ s θ)]....
..using integration by parts: γ(k+ 1, x) =kγ(k, x)−(x)ke−x =− 1 Γ(k)( ¯ s θ) ke−s¯ θ =−Γ(k)1 (sθ¯)ke−s¯ θ ≤0
Thus, an increase in the scale parameter leads to an decrease in the cumulative distribution function unambiguously.
⇒ ∂(1−F∂θ(¯s;k, θ))≥0
Appendix B: Second order condition for maximization of Expected Net Bene
fi
t
Function
For second order cons=ditions to be satisfied the Hessian matrix must be negative definite. This impliesf11<0andf11f22−f12f21>0
Now the first term of the Hessian matrix is given byf11 = −∂
2 λ(kf) ∂k2 f (1−F(X = ¯s|ks))L < 0 (since ∂2λ(kf) ∂k2 f >0,and(1−F(X = ¯s|ks))L >0) .
Also, the cross derivatives(f12, f21)are symmetric and such that,
f12=f21= (1+k−λ0 f)2 1 Γ(k)( ¯ s θ) ke−¯s θ θ0 (1+ks)2L then, f12f21= ³ −λ0 (1+kf)2 1 Γ(k)( ¯ s θ) ke−s¯ θ θ0 (1+ks)2L ´2 >0 Now consider f22=−λ(kf)L∂ 2(1 −F(¯s;k,θ(ks))) ∂ks2 .
Decomposing, ∂2(1−F(¯s;k,θ(ks))) ∂ks2 =∂k∂ s ³ ∂(1−F(¯s;k,θ(ks))) ∂ks ´ =∂k∂ s ³ ∂(1−F(¯s;k,θ(ks))) ∂θ(ks) ∂θ(ks) ∂ks ´ =∂2θ(ks) ∂k2 s ∂(1−F(¯s;k,θ(ks))) ∂θ(ks) + ∂θ(ks) ∂ks ∂ ∂ks ³ ∂(1−F(¯s;k,θ(ks))) ∂θ(ks) ´ =∂2θ(ks) ∂k2 s ∂(1−F(¯s;k,θ(ks))) ∂θ(ks) + ∂θ(ks) ∂ks ³ ∂ ∂θ(ks) ³ ∂(1−F(¯s;k,θ(ks))) ∂θ(ks) ´´ ∂θ(ks) ∂ks =∂2θ(ks) ∂k2 s ∂(1−F(¯s;k,θ(ks))) ∂θ(ks) + ³∂θ(k s) ∂ks ´2³ ∂2(1 −F(¯s;k,θ(ks))) ∂(θ(ks))2 ´ We know, ∂θ(ks) ∂ks = −θ0 (1+ks)2 <0 ∂2θ(ks) ∂k2 s = θ0 (1+ks)3 >0
Also, using results from Appendix A, we have: ∂(1−F(¯s;k,θ)) ∂θ = 1 Γ(k)( ¯ s θ) ke−s¯ θ >0
Differentiating the above equation with respect to the scale parameterθ(ks) : ∂2(1 −F(¯s;k,θ)) ∂θ2 = ∂θ∂ ³ 1 Γ(k)( ¯ s θ) ke−¯s θ ´ = Γ(k)1 ¯sk³ −k θk+1e− ¯ s θ + s¯ θk+2e− ¯ s θ ´ = s¯ke− ¯ s θ θk+1Γ(k) ¡ −k+sθ¯¢ = −¯ske− ¯ s θ θk+1Γ(k) ¡ k−¯sθ¢ Thus, ∂2(1 −F(¯s;k,θ(ks))) ∂ks2 = µ θ0 (1+ks)3 1 Γ(k)( ¯ s θ) ke−s¯ θ + ³ −θ0 (1+ks)2 ´2 −s¯ke−sθ¯ θk+1Γ(k) ¡ k−s¯ θ ¢
Thefirst term in this expression on LHS is clearly positive. The second term³ −θ0
(1+ks)2 ´2 −s¯ke−sθ¯ θk+1Γ(k) ¡ k−sθ¯¢> 0whenkθ <s.¯ Thus, ∂2(1−F(¯s;k,θ(ks))) ∂ks2 >0
More rigorously, for ∂2(1−F(¯s;k,θ(ks)))
θ0 (1+ks)3 1 Γ(k)( ¯ s θ)ke− ¯ s θ > ³ −θ0 (1+ks)2 ´2 ¯ ske−sθ¯ θk+1Γ(k) ¡ k−¯sθ¢ ⇒1> k−sθ¯ ⇒kθ <s¯
Now consider the second second order condition:
f11f22−f12f21>0
The first term of the Hessian matrix is given by f11 =−∂
2
λ(kf)
∂k2
f
(1−F(X = ¯s|ks))L which is less than or equal to zero. The condition f22 = ∂
2
(1−F(¯s;k,θ(ks)))
∂ks2 < 0. Also, the cross derivatives
(f12, f21)are symmetric and such that,
f12=f21= (1+k−λf0)2Γ(k)1 (¯sθ)ke− ¯
s θ θ0
(1+ks)2L
To ensure that the Hessian will be negative definite and hence the solution to the first order conditions are indeed maximizing the objective function we must have,
f11f22−f12f21>0 ⇒ − λ0 (1+kf)3(1−F(X = ¯s|ks))L −λ0 (1+kf)L µ θ0 (1+ks)3 1 Γ(k)( ¯ s θ)ke− ¯ s θ − ³ −θ0 (1+ks)2 ´2 ¯ ske−sθ¯ θk+1Γ(k) ¡ k−sθ¯¢ ¶ > ³ −λ0 (1+kf)2 1 Γ(k)( ¯ s θ) ke−¯s θ θ0 (1+ks)2L ´2 ⇒ λ20 (1+kf)4L 2(1−F(X = ¯s|k s)) ³ θ0 (1+ks)3 1 Γ(k)( ¯ s θ) ke−s¯ θ ¡1−¡k−¯s θ ¢¢´ > λ20 (1+kf)4L 2³ 1 Γ(k)( ¯ s θ) ke−¯s θ θ0 (1+ks)2 ´2 ⇒(1−F(X= ¯s|ks)) ³ θ0 (1+ks)3 1 Γ(k)( ¯ s θ) ke−s¯ θ¡1−¡k−s¯ θ ¢¢´ >³ 1 Γ(k)( ¯ s θ) ke−s¯ θ θ0 (1+ks)2 ´2 ⇒(1−F(X= ¯s|ks)) ¡ 1−¡k−sθ¯¢¢>Γ(k)1 (sθ¯)ke−s¯ θ θ0 (1+ks) ⇒(1−F(X= ¯s|ks))¡1−¡k−sθ¯¢¢>Γ(k)1 (sθ¯)ke− ¯ s θ θ0 (1+ks) ⇒(1−F(X= ¯s|ks))¡1−¡k−sθ¯¢¢>(1+kθ0¯ss)¯s k−1 Γ(k)( 1 θ)ke− ¯ s θ
Figure 1 Effect of acceptance standards on optimum firm-centric investments -50 0 50 100 150 200 0 50 100 150 acceptance standard s O p ti m u m valu es o f kf kf for loss=500000usd kf for loss=1million usd
Figure 1:
Figure 2 Effect of acceptance standards on optimum supply chain collaboration investments
0 0.2 0.4 0.6 0.8 1 1.2 1.4 1.6 0 50 100 150 acceptance standard s O p ti mum l e v e l of k s ks for Loss=500000usd ks value for loss=1 million usd