Deposited in DRO:
31 May 2019Version of attached le:
Accepted VersionPeer-review status of attached le:
Peer-reviewedCitation for published item:
Li, Y. and Coolen, F.P.A. (2019) 'Time-dependent reliability analysis of wind turbines considering load-sharing using fault tree analysis and Markov chains.', Journal of risk and reliability. .
Further information on publisher's website:
https://uk.sagepub.com/en-gb/eur/proceedings-of-the-institution-of-mechanical-engineers-part-o-journal-of-risk-and-reliability
Publisher's copyright statement: Additional information:
Use policy
The full-text may be used and/or reproduced, and given to third parties in any format or medium, without prior permission or charge, for personal research or study, educational, or not-for-prot purposes provided that:
• a full bibliographic reference is made to the original source • alinkis made to the metadata record in DRO
• the full-text is not changed in any way
The full-text must not be sold in any format or medium without the formal permission of the copyright holders. Please consult thefull DRO policyfor further details.
Durham University Library, Stockton Road, Durham DH1 3LY, United Kingdom Tel : +44 (0)191 334 3042 | Fax : +44 (0)191 334 2971
Time-dependent reliability analysis of wind
turbines considering load-sharing using fault
tree analysis and Markov chains
XX(X):1–11
©IMechE 2019
Reprints and permission:
sagepub.co.uk/journalsPermissions.nav DOI: 10.1177/ToBeAssigned
www.sagepub.com/
Yao Li
1and Frank P.A. Coolen
2Abstract
Due to the high failure rates and the high cost of operation and maintenance of wind turbines, not only manufacturers but also service providers try many ways to improve the reliability of some critical components and subsystems. In reality, redundancy design is commonly used to improve the reliability of critical components and subsystems. The load dependencies and failure dependencies among redundancy components and subsystems are crucial to the reliability assessment of wind turbines. However, the redundancy components are treated as a parallel system, and the load correlations among them are ignored in much literature, which may lead to the wrong system’s reliability and much higher costs. For this reason, this article explores the influences of load-sharing on system reliability. The whole system’s reliability is quantitatively evaluated using fault tree analysis and the Markov chain method. Following this, the optimisation of the redundancy allocation problem considering the load-sharing is conducted to maximise the system reliability and reduce the total cost of the system subjecting to the available system cost and space. The results produced by this methodology can show a realistic reliability assessment of the whole wind turbine from a quantitative point of view. The realistic reliability assessment can help to design a cost-effective and more reliable system and significantly reduce the cost of wind turbines.
Keywords
wind turbines, reliability assessment, load-sharing, fault tree analysis, Markov chains
Introduction
Fossil fuels are non-renewable energy sources and have a severe impact on the environment. Developing renewable energy sources is a crucial measure to help achieve energy security and sustainable development. The increasing environmental and climatic concerns of current times have moved the research focus from conventional electricity sources to renewable energy. Currently, wind energy is one of the most promising source of energy across the world.
The wind turbine is a typical example of mechatronics systems equipped with high technologies, which can capture the kinetic energy of wind and transform it into electric energy. The operating condition of wind turbines (WTs) is variable. The reliability and safety of WTs are influenced by many factors, such as random wind speed, high temperature and sand. With an increasing number of wind turbines being installed, lots of potential problems still need to be solved, such as structural fatigue, high failures and low reliability. This is especially true in the current circumstances where tower height, rotor diameter, and overall turbine weights have almost quadrupled in size and capacity.1,2 The above reasons have led to
more accidents. According to accident statistics from Caithness Windfarm Information Forum, more and more accidents are occurring with an average of 33 accidents per year from 1998-2002; 81 accidents per year from 2003-2007 inclusive; 144 accidents per year from 2008-2012 inclusive, and 167 accidents per year from
2013-2017 inclusive.3,4 High failure rates will lead to
the high cost of operation and maintenance (O&M), which may reduce wind farm profits. The O&M costs of onshore wind turbines account for about 10%-15% of wind farm income in a 20-year design life. For an offshore wind turbine, O&M costs are as high as 20%-25% of wind farm income.5Because the warranty period
for most older wind turbines has expired, a large amount of WTs suffer high failure rates that causes high O&M costs. Therefore, alike investors, operators and service providers, all want to improve wind turbine reliability and minimise wind turbine O&M costs.
It has been argued that larger wind turbines tend to fail more frequently than smaller ones.1 Because of
this challenge in reality, improving WT reliability is becoming increasingly necessary. The fault tree method is one of the essential tools for reliability analysis of complex and large scaled systems and is used in many kinds of literature.6 Duan et al.7 used fuzzy fault tree
to analyze the reliability of flue gas turbine. Marquez et al.8conducted a qualitative analysis using the proposed
1State Key Laboratory of Mechanical Transmissions, Chongqing University, Chongqing, P.R. China
2Department of Mathematical Sciences, Durham University, Durham, United Kingdom
Corresponding author:
Yao Li, State Key Laboratory of Mechanical Transmissions, Chongqing University, Chongqing 400044, P.R. China.
method based on fault tree analysis (FTA) and Binary Decision Diagrams. Zhang et al.9 proposed the use of
system grading and FTA to analyse the reliability of floating offshore wind turbines and discuss sequentially dependent failures and redundancy failures.
The redundancy design is quite common in WTs aim-ing at improvaim-ing reliability, which is treated as the par-allel system in much research.10 In some studies,11,12
the objective function of the optimization model is considered to be maximizing the system reliability. Li et al.13 proposed a two-stage approach for solving
multi-objective system reliability optimisation model that can obtain the best solution from the overall problem. Mahapatra and Roy14 conducted the redundancy
allo-cation for optimum reliability of series-parallel system, the aim of which is to maximise the system reliabil-ity. Ashraf et al.15 established a fuzzy multi-objective
optimization model for reliability-redundancy alloca-tion problem (RRAP) using the multi-objective evolu-tionary algorithm and non-dominated sorting genetic algorithm with consideration of uncertainties in the parameters. Ardakan and Hamadani16 studied
relia-bility optimisations considering redundancy allocation problem and standby strategies. But redundancy com-ponents are treated as parallel system and indepen-dent of each other. Jahromi and Feizabadi17 proposed
a multi-objective evolutionary algorithm to solve the reliability model with the non-homogenous subsystem components, which takes the reliability and cost of the system as the objective function. Muhuri et al.18
proposed a novel formulation of RRAP with fuzzy uncertainty. Huang et al.19,20 developed a
heuris-tic survival signature-based approach for reliability-redundancy allocation that reduces the dimension of the optimization problem and provides insight into system reliability-redundancy allocation.
In previous literature, all redundancy components are taken as parallel systems. This issue reduces the system reliability and leads to excessive system’s reliability and much higher costs. Therefore, this article aims to study the influences of load-sharing of redundancy design on wind turbine reliability and reduce the whole system’s cost. This remainder of this paper is organised as follows. The “Wind turbines” section introduces the development of wind power and the structure of wind turbines. The “Methodology” section proposes the load-sharing formulation with consideration of the correlation among components. FTA, RRAP and Markov chains are also presented in this section. The “Fault tree analysis of wind turbines” section shows the fault tree of the wind turbine and the procedures of using the fault tree to perform reliability assessment. Following this, this section also explores the method of obtaining the failure rates of load-sharing components. The “Reliability based redundancy allocation of the wind turbine” section gives MORRAP model and performs some runs at different time using GA. The “Reliability model and assessment of the wind turbine” section presents the results of three time-dependent reliability models to illustrate the performance of the load-sharing based reliability model compared with that
of Markov-chains and parallel based reliability models. The “Conclusion” section summarizes some conclusions of this article.
Wind turbines
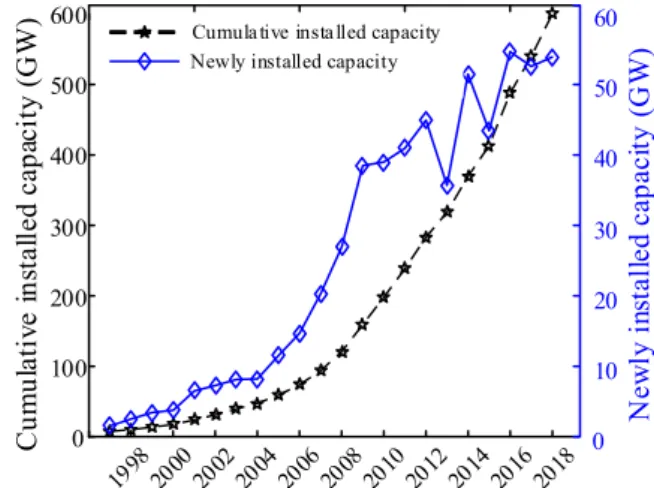
On the level of the global market, the size of the annual market has grown sharply year-on-year. By the end of 2018, the cumulative installed capacity climbed to 600 gigawatts (GW),21which is shown in Figure1. However,
with the growing number of wind turbines, the wind industry faces a lot of challenges. A number of WT components and assemblies are prone to failure, and it is difficult and expensive to repair and replace them.
0 100 200 300 400 500 600 C um ul at iv e in st al le d ca pa ci ty ( GW ) N ew ly in st al le d ca pa ci ty ( GW ) 0 10 20 30 40 50 60
Cumulative installed capacity Newly installed capacity
Figure 1. The global development of the wind power The wind turbine structure is complex, and its operating condition is variable. A WT system consists of a software and communication unit, an electrical unit, a mechanical unit, a control unit and an auxiliary unit, which work together to guarantee the normal operation of the whole system. Any unit’s fault may lead to the entire system’s shutdown. Figure 2 shows the wind turbine system schematic. As can be seen from Figure2, the entire wind turbine is a closed loop control system, and every subsystem has a close relationship with the others. Due to its complex structure and harsh operating environment, wind turbines are likely to suffer high failure rates. Therefore, high reliability is crucial to WTs. In reality, WT designers tend to use redundancy design to improve WT reliability. However, designers do not explore the effect of load-sharing and dependent failure in the reliability model of wind turbines.
Methodology
Notations
Load-sharing
In previous research, most redundancy components are treated as parallel units, which is not true in reality. For this reason, the quantification of the system’s reliability of redundancy components is determined based on the assumption that when one redundancy component fails, the failure rates of other components does not change during the mission. However, this assumption is not
Nacelle control cabinet
Crowbar
Main controller cabinet (foundation)
Chopper
Frequency
converter converterCurrent
Slipping ring
690VAC 35kV
Low-voltage
side High-voltage side
(690V WT auxiliary power) Temperature switch Transformer Stand-by Current test Circuit breaker Contactor Blades Pitch system Brake Gearbox Generator filter Cable Box-type transformer Mid-voltage switch cabinet Network Framework Current
converter Sy nchronization cabi net filter
Figure 2. Wind turbine system schematic
f1(T) pdf of Weibull distribution of component 1 with parametersλ1andγ1, when component 1 carries the loadk1L
f2(T) pdf of Weibull distribution of component 2 with parametersλ2andγ2, when component 2 carries the loadk2L
f1′(T) pdf of component 1 with parametersλ
′
1 and γ1′, when component 1 carries loadL f2′(T) pdf of component 2 with parametersλ
′
2 and γ2′, when component 2 carries loadL f1′′(T−t2) conditional pdf of component 1 after
component 2 fails at timet2 witht2< T f2′′(T−t1) conditional pdf of component 2 after
component 1 fails at timet1 witht1< T R′′1(t−t2) conditional reliability function of component
1 after component 2 fails at timet2
R′′2(t−t1) conditional reliability function of component 2 after component 1 fails at timet1
Q1(t1) probability of component 1 fails at timet1 Q2(t2) probability of component 2 fails at timet2 xi,j number ofjth components used in subsystem
i
ci,j, si,j cost and space for the jth components in
subsystemi
˜
Pi(t) individual state probabilities
˜
λi,γ˜i scale and shape parameters of components
taking sharing loads
λi, γi shape and shape parameters of components
taking total loads.
S system-level constraint limit for space, set of si
N set of subsystems without redundancy design L set of subsystems with redundancy design
using load-sharing
M set of subsystems’ number of different components
correct in engineering. The remaining components will suffer higher failure rates due to the increased share of the load during the mission, which may reduce the system’s reliability. For this reason, it is essential to take load-sharing into consideration in WT reliability analysis.
The two-unit load-sharing system with two-parameter Weibull distribution is used in this paper. The basic definitions are given here, and more detailed information is available in references by Liu22 and Mattas23.
The system’s reliability function is given by:
R(t) =R1(t)R2(t) +Q1(t1)R2(t1)R ′′ 2(t−t1) +Q2(t2)R1(t2)R ′′ 1(t−t2) (1)
The first term of equation (1) is the probability that component 1 and 2 complete their mission from 0 to t successfully with pdf’s f1(t) and f2(t) respectively. It can be written as:
R1(t)·R2(t) =e−(λ1·t) γ1
·e−(λ2·t)γ2 (2)
The second term of equation (1) is the probability that component 1 fails at t1< t with pdf f1(T), and component 2 functions untilt1with pdff2(T)and then functions for the rest of the mission with pdf f2′′(T− t1). It needs to use the equivalent-time technique to determine the f2′′(T−t1) pdf or the conditional reliability function R′′2(T−t1). The probability of the failure of component 2 when it carries the full loadLis the same as the probability of the failure of component 2 when it carries the loadk2L. So
∫ t1 0 f2(T)dT = ∫ t1 t1−t1e f2′(T −t1)dT (3)
Then through equation (3), the equivalent time t1e
can be obtained as follows:
t1e= 1 λ′2·e (λ2·t1)γ2/γ ′ 2 (4)
The equivalent timet2e can be obtained as well.
t2e= 1 λ′1·e (λ1·t2)γ1/γ ′ 1 (5)
The second term of equation (1) can be written as follows: Q1(t1)R2(t1)R ′′ 2(t−t1) = ∫ t 0 γ1·λ γ1 1 ·t γ1−1 1 ·e−{(λ1·t1) γ1+[λ′ 2(t−t1+1 λ′2·e (λ2·t1 )γ2/γ ′ 2 )]γ ′ 2} dt1 (6)
The third term of equation (1) can also be obtained in the same way, as follows:
Q2(t2)R1(t2)R ′′ 1(t−t2) = ∫ t 0 γ2·λγ22·t γ2−1 2 ·e−{ (λ2·t2)γ2+[λ ′ 1(t−t2+1 λ′1· e(λ1·t2 )γ1/γ ′ 1)]γ′1} dt2 (7)
By substituting the pdf’s involved into equations (2), (6) and (7) and considering that t1, t2∈[0, t], the system’s reliability for a mission of duration t can be obtained.
Fault tree analysis
FTA is a reliability analysis technique which starts from considering the system’s failure modes and effects and is generally applicable to complex dynamic systems. There are two kinds of graphical symbols in the fault tree: gate symbols and event symbols. The gate symbols are used to represent and interconnect the various combinations of events. The most frequently used FT gate symbols are AND gate, OR gate, m-out-of-n voting gate and Priority AND gate. The event symbols are used to simplify the representation of a fault tree. Each symbol has its specific meaning. The basic symbolic descriptions are shown in Table 1. More details can be found in Marquez.8
Table 1. The symbolic descriptions
Symbol Meaning Sign Meaning
. . . OR Basic event
. . . AND Resultant event
Multi-objective reliability-redundancy
allocation
In most studies related to the reliability-redundancy allocation problem (RRAP), authors only focused on maximising the system reliability. Moreover, the redundancy components are treated as parallel systems, which leads to lower system reliability than normal. For this reason, the reliability of WTs in reality is too high, which brings a higher cost to WT manufactures and reduces their interest. Therefore, it is necessary to optimise the system reliability and the cost simultaneously, with consideration of the load-sharing. The proposed model for load-sharing based multi-objective reliability-redundancy allocation
problem (MORRAP) is given as follows:
M aximise: R(t;x) = ∏ i∈N Risp(t)·∏ j∈L Rlsj(t) M inimise: C(t;x) = N ∑ i=1 xij·cij (8) Rlsj(t) =e−(λ1j·t) γj1 ·e−(λ2j·t) γj2 + ∫ t 0 γ1j ·(λ1j)γ 1 j ·t1(γ 1 j−1)·e−{ (λ1 j·t1) γj1 +[˜λ2 j(t−t1+˜λ12j·e (λ2j·t1 )γ 2 j/˜λ2j )]˜γj2} dt1 + ∫ t 0 γj2·(λ2j)γ 2 j ·t 2(γ 2 j−1) ·e−{ (λ2 j·t2) γj2 +[˜λ1 j(t−t2+˜λ11j·e (λ1j·t2 )γ1j/˜γj1 )]γ˜j1} dt2 (9) Subject to: N ∑ i=1 M ∑ j=1 xij·sij ≤S (10) 1≤ N ∑ i=1 xij ≤nmax,j, xij∈ {1,2,· · · , nmax,i}
where Risp(t) represents the reliability of series-parallel subsystems at time t, Rls
i (t) means reliability of
load-sharing subsystems at timet.
Reliability based Markov-chain model
The Markov-chain model has been used to deal with systems with multiple states and the interdependent components. In this article, it is used to obtain the dependent reliability in the series-parallel system. A parallel system with two components is taken as an example. There are three states for this system: both good, one good and one bad, or both bad. Figure 3 shows the state transition diagram of a two-component dependent failure reliability model. Every component has two models: normal and failed, so the number of the total models are 4 (C1
2·C21) for the two-component parallel system.
S0
S1,1
S1,2
S2
Figure 3. Reliability state transition diagram of dependent parallel system
Assumptions:
1. Both components are the same and have failure ratesλ˜1(t)when both are working well.
2. Each component has failure rate λ˜2(t)if the other
The state transition-rate matrix is:24 TR(t) = −2˜λ1(t) 0 0 0 ˜ λ1(t) −λ˜2(t) 0 0 ˜ λ1(t) 0 −λ˜2(t) 0 0 λ˜2(t) λ˜2(t) 0 (11) The state probability ofS0 is solved directly by:
˜
P1(t) = ˜P1(t0)·e−
2∫tt
0λ1(τ)dτ (12)
The state probabilities of S1,1 and S1,2 are obtained by solving the homogeneous equation, the results are as follows: ˜ Pj(t) = ˜P1(t0)·[ ∫ t t0 λ1(u)·e− 2∫tu 0λ1(τ)dτ+ ∫u t0λ2(τ)dτdu] ·e− ∫t t0λ2(τ)dτ+ ˜Pj(t0)·e− ∫t t0λ2(τ)dτ (13) where,j= 2,3. ˜ P4(t) = 1−P˜1(t)−P˜2(t)−P˜3(t) (14) Then, the system reliability is obtained by:
R(t, t0) = ˜P1(t) + ˜P2(t) + ˜P3(t) (15)
Fault tree analysis of wind turbines
Fault tree of the WT
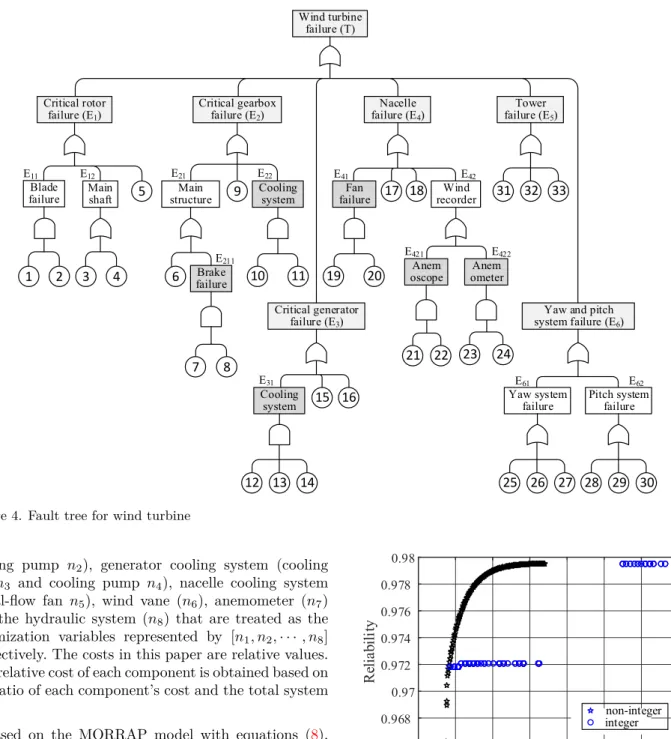
The research object in this paper is a doubly fed induction generator with four-point suspension produced by CSIC (Chongqing) Haizhuang Windpower Equipment Co., Ltd. The rotor diameter, the tower height and the rated power are 111m, 100m and 2.0 megawatt (MW), respectively. Some WT components are depicted in Figure 2. The WT is divided into six subsystems for a better FTA: critical rotor failure, critical gearbox failure, critical generator failure, nacelle failure, tower failure and yaw & pitch system failure, which are transformed into the FT of the entire WT shown in Figure 4. Each subsystem consists of hundreds of components. Without consideration of the redundancy design, the fault of any critical components will lead to the shutdown of the entire WT. The failure of some mechanical parts and auxiliary components does not cause shutdown of WTs. Therefore, all critical components that can lead to the shutdown are treated as series systems, and the redundancy designs are taken as parallel systems in the FT.
From the Figure4, the minimal cut sets of subsystems are obtained as follows:
T: {E1, E2, E3, E4, E5, E6} E1: {1,2,3,4}, {2,3,4,5} E2: {6,7,9,10}, {6,7,9,11}, {6,8,9,10}, {6,8,9,11} E3: {12,15,16}, {13,15,16}, {14,15,16} E4: {17,18,19,21,23},{17,18,19,21,24},{17,18,19,22,23}, {17,18,19,22,24},{17,18,20,21,23},{17,18,20,21,24}, {17,18,20,22,23},{17,18,20,22,24} E5: {31,32,33} E6: {25,26,27,28,29,30}
where T and Ei (i= 1,2,· · ·,6)are depicted in Figure
4.
The FT based system reliability can be obtained by:
Rsys(t) =RE1(t)·RE2(t)·RE3(t)·RE4(t)
·RE5(t)·RE6(t) (16)
Failures rates of load-sharing
Most failure data monitored in reality is the mean time between failure that can not be used directly. Therefore, mean time between failure (MTBF) should be transformed into the parameters of Weibull distribution. A Weibull distribution w(λ, γ) has two parameters: scale parameter λand shape parameter γ. Hence, we can get the survivor function as follows:
S(t) =e−(λ·t)γ, t >0 (17)
Therth momentE(Tr)of the distribution is:
E(Tr) =Γ(1 +
r γ)
λr (18)
where, Γ(k) =∫0∞uk−1e−udu (k >0) is the gamma
function.
In this article, the r and γ are fixed at 1 and 2 respectively, andλs.t.E(Tr) =M T BF. Then the scale
parameterλcan be obtained by:
lnλ= ln ( ∫∞ 0 u k−1e−udu)−ln(M T BF) r (19) where, k= 1 + r γ.
The failure rates for load-sharing is very different from that of parallel subsystems. For a load-sharing system withncomponents, the failure rate ofith component at timet is given by:
λi(t) =
λs
nt
+λi (20)
Where, nt is the number of functioning components in
load-sharing at timet,λsis the total failure rate related
to the load that can be shared, λi is the further failure
rate applying to component i.
According to equation (19) and equation (20), all related parameters of Weibull distribution can be obtained. The input parameters of the Weibull distribution of WT subsystems are shown in Table 2. The data of MTBF in this table is real maintenance records provided by CSIC (Chongqing) Haizhuang Windpower Equipment Co., Ltd.
Reliability based redundancy allocation of the
wind turbine
Redundancy allocation is quite important for improving WT reliability and safety. In this section, the series-parallel system is composed of six subsystems and eight parallel systems, and a multi-objective optimisation using the genetic algorithm (GA) is explored. Component space and cost are constraints. The objective is to maximise the system reliability and minimise the system cost. The eight parallel subsystems are the gearbox cooling system (cooling fan n1 and
Wind turbine failure (T) Critical generator failure (E3) Cooling system 12 13 14 15 16 Nacelle failure (E4) Fan
failure 17 18 recorderWind
Anem
oscope ometerAnem
19 20
23 24
21 22
25 26 27
Yaw and pitch
system failure (E6)
Yaw system
failure Pitch system failure
28 29 30 31 32 33 Tower failure (E5) Critical rotor failure (E1) 1 2 Blade
failure Main shaft
3 4 5 Critical gearbox failure (E2) Main structure 7 8 9 Cooling system 10 11 6 failureBrake E11 E12 E21 E22 E211 E421 E31 E41 E42 E62 E422 E61
Figure 4. Fault tree for wind turbine
cooling pump n2), generator cooling system (cooling fan n3 and cooling pump n4), nacelle cooling system (axial-flow fan n5), wind vane (n6), anemometer (n7) and the hydraulic system (n8) that are treated as the optimization variables represented by [n1, n2,· · ·, n8] respectively. The costs in this paper are relative values. The relative cost of each component is obtained based on the ratio of each component’s cost and the total system cost.
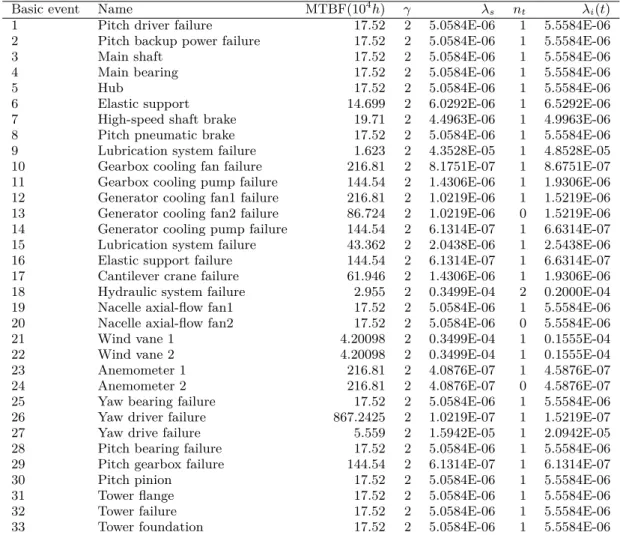
Based on the MORRAP model with equations (8), (9) and (10), we performed some runs at different time t. One of the runs at time t= 1 year is shown in Figure 5. The results that consider integer constraints and non-integer constraints are shown in this figure. In engineering practice, the number of components or subsystems must be integer. As can be seen, the system reliability does not change when the total cost is between 240 and 360. However, if we want to improve the system reliability to 0.98, we have to spend much more on the system, which will increase the cost of WTs. The results of reliability based redundancy-allocation optimization in the first year and second year are shown in Table 3 and Table 4. The ”Cost Const.” in the table means the cost constraints of redundancy design for the entire system. In Table 3, the best solution is selected as problem 22 ([1,1,1,1,1,2,1,2]) with the highest reliability (0.9792) and the acceptable cost (342.6). In addition, some other solutions can be obtained in different years: solution ([1,1,1,1,2,4,2,2]) in the second year with reliability (0.9199) and cost
200 250 300 350 400 450 500 550 Cost 0.966 0.968 0.97 0.972 0.974 0.976 0.978 0.98 Re lia bi li ty non-integer integer
Figure 5. Runs of MORRAP
(374.2); solution ([1,1,1,1,1,3,2,2]) in the third year with reliability (0.8247) and cost (353.9); solution ([1,1,1,1,2,3,2,2]) in the fourth year with reliability (0.7090) and cost (368.9); solution ([1,1,1,1,2,2,1,2]) in the fifth year with reliability (0.5770) and cost (357.6). It is easy to find out that the redundancy design of the hydraulic system can greatly improve the WT reliability. To select the best solution, we propose to compare the system reliability and price-performance ratio (PPR) of different solutions. The results are shown in Table5and Figure 6. The PPR is calculated by equation (21). The results show that the first solution ([1,1,1,1,1,2,1,2]) is the best choice with the highest PPR and reliability at different time t. It means that the wind vane and the hydraulic system should be allocated more reliability to
Table 2. Parameters of fault tree of wind turbines
Basic event Name MTBF(104h) γ λ
s nt λi(t)
1 Pitch driver failure 17.52 2 5.0584E-06 1 5.5584E-06
2 Pitch backup power failure 17.52 2 5.0584E-06 1 5.5584E-06
3 Main shaft 17.52 2 5.0584E-06 1 5.5584E-06
4 Main bearing 17.52 2 5.0584E-06 1 5.5584E-06
5 Hub 17.52 2 5.0584E-06 1 5.5584E-06
6 Elastic support 14.699 2 6.0292E-06 1 6.5292E-06
7 High-speed shaft brake 19.71 2 4.4963E-06 1 4.9963E-06
8 Pitch pneumatic brake 17.52 2 5.0584E-06 1 5.5584E-06
9 Lubrication system failure 1.623 2 4.3528E-05 1 4.8528E-05
10 Gearbox cooling fan failure 216.81 2 8.1751E-07 1 8.6751E-07
11 Gearbox cooling pump failure 144.54 2 1.4306E-06 1 1.9306E-06 12 Generator cooling fan1 failure 216.81 2 1.0219E-06 1 1.5219E-06 13 Generator cooling fan2 failure 86.724 2 1.0219E-06 0 1.5219E-06 14 Generator cooling pump failure 144.54 2 6.1314E-07 1 6.6314E-07
15 Lubrication system failure 43.362 2 2.0438E-06 1 2.5438E-06
16 Elastic support failure 144.54 2 6.1314E-07 1 6.6314E-07
17 Cantilever crane failure 61.946 2 1.4306E-06 1 1.9306E-06
18 Hydraulic system failure 2.955 2 0.3499E-04 2 0.2000E-04
19 Nacelle axial-flow fan1 17.52 2 5.0584E-06 1 5.5584E-06
20 Nacelle axial-flow fan2 17.52 2 5.0584E-06 0 5.5584E-06
21 Wind vane 1 4.20098 2 0.3499E-04 1 0.1555E-04
22 Wind vane 2 4.20098 2 0.3499E-04 1 0.1555E-04
23 Anemometer 1 216.81 2 4.0876E-07 1 4.5876E-07
24 Anemometer 2 216.81 2 4.0876E-07 0 4.5876E-07
25 Yaw bearing failure 17.52 2 5.0584E-06 1 5.5584E-06
26 Yaw driver failure 867.2425 2 1.0219E-07 1 1.5219E-07
27 Yaw drive failure 5.559 2 1.5942E-05 1 2.0942E-05
28 Pitch bearing failure 17.52 2 5.0584E-06 1 5.5584E-06
29 Pitch gearbox failure 144.54 2 6.1314E-07 1 6.1314E-07
30 Pitch pinion 17.52 2 5.0584E-06 1 5.5584E-06
31 Tower flange 17.52 2 5.0584E-06 1 5.5584E-06
32 Tower failure 17.52 2 5.0584E-06 1 5.5584E-06
33 Tower foundation 17.52 2 5.0584E-06 1 5.5584E-06
keep them working smoothly. Wind turbine designers need to pay more attention to the wind vane and the hydraulic system that are critical component and subsystem for WTs.
The price-performance ratio of solutions is obtained as follows:
P P Ri(t) =
Risys(t)
Cisys(t)×Cs (21)
whereRsysi (t)andCisys(t)are the system reliability and system cost ofith solution at timetrespectively;Csis
the basic cost of the entire system that is equal to 350 in this article.
Reliability model and assessment of the wind
turbine
The best solution [1,1,1,1,1,2,1,2] is obtained from the previous section using reliability-based redundancy allocation. From this solution, we know that the wind vane and the hydraulic system need a redundancy design which adds one more component to the corresponding subsystem. The system’s minimal cut set of the best solution of the WT is given below:
E1: {1,2,3,4}, {2,3,4,5} E2: {6,7,9,10}, {6,7,9,11}, {6,8,9,10}, {6,8,9,11} E3: {13,15,16}, {14,15,16} E4: 2{17,18,20,21,24}, 2{17,18,20,22,24} 0 1 2 3 4 5 6 Time (year) 0.4 0.5 0.6 0.7 0.8 0.9 1 1.1 Price-performance ratio S1 [1,1,1,1,1,2,1,2] S2 [1,1,1,1,2,4,2,2] S3 [1,1,1,1,1,3,2,2] S4 [1,1,1,1,2,3,2,2] S5 [1,1,1,1,2,2,1,2]
Figure 6. Performance analysis of redundancy-allocation solutions
E5: {31,32,33}
E6: {25,26,27,28,29,30}
The system reliability of WT considering the factori at time tcan be obtained as follows:
Risys(t) =RE1(t)·RE2(t)·RE3(t)·R
i E4(t)
Table 3. Redundancy-allocation based reliability optimization results (T=1 year)
Problem Cost const. Solutions Reliability Cost 1 240 [1, 1, 1, 1, 1, 1, 1, 1] 0.9662 237.3 2 245 [1, 1, 1, 1, 1, 2, 1, 1] 0.9718 242.6 3 250 [1, 1, 1, 1, 1, 3, 1, 1] 0.9718 247.9 4 255 [1, 1, 1, 1, 1, 3, 2, 1] 0.9718 253.9 5 260 [1, 1, 1, 1, 2, 2, 1, 1] 0.9721 257.6 6 265 [1, 1, 1, 1, 2, 3, 1, 1] 0.9721 262.9 7 270 [1, 1, 1, 1, 2, 3, 2, 1] 0.9721 268.9 8 275 [1, 1, 1, 1, 2, 4, 2, 1] 0.9721 274.2 9 280 [1, 1, 1, 1, 2, 5, 2, 1] 0.9721 279.5 10 285 [1, 1, 1, 1, 3, 3, 2, 1] 0.9721 283.9 11 290 [1, 1, 1, 1, 3, 4, 2, 1] 0.9721 289.2 12 295 [1, 1, 1, 1, 3, 5, 2, 1] 0.9721 294.5 13 300 [1, 1, 1, 1, 3, 6, 2, 1] 0.9721 299.8 14 305 [1, 1, 1, 1, 3, 5, 3, 1] 0.9721 300.5 15 310 [2, 1, 1, 1, 3, 4, 2, 1] 0.9721 309.2 16 315 [2, 1, 1, 1, 3, 5, 2, 1] 0.9721 314.5 17 320 [2, 1, 1, 1, 3, 6, 2, 1] 0.9721 319.8 18 325 [2, 1, 1, 1, 3, 5, 3, 1] 0.9721 320.5 19 330 [2, 1, 1, 1, 3, 6, 3, 1] 0.9721 325.8 20 335 [2, 1, 2, 1, 3, 6, 4, 1] 0.9721 331.8 21 340 [2, 1, 2, 1, 3, 6, 4, 1] 0.9721 331.8 22 345 [1, 1, 1, 1, 1, 2, 1, 2] 0.9792 342.6 23 350 [2, 1, 2, 1, 3, 6, 3, 1] 0.9721 346.8 24 355 [2, 1, 2, 1, 3, 6, 3, 1] 0.9721 346.8 25 360 [2, 1, 2, 1, 4, 5, 3, 1] 0.9721 356.5 26 365 [2, 1, 2, 1, 4, 6, 3, 1] 0.9721 361.8 27 370 [1, 1, 1, 1, 2, 3, 2, 2] 0.9795 368.9 28 375 [2, 1, 2, 1, 4, 6, 5, 1] 0.9721 373.8 29 380 [2, 1, 2, 1, 4, 6, 3, 1] 0.9721 361.8 30 385 [1, 1, 1, 1, 3, 3, 2, 2] 0.9795 383.9 31 390 [2, 1, 1, 2, 4, 6, 4, 1] 0.9721 381.8 32 395 [1, 1, 1, 1, 3, 5, 2, 2] 0.9795 394.5
where i∈{Par, LS, MC}, which means parallel, load-sharing or Markov chain is taken into consideration of the reliability model.
According to the minimal cut set of the system and equation (22), the system’s reliability with series-parallel subsystems is obtained shown in equation (23):
RP arsys(t) =RE1(t)·RE2(t)·RE3(t)·R P ar E4 (t) ·RE5(t)·RE6(t) (23) where, RE1(t) =Rx1(t)·Rx2(t)·Rx3(t)·Rx4(t) +Rx2(t)·Rx3(t)·Rx4(t)·Rx5(t) (24) RE2(t) =Rx6(t)·Rx7(t)·Rx9(t)·Rx10(t) +Rx6(t)·Rx7(t)·Rx9(t)·Rx11(t) +Rx6(t)·Rx8(t)·Rx9(t)·Rx10(t) +Rx6(t)·Rx8(t)·Rx9(t)·Rx11(t) (25) RE3(t) =Rx13(t)·Rx15(t)·Rx16(t) +Rx14(t) ·Rx15(t)·Rx16(t) (26) RP arE4 (t) =2Rx17(t)·Rx18(t)·Rx20(t)·Rx24(t) ·(Rx21(t) +Rx22(t)) (27) RE5(t) =Rx31(t)·Rx32(t)·Rx33(t) (28) RE6(t) =Rx25(t)·Rx26(t)·Rx27(t)·Rx28(t) ·Rx29(t)·Rx30(t) (29)
Table 4. Redundancy-allocation based reliability optimization results (T=2 years)
Problem Cost const. Solutions Reliability Cost 1 240 [1, 1, 1, 1, 1, 1, 1 ,1] 0.9662 237.3 2 245 [1, 1 ,1 ,1, 1, 2, 1, 1] 0.9718 242.6 3 250 [1, 1, 1, 1, 1, 3, 1, 1] 0.9718 247.9 4 255 [1, 1, 1, 1, 1, 3, 2, 1] 0.9718 253.9 5 260 [1, 1, 1, 1, 2, 2, 1, 1] 0.9721 257.6 6 265 [1, 1, 1, 1, 2, 3, 1, 1] 0.9721 262.9 7 270 [1, 1, 1, 1, 2, 3, 2, 1] 0.9721 268.9 8 275 [1, 1, 1, 1, 2, 4, 2, 1] 0.9721 274.2 9 280 [1, 1, 1, 1, 2, 5, 2, 1] 0.9721 279.5 10 285 [1, 1, 1, 1, 2, 6, 2 ,1] 0.9721 283.9 11 290 [1, 1, 1, 1, 3, 4, 2, 1] 0.9721 289.2 12 295 [1, 1, 1, 1, 3, 5, 2, 1] 0.9721 294.5 13 300 [1, 1, 1, 1, 3, 6, 2, 1] 0.8929 299.8 14 305 [1, 1, 1, 1, 3, 5, 3, 1] 0.8929 300.5 15 310 [2, 1, 1, 1, 3, 4, 2, 1] 0.8929 309.2 16 315 [2, 1, 1, 1, 3, 5, 2, 1] 0.8929 314.5 17 320 [2, 1, 1, 1, 3, 6, 2, 1] 0.8929 319.8 18 325 [2, 1, 1, 1, 3, 5, 3, 1] 0.8929 320.5 19 330 [2, 1, 1, 1, 3, 6, 3, 1] 0.8929 325.8 20 335 [2, 1, 2, 1, 3, 4, 2, 1] 0.8929 330.2 21 340 [2, 1, 2, 1, 3, 5, 2, 1] 0.8929 335.5 22 345 [2, 1, 2, 1, 3, 5, 3, 1] 0.8929 341.5 23 350 [2, 1, 2, 1, 3, 6, 3, 1] 0.8929 346.8 24 355 [2, 1, 2, 1, 3, 6, 3, 1] 0.8929 346.8 25 360 [2, 1, 2, 1, 4, 5, 3, 1] 0.8929 356.5 26 365 [2, 1, 2, 1, 4, 6, 3, 1] 0.8929 361.8 27 370 [2, 1, 2, 1, 4, 6, 3, 1] 0.8929 361.8 28 375 [1, 1, 1, 1, 2, 4, 2, 2] 0.9199 374.2 29 380 [2, 1, 2, 1, 4, 6, 4, 1] 0.8929 367.8 30 385 [1, 1, 1, 1, 2, 6, 2, 2] 0.9199 384.8 31 390 [2, 1, 3, 1, 4, 6, 3, 1] 0.8929 382.8 32 395 [1, 1, 1, 1, 3, 5, 2, 2] 0.9199 394.5
The reliability of components following Weibull distribution is:
Rxi(t) =e−
(λi·t)γi, t >0 (30)
Two subsystems take the load-sharing into consider-ation, which happens in the nacelle subsystem and the hydraulic subsystem. Therefore, according to equations (1), (6), (7) and (22), the load-sharing based reliability model of the WT is obtained as follows:
RLSsys(t) =RE1(t)·RE2(t)·RE3(t)·R17(t)·R20(t) ·R24(t)·RLS18(t)·R LS E422(t)·RE5(t)·RE6(t) (31) where RLS
18(t) and RLSE422(t) are the reliability of the hydraulic subsystem and the wind vane subsystem considering the load-sharing at timet, which are shown in equation (32) and (33) as follows:
RLS18(t) =e−(˜λ18·t)γ˜18e−(λ18·t)γ18 + ˜γ18λ˜ ˜ γ18 18 ∫ t 0 u˜γ18−1e−{[λ ′ 18(t−u)]γ ′ 18+(˜λ18u)γ˜18}du +γ18λγ1818 ∫ t 0 uγ18−1e−{[˜λ ′ 18(t−u)] ˜ γ18′ +(λ 18u)γ18}du (32)
Table 5. Performance analysis of solutions Time
(year)
Solution 1 Solution 2 Solution 3 Solution 4 Solution 5
Reliability PPR Reliability PPR Reliability PPR Reliability PPR Reliability PPR
1 0.9792 1.0004 0.9795 0.9162 0.9792 0.9685 0.9795 0.9293 0.9795 0.9293 2 0.9188 0.9387 0.9199 0.8604 0.9189 0.9088 0.9199 0.8727 0.9199 0.8727 3 0.8244 0.8422 0.8267 0.7732 0.8247 0.8156 0.8267 0.7843 0.8267 0.7843 4 0.7052 0.7205 0.7090 0.6631 0.7060 0.6982 0.7090 0.6727 0.7090 0.6727 5 0.5732 0.5856 0.5785 0.5411 0.5747 0.5683 0.5785 0.5488 0.5785 0.5488 6 0.4412 0.4507 0.4477 0.4187 0.4434 0.4385 0.4477 0.4247 0.4477 0.4247 RLSE 422(t) =e −(λ21·t)γ21e−(λ22·t)γ22 +γ21λγ2121 ∫ t 0 uγ21−1e−{[λ ′ 22(t−u)] γ′22+(λ 21u)γ21}du +γ22λ γ22 22 ∫ t 0 uγ22−1e−{[λ ′ 21(t−u)]γ ′ 21+(λ22u)γ22}du (33)
Submitting equations (32) and (33) to equation (31), the whole system’s reliability with consideration of the load-sharing is obtained.
To investigate the proposed reliability model, we also study Markov-chain based reliability model in this article. According to equations (15) and (22), the system reliability model using the Markov-chain is obtained shown in equation (34). The reliability of the remaining five subsystems is calculated in the same way mentioned before. The difference focuses on the redundancy design of the hydraulic system and the wind vane system.
RM Csys(t) =RE1(t)·RE2(t)·RE3(t)·R17(t)·R20(t)
·R24(t)·RM C18 (t)·REM C422(t)·RE5(t)·RE6(t)
(34)
where RM C18 (t) and RM CE422(t) are the reliability of the hydraulic subsystem and the wind vane subsystem considering the Markov-chain at timet, which are shown in equations (35) and (36) as follows:
RM C18 (t) = ˜P118(t0)e− 2∫tt 0 ˜ λ18(τ)dτ+ 2 ˜P18 1 (t0) · ∫ t t0 ˜ λ18(u)e− 2∫u t0λ˜18(τ)dτ+ ∫u t0λ18(τ)dτdu ·e− ∫t t0λ18(τ)dτ+ ˜P218(t0)e− ∫t t0λ18(τ)dτ + ˜P318(t0)e− ∫t t0λ18(τ)dτ (35) RM CE 422(t) = ˜P 23 1 (t0)e− 2∫tt 0 ˜ λ23(τ)dτ+ 2 ˜P23 1 (t0) · ∫ t t0 ˜ λ23(u)e− 2∫tu 0 ˜ λ23(τ)dτ+ ∫u t0λ23(τ)dτdu ·e− ∫t t0λ23(τ)dτ+ ˜P23 2 (t0)e− ∫t t0λ23(τ)dτ + ˜P323(t0)e− ∫t t0λ23(τ)dτ (36)
Three kinds of reliability models for the WT are constructed in this article shown in equations (23), (31) and (34). The time-dependent reliability with different models is explored. Figure7shows the system reliability assessment using different reliability models. In this article, we compared the results of the proposed methods with those of the traditional methods. The
results show that the load-sharing based reliability model can get the largest value of the system reliability with the same cost among the three reliability models. However, the reliability values of the Markov-chain and parallel based reliability models are second and third. The results are significantly different from those calculated when treating the redundancy design as parallel and Markov-chains subsystems. In the wind-power equipment industry, the redundant components and subsystems in WTs share the load and are dependent. Therefore, the redundancy design should not be treated as parallel systems, which would bring a significant error to the assessment of the system reliability. It is evident from Figure 7 that the system reliability would have been clearly underestimated if the components are taken as parallel subsystems, which means the components are assumed to be independent of each other. Using the proposed load-sharing based reliability model can contribute to more realistic estimates of the system reliability. The findings are directly in line with the reality that some components or subsystems are designed with much higher reliability than normal, which leads to the prohibitive cost of WTs.
Sy st em r el ia bi lit y 0 0.5 1 1.5 2 2.4 0.2 0.3 0.4 0.5 0.6 0.7 0.8 0.9 1 parallel load-sharing Markov-chain Time ( h)104
Figure 7. Reliability assessment with different reliability models
Conclusions
The wind turbine fault tree is established according to the failure mechanism and failure modes of the wind turbines. The load-sharing and Markov-chain methods are explored in this paper. The reliability and cost-based multi-objective reliability-redundancy allocation problem is proposed to get the optimal redundancy
allocation, which can significantly reduce the system’s cost and keep the system’s reliability at a high level. Following this, the load-sharing based reliability model is proposed to analyse system reliability. To assess the performance of the proposed reliability model, we compare it with the results of the Markov-chain and parallel based reliability model. As we have argued in the reliability assessment section, the traditional methods may underestimate the system’s reliability, which may lead to much waste on materials and the prohibitive cost. The findings show that the proposed reliability model can help obtain a more accurate value of the wind turbine reliability and reduce the system cost of the wind turbine. In summary, the load-sharing based reliability model can represent more realistic system reliability.
In future work, we will focus on the investigation of the effect of different reliability models on the lifetime of wind turbines.
Declaration of conflicting interests
The author(s) declared no potential conflicts of interest with respect to the research, authorship, and/or publication of this article.
Funding
The author(s) disclosed receipt of the following financial support for the research, authorship, and/or publication of this article: This work was supported by the Graduate Scientific Research and Innovation Foundation of Chongqing, China [grant number CYB16024] and the Innovation Project of the City of Chongqing [grant number cstc2015zdcy-ztzx70012].
References
1. Perez JM, Marquez FP, Tobias A, et al. Wind turbine reliability analysis. Renewable and Sustainable Energy Reviews. 2013 Jul 1; 23:463-472.
2. Jiang Z, Hu W, Dong W, et al. Structural relia-bility analysis of wind turbines: a review. Energies. 2017;10(12):2099.
3. Summary of Wind Turbine Accident data to 31 March 2018 [Internet]. CWIF: Caithness Windfarm Information Forum. 2018. Available from:http://www. caithnesswindfarms.co.uk/AccidentStatistics.htm
4. Yao L, Caichao Z, Youchuan T, et al. Research Status and Development Tendency of Wind Turbine Reliability. J. China Mechanical Engineering. 2017;28.
5. Lu B, Li Y, Wu X, et al. A review of recent advances in wind turbine condition monitoring and fault diagnosis. In 2009 IEEE Power Electronics and Machines in Wind Applications 2009 Jun 24 (pp. 1-7). IEEE.
6. Kabir S. An overview of fault tree analysis and its application in model based dependability analysis. Expert Systems with Applications. 2017 Jul 1; 77:114-135.
7. Duan L, Zhang L and Yue J. Reliability assessment of flue gas turbines based on fuzzy fault tree analysis. In 2013 International Conference on Quality, Reliability, Risk, Maintenance, and Safety Engineering (QR2MSE).
8. Marquez FP, Perez JM, Marugan AP, et al. Identifica-tion of critical components of wind turbines using FTA over the time. Renewable Energy. 2016 Mar 1; 87:869-883.
9. Zhang X, Sun L, Sun H, et al. Floating offshore wind turbine reliability analysis based on system grading and dynamic FTA. Journal of Wind Engineering and Industrial Aerodynamics. 2016 Jul 1; 154:21-33. 10. Kuo W and Prasad VR. An annotated overview of
system-reliability optimization. IEEE Transactions on reliability. 2000 Jun; 49(2):176-187.
11. Coit DW and Smith AE. Reliability optimization of series-parallel systems using a genetic algorithm. IEEE Transactions on reliability. 1996 Jun; 45(2):254-260. 12. Coit DW. Maximization of system reliability with a
choice of redundancy strategies. IIE transactions. 2003 Jun 1; 35(6):535-543.
13. Li Z, Liao H and Coit DW. A two-stage approach for multi-objective decision making with applications to system reliability optimization. Reliability Engineering & System Safety. 2009 Oct 1; 94(10):1585-1592. 14. Mahapatra GS and Roy TK. Optimal redundancy
allocation in series-parallel system using generalized fuzzy number. Tamsui Oxford Journal of Information and Mathematical Sciences. 2011 Feb 1; 27(1):1-20. 15. Ashraf Z, Muhuri PK, Lohani QD, et al. Fuzzy
multi-objective reliability-redundancy allocation problem. In2014 IEEE International Conference on Fuzzy Systems (FUZZ-IEEE) 2014 Jul 6 (pp. 2580-2587). IEEE. 16. Ardakan MA and Hamadani AZ. Reliability
optimiza-tion of series–parallel systems with mixed redundancy strategy in subsystems. Reliability Engineering & Sys-tem Safety. 2014 Oct 1; 130:132-139.
17. Jahromi AE and Feizabadi M. Optimization of multi-objective redundancy allocation problem with non-homogeneous components. Computers & Industrial Engineering. 2017 Jun 1; 108:111-123.
18. Muhuri PK, Ashraf Z and Lohani QD. Multiobjective Reliability Redundancy Allocation Problem with Inter-val Type-2 Fuzzy Uncertainty. IEEE Transactions on Fuzzy Systems. 2018 Jun; 26(3): 1339-1355.
19. Huang X, Coolen FP and Coolen-Maturi T. A heuristic survival signature based approach for reliability-redundancy allocation. Reliability Engineering & System Safety. 2019 Feb 2. https://doi.org/10.1016/j. ress.2019.02.010
20. Huang X, Jin S, He X, et al. Reliability analysis of coherent systems subject to internal failures and external shocks. Reliability Engineering & System Safety. 2019 Jan 1; 181:75-83.
21. Broehl J. Executive Summary: World Wind Energy Market Update 2018. A BTM NAVIGANT WIND REPORT. 2018.
22. Liu H. Reliability of a load-sharing k-out-of-n: G system: non-iid components with arbitrary distributions. IEEE Transactions on Reliability. 1998; 47(3):279-284. 23. Mettas A and Vassiliou P. Application of quantitative
accelerated life models on load sharing redundancy. In Annual Symposium Reliability and Maintainability, 2004-RAMS 2004 Jan 26 (pp. 293-296). IEEE.
24. Hassett TF, Dietrich DL and Szidarovszky F. Time-varying failure rates in the availability and reliability analysis of repairable systems. IEEE Transactions on Reliability. 1995 Mar; 44(1):155-160.