A MATURITY MODEL FOR DIGITAL TRANSFORMATION
by
Nuri USTAOĞLU
Submitted to the Graduate School of Engineering and Natural Sciences
in partial fulfillment of
the requirements for the degree of
Master of Science
Sabancı University
© Nuri Ustaoglu 2019
ABSTRACT
A MATURITY MODEL FOR DIGITAL TRANSFORMATION
Nuri USTAOĞLU
M.Sc. Thesis, December 2019
Supervisor: Assoc. Prof. Kemal Kılıç
Keywords: Maturity Model, Digital Transformation, Assessment Model, Digital Readiness, Capability Maturity
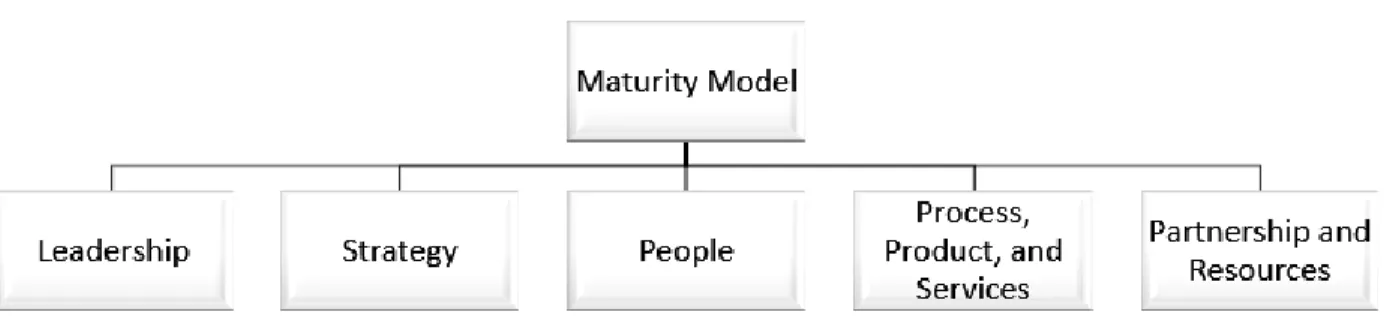
Various disruptive digital technologies such as IoT, Artificial Intelligence, Big Data and Analytics, 3D Printing, Augmented Reality, Cybersecurity, Clouding, Autonomous Robots, Simulation, Horizontal and Vertical Integration challenge the traditional means of doing business. Also, factors such as fierce price competition due to price transparency, the increased demand for customized product and services, and so on force organizations to adapt to the rapid change in digital technologies. However, many companies have doubts about where to start their transformation process. In order to develop a roadmap, the companies should first identify their weaknesses and strengths in the context of digital transformation. Maturity models have been used for years in order to identify companies’ weaknesses and strengths. In this work, we proposed one such maturity model to determine the current readiness level of the companies in the context of digital transformation. Overall, we defined 5 dimensions and developed/adopted 76 questions for assessing digital maturity. These dimensions include “Leadership”, “Strategy”, “People”, Partnership and Resources”, and “Product, Process, and Services”. The proposed maturity model is among the few models that are based on sound theoretical frameworks already validated in earlier studies and/or widely used in the literature and practice.
ÖZET
DİJİTAL DÖNÜŞÜM ODAKLI OLGUNLUK MODELİ OLUŞTURMA
Nuri USTAOĞLU
Yüksek Lisans Tezi, Aralık 2019
TezDanışmanı: Doç. Dr. Kemal Kılıç
Anahtar Kelimeler: Olgunluk Modeli, Dijital Dönüşüm, Değerlendirme Modeli, Dijital Dönüşüme Hazır Olma, Yetenek Olgunluğu
Dijital teknolojiler, geneleksel iş süreçlerini iş yapma yöntemleri olarak kullanan şirketler için en büyük tehdittir. Çünkü yakın bir gelecekte hemen hemen her şey internet yardımı ile birbirine bağlantılı olacak. Sonuç olarak, şirketler IoT, Yapay Zeka, Büyük Veri ve Analitiği, 3D Yazıcı, Artırılmış Gerçeklik, Siber Güvenlik, Bulut Teknolojileri, Otonom Robotlar, Simülasyon gibi kökten değiştirici teknolojilerle süreçlerini değiştirmek zorunda kalacaklar. Ayrıca, bu teknolojilerle birlikte rekabetin artması, maliyetlerin düşmesi ve müşterinin etkinliğinin artması, şirketleri dijital teknolojilerin hızlı değişmesine uyum sağlamak ve ileri bir sürece devam etmek konusunda mecbur bırakmıştır. Bu sebeplerden ötürü şirketler bu teknolojiler tarafından yaratılan yeni çağa hazırlıklı olmalıdırlar. Ayrıca, dijital dönüşüme hazırlık için ilk adım, şirketin mevcut dijitalleşme seviyesinin değerlendirilmesidir. Bu çalışmada, şirketlerin mevcut hazırlık seviyelerini belirlemek için bir olgunluk modeli hazırlamayı amaçladık. Genel olarak, dijital olgunluğun değerlendirilmesi için 5 boyut ve 76 soru tanımladık. Değerlendirme boyutları olarak, “Liderlik”, “Strateji”, “İnsan Kaynakları”, Ortaklık ve Kaynaklar” ve “Ürün, Süreç ve Hizmetler” i ele aldık.
ACKNOWLEDGEMENTS
I would like to express my sincere gratitude to my advisors Assoc. Prof. Kemal Kılıc and Assoc. Prof. Abdullah Dasci for their support, guidance, and encouragement that have enabled me to complete my thesis. Through their actions they have shown me how research should be accomplished and it has been privileged to study under their guidance. Also, the doors to my advisors’ office were always open whenever I ran into trouble or had a question about my research. They consistently steered me in the right the direction whenever they thought I needed it.
I would like to especially thank my parents and my grandparents for their endless love and selfless support over the years. I am grateful for everything they have done for me. This accomplishment would not have been possible without them.
TABLE OF CONTENTS ABSTRACT ... IV ÖZET ... V ACKNOWLEDGEMENTS ... VII LIST OF TABLES ... X LIST OF FIGURES ... XI INTRODUCTION ... 1 1.1. Maturity Models ... 4 1.2. Factor Analysis... 5 LITERATURE REVIEW ... 8 2.1. General Issues ... 9 2.1.1. Region ... 15 2.1.2. Sector ... 16 2.1.3. Implementation ... 17 2.1.4. SME Considered ... 17 2.1.5. Public Availability ... 18
2.1.6. Self – Assessment Consideration ... 19
2.1.7. Strategy Roadmap ... 19
2.1.8. Supply chain integration ... 20
2.2. Dimensions ... 21
2.3. Sub-sections ... 27
2.4. Maturity Levels and Evaluation Type ... 27
BACKGROUND AND METHODOLOGY ... 29
3.1. EFQM Excellence Model ... 30
3.1.1. Leadership ... 30
3.1.2. Strategy ... 31
3.1.4. Partnership and Resources ... 32
3.1.5. Processes, Products, And Services ... 33
3.2. BITTMASS Human Resources Management (HRM) Module ... 35
3.3. SAP BTS (Business Transformation Service Team) Digital SCM Agenda Survey Results and BCG Nine Enabler Technologies for Digital Transformation ... 39
3.4. Bosch GmbH Conceptual DDM Model [39] ... 43
3.4.1. DDM Concept ... 44
3.4.2. Bosch GmbH Use Cases of DDM ... 45
3.5. OODA Loop ... 47
MATURITY MODEL OF DIGITAL TRANSFORMATION ... 49
4.1. Leadership ... 51
4.2. Strategy ... 53
4.3. People ... 55
4.4. Process, Product and Services ... 59
4.5. Partnership and Resources ... 63
EVALUATION SYSTEM ... 65
PILOT STUDY ... 67
CONCLUDING REMARKS AND FUTURE WORK ... 70
REFERENCES ... 72 APPENDIX A ... 76 APPENDIX B ... 77 APPENDIX C ... 78 APPENDIX D ... 80 APPENDIX E ... 83
LIST OF TABLES
Table 1: Definitions of Technologies Used in Digital Transformation Table 2: General Comparisons of Papers
Table 3: Dimensions Referred at Papers Table 4: BCG Related Technologies
Table 5: Dimensions of the Maturity Model Table 6: Main Points of the Dimensions Table 7: Leadership Questionnaire
Table 8: Questionnaire and Levels of Strategy Table 9: Meaning of Each Level
Table 10: Questionnaire
Table 11: BCG 9 Technologies Defining Levels Table 12: Data Analytics Tools Defining Levels
Table 13: Questionnaire of Product, Process, and Services Table 14: Questionnaire of Partnership and Resources Table 15: Evaluation Systems
LIST OF FIGURES
Figure 1: Implementation Figure 2: Public Availability
Figure 3: Big Data Sources Generated in Supply Chains Figure 4: Concept of DDM
Figure 5: Bosch Use Cases of DDM
Figure 6: Conceptual Architecture of the Bosch Figure 7: OODA Loop
Figure 8: Maturity Levels of all dimensions Figure 9: Detailed results for the leadership
CHAPTER I
INTRODUCTION
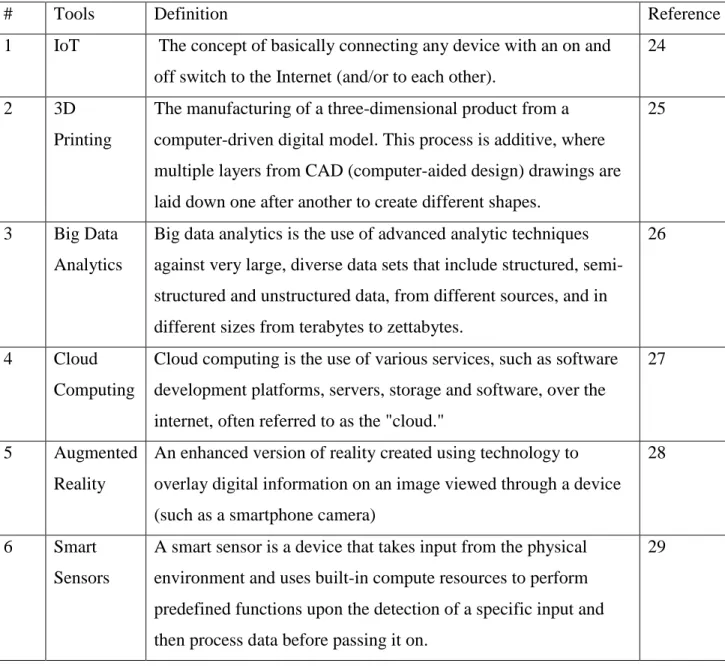
Increasing competition with digital technologies, transparency of prices, customer's power and the importance of online reputation have forced companies to adapt to the rapid transformation of digital technologies and enter a digital transformation (DT) process. By using digital technologies, we can define new business models and strategies to earn a competitive advantage and create efficiency in the corporate value chain. To achieve these goals, companies are trying to be more digital in their internal vertical processes and external horizontal processes. In addition, they attempt to improve their work efficiencies by using data-based services. Companies employ technologies and their tools such as IoT, virtual reality, big data, and financial technologies to efficiently serve customers. As in every business tool, customers are at the center of digital transformation. Conversely, considering that technology constantly renews itself, even those who have begun to experience this transformation must also constantly change. Moreover; digital transformation needs many technological platforms such as IOT, mobile devices, cloud computing, augmented reality, big data analytics, smart sensors, 3D printings, advanced human-machine interfaces, and location detection technologies. Table 1 shows the definition of these technologies.
# Tools Definition Reference 1 IoT The concept of basically connecting any device with an on and
off switch to the Internet (and/or to each other).
24
2 3D
Printing
The manufacturing of a three-dimensional product from a computer-driven digital model. This process is additive, where multiple layers from CAD (computer-aided design) drawings are laid down one after another to create different shapes.
25
3 Big Data Analytics
Big data analytics is the use of advanced analytic techniques against very large, diverse data sets that include structured, semi-structured and unsemi-structured data, from different sources, and in different sizes from terabytes to zettabytes.
26
4 Cloud
Computing
Cloud computing is the use of various services, such as software development platforms, servers, storage and software, over the internet, often referred to as the "cloud."
27
5 Augmented
Reality
An enhanced version of reality created using technology to overlay digital information on an image viewed through a device (such as a smartphone camera)
28
6 Smart
Sensors
A smart sensor is a device that takes input from the physical environment and uses built-in compute resources to perform predefined functions upon the detection of a specific input and then process data before passing it on.
29
Table 1: Definitions of Technologies used in Digital Transformation
However, using these technologies is insufficient for this transition process from the third industrial revolution to the fourth. Companies should also consider other dimensions such as human resources, strategy, and financial situations. According to [1], financial conditions
stand out as the one of the biggest challenges to digital transformation. Other difficulties for companies are the following:
• Lack of courage
• Lack of skilled labor
• Cybersecurity concerns
• Lack of knowledge to decide investments
Furthermore, most companies lack knowledge about the transformation process. Their knowledge is not enough to evaluate their current conditions in terms of digitalization. Consequently, companies should identify their weaknesses and strengths in terms of digitalization before they start their transformation processes. When they find the main weaknesses in the work area, they can easily obtain an action plan to improve their weaknesses.
To satisfy this gap, the literature contains multiple maturity models related with other disciplines. Maturity models measure the ability of companies in terms of becoming more digital in their work areas. The model evaluates companies from different points of view and offers ideas about the current situation of enterprises. Maturity models have some important elements:
• Dimensions
• Sub-sections of dimensions
• Number of levels to measure maturity
• Questions to evaluate current conditions
Firstly, dimensions are identified by experts. Dimensions are the main points of focus in the transformation process. For example, we can consider the use of technologies as a dimension of transformation. Moreover, to obtain a level of maturity in terms of dimensions, it should be divided into parts called sub-sections. Dimensions cannot be examined unaided. To examine the different point of view of the dimensions, they should have sub-sections. Also, maturity models need levels to measure the level of maturity. Besides, the maturity level can be determined with the help of the questions and check-lists. Before obtaining a maturity model, questions should be identified. Companies should establish their weaknesses with the
help of these questions. In the next chapter, we discuss related maturity models in the literature. We will review these papers in terms of dimensions, sub-sections, levels, their weaknesses and their strengths in terms of digital transformation.
1.1. Maturity Models
Maturity models are used to define the current condition of a situation and determine the capability level of a company in terms of any discipline. Maturity models have been developed to help organizations increase software quality. One of the most famous maturity models in the literature is CMM (Capability Maturity Model) from the Software Engineering Institute [46]. CCM became a standard for the software engineering field. After the usage of MM in software engineering, maturity models became famous in all areas requiring assessment. Besides, maturity models have two vital phenomena which are dimensions and levels. Dimensions are used to define which type of main points should be considered while we assess the current level of the company. Deciding dimensions is an issue to consider before obtaining a maturity model because if we want to assess the current level of a company, we should not have a missing point in our model. Also, levels are another issue that should be given attention so as to determine where the company is processing its own procedures. To find the current level of the companies in terms of digital transformation, maturity models have been commonly used at the literature.
This thesis is structured as follows: section two reviews the existing research in the literature related to the maturity model for digital transformation. Section three, describes frameworks such as EFQM [42], SAPBTS Model [40], Bosch DDM [39], and others as well as how we used these frameworks in our model. Section four develops our maturity model (its dimensions, levels, and questions). In section five, based on our survey questions obtained in previous sections the evaluation system is presented to find the final score of a company’s digitalization level. Finally, section six concludes this work. In addition, the appendix provides the survey questionnaire used in this research.
1.2. Factor Analysis
As a future work, validation of the model is described. Validation of such models can be done with the help of the factor analysis. Factor analysis gives an information reliability and validity of the test. Main goal of these tests is to determine which factors are the factor of the output and what proportion inputs affect the output. For example, we consider that many inputs are the reason of output however, some inputs that we describe can not be the reason or measure of the output. Also, some inputs can affect the output more.
Consequently, factor analysis can be used to eliminate these problems into out model. Factor analysis has some rules as the followings:
• In practice, output cannot be depending on only one input. Three or more are the best options
• Inputs that have higher correlation with the output affect more.
• Higher inter-input correlation is the reason of the greater overlap in what the inputs measure, and, therefore, higher inter-input correlations should be found for the higher internal reliability
There are two major type of factor analysis: • Exploratory factor analysis (EFA) • Confirmatory factor analysis (CFA)
In general CFA is the next step of the EFA because EFA is used to determine which inputs affect the output. Then CFA confirmed the factor structure [48].
EFA is a variable reduction technique that defines the number of hidden structures and the underlying factor structure of a set of variables. It is used to construct the variables not measured directly. Goals of factor analysis are
• To determine the number of latent constructs underlying a set of inputs (variables) • To provide a means of explaining variation among inputs(items) using a few newly created inputs
• To understand the content or meaning of output
However, it does not measure the reliability of measurement system. Nonnormality is another problem for the EFA. Data should be normal to use this method.
Confirmatory Factor Analysis
After deciding the model with the help of the EFA, CFA is the next step to make the model reliable and validated. CFA is used to search how well the hypothesized model structure fits with the data. Also, Confirmatory Factor Analysis (CFA) is a popular SEM method [49] which indicates how the observed variables relate to the assumed hidden variables. CFA is often used to assess the psychometric properties of questionnaires or other
assessments. It allows researchers to determine whether the variables they evaluate measure one or more hidden variables and how these hidden variables are related to each other. For frequently used surveys, there are many studies reporting correlations between different items of the surveys.
Some factor can affect the outputs of the test [50]. • The model that we test
• Number of samples that we implement our model • Type of measurement
• Outliers and missing data
Steps of the CFA analysis which were determined by [50] are the followings: • Review of the literature related with the model that we are studying on
• Determine the model and model identification • Pilot studies to collect data
• conduct preliminary descriptive statistical analysis (e.g., scaling, missing data, collinearity issues, outlier detection)
• deciding parameters in the model • assessing model fit
CHAPTER II
LITERATURE REVIEW
After reviewing all the literature on the topic, we identified weaknesses, strengths, and different features in terms of dimensions, subsections, number of maturity levels, evaluation type and implementation area. In this section, papers were located via Google scholar. After reviewing the abstracts of all papers, we found 35 papers related with digital transformation on this database. After closely reviewing these papers, 23 are determined relevant to our model .
All papers reviewed are based on the following criteria:
• General issues that we consider as important
• Dimensions, sub-sections of dimensions, and number of levels to measure maturity as a context
2.1. General Issues
General issues that we consider. Their explanations are shown in Table 2.
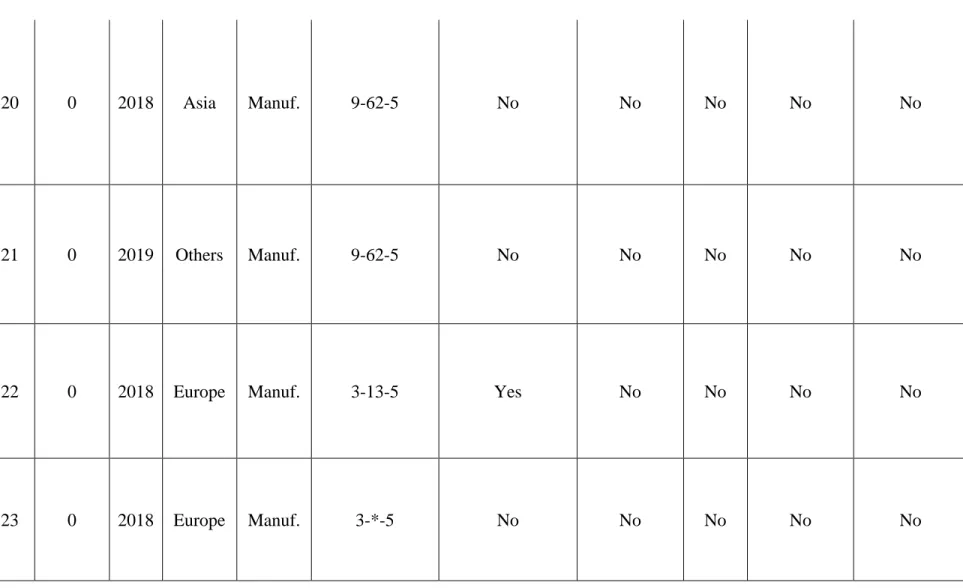
Citation Year Region Sector
#of Dimensions- subsections-levels Implementation (Y/N) SME Considered (Y/N) Public Ava. (Y/N) Self- Assessment (Y/N) Strategy Roadmap(Y/ N)
1 163 2016 Europe Manuf. 9-62-5 Yes No No Yes
Yes (At the end they give
11 pages report)
2 38 2016 Europe Manuf. 7-* -5 Yes Yes Yes No No
4 15 2017 Others Manuf. 5-*-6 No No No Yes No
5 8 2017 Europe Manuf. 6-*-6 No No No No No
6 1 2018 Europe General 3-*-4 Yes No No No
Strategy roadmap is
the key issues
7 1 2018 Europe Manuf. 5-*-6 Yes No Yes Yes Assessment process defined (Creation of awareness, definition of scope, data collection, evaluation and solution selection, Debriefing) 8 18 2016 North Americ a Manuf. 4-*-6 No No Yes No No
9 11 2017 Asia Manuf. *-*-* Yes
Yes (20 SME Implementa
tion)
10 1 2018 North Americ a Manuf. 1-5-4 No SME Specific No Yes No 11 20 2018 South Americ a Manuf. 3-10-* No No Yes No No 12 0 2018 Europe General 3-*-* No Yes. But don’t explain how? No Yes. Considered but not explained No
13 0 2018 Europe General 4-8-5 Yes
Yes (Survey tested on SME) No Yes Yes (They gave action recommenda tions after evaluation) 14 4 2017 Europe Manuf. *-*-* No No No No No
15 0 2018 Europe Manuf. 5-22-4 Yes but no explanation Yes, but don't explain No No No
16 3 2017 Europe General 3-5(for each)-5 Yes, for HR No No Yes 6 stages
roadmap 17 2 2017 Europe Manuf. 8-*-* No No No Considered but there is no assessment No
18 2 2018 Europe Manuf. 5-*-7 No No Yes No No
19 1 2018 Asia Manuf. 2-*-5 Yes
Yes, but didn’t explain No Yes, but didn’t explain No
20 0 2018 Asia Manuf. 9-62-5 No No No No No
21 0 2019 Others Manuf. 9-62-5 No No No No No
22 0 2018 Europe Manuf. 3-13-5 Yes No No No No
23 0 2018 Europe Manuf. 3-*-5 No No No No No
*: Did not defined
The retrieved papers are compared based on the following:
• Region
• Sector
• Implementation (Y/N)
• SME Considered (Y/N)
• Public Availability (Y/N)
• Consist of Self-Assessment (Y/N)
• Consist of Strategy Roadmap (Y/N)
• Supply Chain integration
2.1.1. Region
15 out of 23 papers are published by European countries and others published as follows:
• 3 by Asian countries
• 2 by North American countries
• 1 by a South American country
• 2 by other countries
In [8] and [10] which were published by North American countries, they preferred to use the term “smart manufacturing” instead of that of “digital transformation.” Also, these countries only focused on manufacturing enterprises. Additionally, [10] published this paper for SMEs although most of the papers ignore this difference. Statistical tools were used to prove their ideas at [8]. They employed a hypothesis test to show that related dimensions affect their maturity level. In terms of focusing on a maturity model of digital transformation, Asian countries are the main competitors of European countries. In [20], tuna processing, for example, has a crucial effect on economy of Indonesia so the digital transformation of the
tuna process has mostly been supported by Indonesian governments. This paper thus focuses on the digitalization level of tuna processes. [9] and [19] are published in Korea. They primarily examine cyber-physical systems while evaluating maturity level. [1] and [2] published by European countries have the greatest citation scores as other papers reviewed these papers before beginning their own studies. Also, while other countries only center on the manufacturing sector, some papers published by European countries also focused on general industry.
2.1.2. Sector
While 20 out of the 23 papers evaluated only the maturity level(s) of manufacturing companies, 3 out of 23 focused on all types of industries. The manufacturing sector is the biggest customer of digital transformation, so most papers directly considered only manufacturing companies. Also, digital transformation does not only concern itself with manufacturing areas but also can be implemented in other sectors so three papers consider these companies. This is one of the main weaknesses of the papers in the literature. Because digital transformation no longer depends only on manufacturing, all sectors need to be part of this transition to obtain a fully capable system in our era. Also, every sector has their own specialties and the maturity level of the service industry cannot be measured by the maturity model of manufacturing companies. General dimensions should be identified to measure all sectors. For example, in [6], the authors arranged their dimensions and their maturity levels not only for manufacturing companies but also for other industries. They defined 3 dimensions such as technology, organization and people, and process.
These dimensions should be common for all industries. However, to measure all enterprises, evaluation questions should be also generalized. For example, companies working in the manufacturing industry can require different digital technologies based on the service industry, so questions should not be defined according to only a specific digital technology. While the manufacturing industry can require a digital twin technology, the service sector can need more data mining technologies. Additionally, [8] are specialized for manufacturing
enterprises. When we review the questionnaire, many production-based questions such as production scheduling, production dispatching, production execution management are contained within it. Also, other questions relate to quality, maintenance, and inventory. These dimensions are important for manufacturing companies, but the importance rate cannot be equal to the that of the service industry.
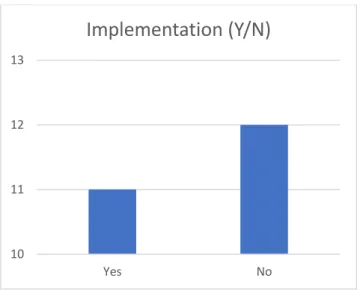
2.1.3. Implementation
Figure 1: Implementation
After evaluating the current situation of companies, some papers also provide a roadmap to implement these in their processes. This is the major point of view after validating the maturity model that we used on determining the maturity level of digital trasformation. 11 out of the 23 papers considered this point in their research (Figure 1).
2.1.4. SME Considered
SMEs are the backbone of a country’s industry. However, the transition process to digital transformation can be more complicated for SMEs. Therefore, while obtaining a maturity
10 11 12 13 Yes No
Implementation (Y/N)
model for companies, SMEs should also be considered by the researchers. However; only 30 percent (7) of the papers considered these companies. It is another main weakness of the papers in terms of evaluation. [9] is one of the best maturity models for SME’s because in this paper the researchers mostly consider SMEs, implementing their models in 20 different SMEs. Additionally, [2], [10], [12], and [13] mostly focus on small and medium enterprises. In [2], they define the main challenges faced by SMEs. A questionnaire is specified for SMEs. Also, [10] defines a sub-dimension under the product dimension as time to market. Time to market is a crucial factor for all companies but this point can be more important for SMEs. If they had prepared this model for established companies, time to market cannot be one of the most critical points under survey questions. [22] did not consider SMEs so their questionnaire is more generalized for companies of all sizes.
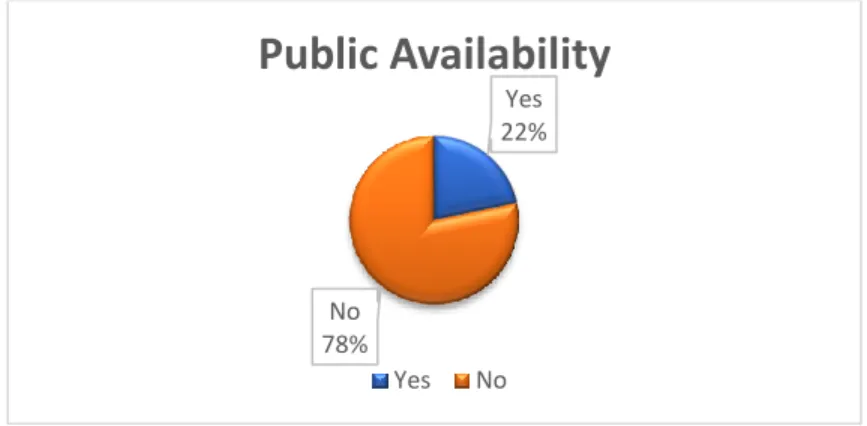
2.1.5. Public Availability
Figure 2: Public Availability
After determining the papers to be used in our literature review, we asked the authors about questions which they used in their own papers to assist in our research. Only 5 shared their questions which they used in their studies [2] [7] [8] [11] [18] (Figure 2).
Yes 22% No 78%
Public Availability
Yes No2.1.6. Self – Assessment Consideration
While 9 of the papers have a self-assessment tool, 14 of the papers did not define any tool for companies to self-assess. After obtaining a maturity model, the improvement process can start with assessments. Companies can consult with experts regarding their situations, but they also can evaluate themselves. If we consider SMEs which can not have enough invesment for experts, self-assessment is the main issue for their transition process. Therefore, assessment should also considered in the papers. In other words, self-assessment should be another main part of maturity models. [10] defines the SM3E Toolkit that helps companies for the self-assessment process. This toolkit consists of seven toolboxes identified as the manufacturing/fabrication toolbox, design and simulation toolbox, robotics and automation toolbox, sensors and connectivity toolbox, cloud/storage toolbox, data analytics toolbox, and business management toolbox. Hovewer, the main weakness of this paper in terms of self-assessment is the presentation of only one digital capability which is data driven decision making. For a complete self-assessment, other toolboxes are also needed.
2.1.7. Strategy Roadmap
Only 5 of the papers contain a strategy roadmap. Companies should also have guidelines to to assist in the assessment process. Furthermore, after the assessment process, companies need improvement based on their weaknesses. If they do not have a strategy roadmap to improve themselves, they can miss important parts in the development stages. Although a strategy roadmap can not be part of the maturity model, obtaining a strategy roadmap is the most important step after the maturity model implementation process.Additionally, [6] defines only the roadmapping process by authors of this paper. Firstly, they have provided a theoretical framework and defines the strategy roadmap processes. The roadmapping process consists of these steps:
• Task force setup
• Idea generation
• Impact estimation
• Case selection
Following these steps, companies should create a roadmapping process to improve themselves according to [6]. Additionally, [13] defines action recommendations for all dimensions to improve digital maturity. For example, if the company is at the 0 maturity level in terms of customer integration, it offers the option to arrange a workshop and user studies to develop integration of the design process between the company and customers. Additionally, [16] focuses on a strategy roadmap as well. SWOT analysis (strengths, weaknesses, opportunities, and threats) is one of the main techniques in defining weakness points upon which to focus. They define 6 points for the roadmap. These steps are identified as:
• Analysis
• Analysis of Industrie 4.0 Maturity
• Define the target states
• Target
• Realization
• Define Project
2.1.8. Supply chain integration
Another main area that is important in assessing a company is supply chain integration. Supply chain is a system that covers life cycle processes of products or services and includes the operations, information flow, and physical distribution from raw materials to end customer(s). This vertical integration is the major part of the digital transformation processes. The combination of all individuals, organizations, resources, activities should join in the creation and sale of a product, from the delivery of raw materials from the supplier to the producer until its delivery to the customer. For example; as a manufacturer, all the
departments have a great level in terms of digital transformation, but your suppliers do not have the necessary skills to develop. For this deficiency, your processes cannot be smooth in terms of digitalization. When the manufacturer wants to improve the material arrival time coming from the suppliers, they cannot achieve this goal because of lack of data originating from the supplier. Also, digital transformation is a mind-set that all value chains should join. If customers do not pay attention to the digital product, even if the company is at the high level of a transition process, the company cannot sell its products. For example, as a part of the transformation processes, a company tries to sell its product online, but customers do not want to buy it from online retailers. In this situation, customers force the company to stay at the lowest level of development.
To enable the successful implementation of the digital transformation process, all points of the entire value chain should join in the transformation process. According to this idea, integration of the entire value chain should also be considered while evaluating the digital maturity level. 13 out of 23 papers that we review discuss supply chain integration. For instance, [4] and [6] review value chain integration into a level section. In [4], if company has a vertical integration and networked manufacturing system, its maturity level rises to Level Three. Also, if company has a horizontal integration under all supply chain processes than its level will be Level Four. In Level Five, all value chain has end-to-end digital integration. [6] as well defines this integration as an inter-organizational level. If a company has digital integration not only for its own departments but also for its value-chain, then its level rises to Level Four (inter-organizational level). However, even though most of the paper is concerned with supply chain integration, these authors do not define how to measure value chain maturity level except for the papers mentioned above. Also, they did not define which dimensions should be a part of the value chain to be considered while evaluating the level. For example, products and services are essential part of the supply chain, but the human dimension cannot be related with supply chain integration.
2.2. Dimensions
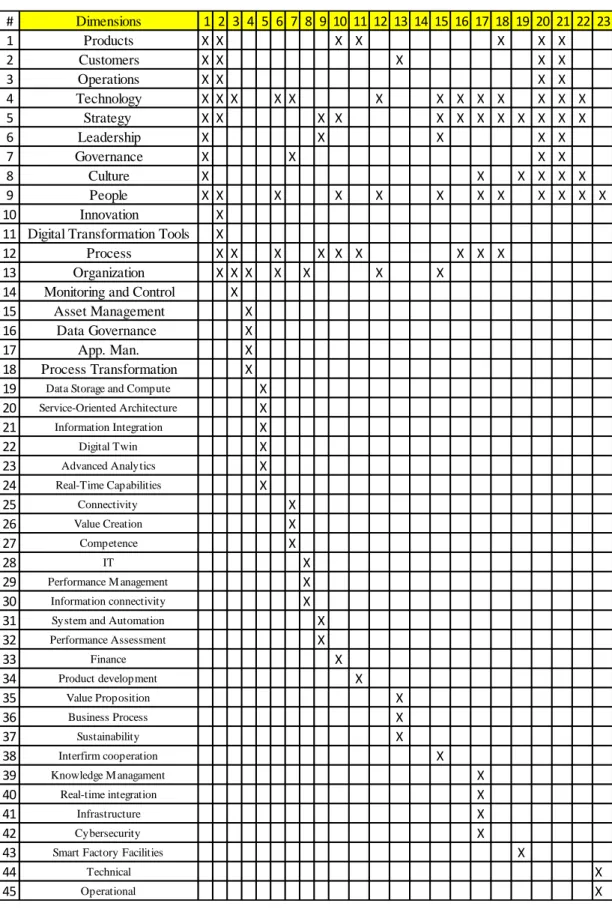
All papers consist of 45 dimensions in total as defined by the authors (Table.3) Furthermore, even if they give different names for their dimensions, they refer to the same concepts under different names.
Table 3: Dimensions referred to in the selected literature # Dimensions 1 2 3 4 5 6 7 8 9 10 11 12 13 14 15 16 17 18 19 20 21 22 23 1 Products X X X X X X X 2 Customers X X X X X 3 Operations X X X X 4 Technology X X X X X X X X X X X X X 5 Strategy X X X X X X X X X X X X 6 Leadership X X X X X 7 Governance X X X X 8 Culture X X X X X X 9 People X X X X X X X X X X X X 10 Innovation X
11 Digital Transformation Tools X
12 Process X X X X X X X X X
13 Organization X X X X X X X
14 Monitoring and Control X 15 Asset Management X 16 Data Governance X
17 App. Man. X
18 Process Transformation X 19 Data Storage and Compute X 20 Service-Oriented Architecture X 21 Information Integration X 22 Digital Twin X 23 Advanced Analytics X 24 Real-Time Capabilities X 25 Connectivity X 26 Value Creation X 27 Competence X 28 IT X 29 Performance M anagement X 30 Information connectivity X
31 System and Automation X
32 Performance Assessment X 33 Finance X 34 Product development X 35 Value Proposition X 36 Business Process X 37 Sustainability X 38 Interfirm cooperation X 39 Knowledge M anagament X 40 Real-time integration X 41 Infrastructure X 42 Cybersecurity X
43 Smart Factory Facilities X
44 Technical X
When we read and categorize dimensions of all of the papers based on their application of the terms in Table 3, the most applied dimensions are the following:
• Technology
• People, culture, and organization
• Strategy
• Process
• Product
Technology, organization, and strategy are discussed in nearly all the papers. Since these dimensions are core competencies for all types of companies for digital transformation, all papers focus primarily on these areas. Furthermore, companies generally consider people, culture, and organization as a single unit because firms decide their organizational scheme based on people and culture. Organizational culture is also shaped by the individuals who work in the company.
[1] and [17] have the highest number of dimensions (9 and 8). [1] possesses the highest number of dimensions because they evaluate all aspects overall. The paper gives general knowledge about the level of digitalization. When authors specify their target area, for example, as manufacturing, their dimensions change and decrease. For instance, [3] obtains dimensions/information(?) only for manufacturing enterprises and its dimensions are the process, monitoring, and control, technology, and organizations. They evaluate these dimensions based on production-related departments. They do not include any area outside of production. This paper gives only the maturity level in the area of production area in terms of digitalization but when all companies and all of their aspects are considered for digitalization, this maturity test is an insufficient assessment. Evaluation cannot thus be made for banks and the human resources department in manufacturing companies with the help of [3].
Moreover, the primary gap in the research for all papers is the degree of importance of all dimensions. For example, the strategy factor cannot have the same importance as that of culture while evaluating the maturity level. However; in [9], the authors weigh their
dimensions based on the type of company. Dimensions of manufacturing companies are diversified based on what they produce. Another missing part is the maturity level index comparison for all dimensions. They find some level for all dimensions but when they determine the latest maturity index, they only focus on the dimension of having a lower maturity index. However, lower maturity indices should not be the only case to consider. Another crucial component is bringing all maturity levels to the same level; however, no researcher adopts this perspective. For instance, if there is a substantial difference between the maturity level of production planning and logistics, the connection between these two dimensions will fail and all digitalization process will be affected by these disturbances. Furthermore, in [12], they define three dimensions which they considered as more important than others. They extracted other dimensions without any test(s) and the effect(s) of other dimensions were also omitted. If they want to choose the most important dimensions, they should make a hypothesis test and then select the most important factors for maturity via the R-square value. Furthermore, [14] does not define any dimension. The researchers only show how to evaluate the current situation with determined levels. In addition, [20] and [21] use the same dimensions as does [1] for a specialized case study. These dimensions are the example of [1] in implementing real life situations. Also, some papers only focus on a particular strategic dimension based on their areas. For instance, [5] and [7] only are concerned with data management, [10] as well as [13] on organizational structure, and [4] mostly focuses on software and IT systems. However, considering only one dimension is insufficient for the transition process of digitalization. Even if a company has all the technologies in its working area, if the company does not have true strategy, organization and skilled labor, digitalization does not proceed. All the dimensions should be considered together for successful transition process.
When the technology dimension is specified, researchers mostly discuss the data and its usage. For example, [7], [12], [18] and [22] focus on cloud computing, MES, IOT, big data, and data acquisition. Another crucial area in terms of technology is the smart working area. Based on [1], [3], [15] and [18], technology which is used in the working area should support all the processes in the line. Additionally, security issues are one of the main crucial points for the technological side of the digital transformation. [4] and [17] give more importance for cybersecurity than do other papers.
When we consider people, culture and strategy, the researchers focus on:
• Professional HR for data analysis
• Enterprise culture for horizontal communication
• Knowledge sharing
• Openness to innovation
• Company collaboration
• Technology competences of employees,
• Empowerment of employees,
• Employee satisfaction level
• Continuous improvement capabilities
• Worker capacity in terms of usage of data When we consider strategy, they focus on:
• Strategic awareness and alignment (Leadership competences development level, Digitization strategy, business case in plan)
• Leadership (KPI) • Government regulations, • Knowledge(data) management, • Technology investment, • Agility vision, • Manufacturing Strategy
Based on a general evaluation of all papers, companies should create a strategic awareness for all employees. They also should have a strategy to manage the transition process. Moreover, data management is one of the crucial points in terms of strategy. Also, while [17] mainly focuses on strategic awareness among employees, [1], [9] and [15] indicate company roadmap for digital transformation. Also [2] and [10] focus on sustainability and improvement of the digitalization strategy.
Moreover, even if [6] has a maturity model, it is mostly focused on a strategy roadmap after maturity identification. They use 3 different dimensions (technology, organization and
people, process) while identifying maturity level. [8] employs different dimensions based on the work of another papers, such as IT, performance management, and information connectivity. However, IT is mostly discussed in terms of data; performance management relates to the people dimension; lastly, information connectivity is also related with data management. Furthermore,[11] attempts to establish a relationship between lean production and digital transformation. They do not define any maturity model or dimensions. They use lean maturity to observe the maturity level of digital transformation. [16] defines all steps to become a digital enterprise as follows:
• Start-workshop
• Analyze I4.0 maturity
• Define target state
• Define and evaluate measures
• Prepare decision
• Define projects
Developing a maturity model and measuring the level of the current situation is one of the main steps to become a digital enterprise. Moreover, [19] defines two different dimensions such as smart factory facilities and strategy and culture. Smart factory facilities are about the automation system for product development or manufacturing processes, the ICT System to facilitate manufacturing activities, information exchange, remote control, customizing and flexible manufacturing. Strategy and culture mentions organization and strategy for I40, professional HR for data analysis, and enterprise culture for horizontal communication. Also, [23] examines three different dimensions regarding technical, operational, and human. However, when all these dimensions taken into consideration, they have the same meaning as do the technology, organization and people dimensions referred to in another papers. A technical focus on the automation system will manage the communication network of the system, communication between physical components and software, sensors, data as well as simulation and cloud (shop floor equipment, connected sensors). Besides the operational aspect discusses plant activities, decision making, organizational alignment, process, people (design, production and maintenance management, flow management, decision making
process, data analysis, and security. Additionally, the human aspect is examined in discussions regarding digital technologies (skills, roles, current education and training). Last but not least, [14] does not consist of dimensions or sub-sections. It gives information about how to evaluate your current situation. Additionally, the leaders' approach to digital transformation is another crucial area in terms of a company’s strategy. If leaders have an open mind for this process, strategy can be defined more quickly and clearly, and the company can be agile for these processes.
2.3. Sub-sections
For the sub-section part, some papers use the same sub-criteria for all dimensions and some papers employ different ones. For example, using the same subsections can be a problematic calculation. Moreover, in terms of giving the same importance factor for all dimensions, giving the same one for subsections has the same effect in the assessment. However, all subsections do not have the same outcome in a dimension. For example, in quality and cost subsections, the cost can have a greater effect on the organization dimension. [1] and [22] offers the importance rate for all dimensions while calculating the last maturity level of the company. When authors consider the weight of all subsections as equal, they miss the effect of the more important sub-sections. Also [2], [4], [5], [6], [7], [8], [12], [17], [18], [19], and [23] do not specify sub-sections. They only concentrate on dimesions to evaluate.
2.4. Maturity Levels and Evaluation Type
In terms of maturity level type, while some papers employ the same maturity level and the same evaluatian style for all dimensions or subsections; some of them apply different levels and evaluation criteria for the dimensions. For instance, [8] and [13] set different maturity levels and different evaluation criteria to obtain the exact maturity level of the companies. In [13],they define five levels; every level has its own description based on the sub-sections.
The researchers do not evaluate all dimensions with the same properties. It is crucial to find exact digitalization level of the corporations.Also, in [1], they used the same descriptions for all dimensions. They set general definitions for all evaluation levels to use for all dimensions. Hovewer; without defining the exact descriptions for all levels, it is not possible to find the actual level of the companies. Most of the papers have some self assessment and are also survey-based studies. If the paper does not clearly define what is the meaning of stages, the individuals completing the survey can experience confusion about what stage they occupy. Therefore, they can not find their real levels and where they should start the improvement process. Additionally, some papers do not evalıate the maturity level of the companies. They only show how to find the maturity level of the corporations in terms of digital transformation. For example, [11],[12], and [17] did not define levels to calculate digitalization level. They only focus on identifying key topics to consider when measuring the digital transformation level.
CHAPTER III
BACKGROUND AND METHODOLOGY
When we defined our maturity model dimensions and their levels, we used a particular framework methodology. We decided to use different methodologies for our particular dimensions.For example, to decide upon our dimensions, we used EFQM Excellence model dimensions[42] because their dimensions are well-defined and they also review all aspects of a company. Furthermore it is suitable to be transformed as a digital transformation maturity model. For levels and evaluation of dimensions, we used different tools for dimensions. Bou-Llusar et. al.’s emprical assessment of the EFQM Excellence Model[43] is applied for leadership and strategy. Also, we decided to use BITTMASS HRM Module [44] to evaluate the people dimension. Additionally, Digital SCM Agenda Survey Results defined by SAP BTS (Business Transformation Service Team) [40] was used to evaluate partnership and resources, and process, product and services.
After we chose our dimensions and level identification tools, we prepared a questionnaire to evaluate these aspects.
• Bosch Data-Driven Manufacturing Model[39]: It is a concept that we used to decide our levels.
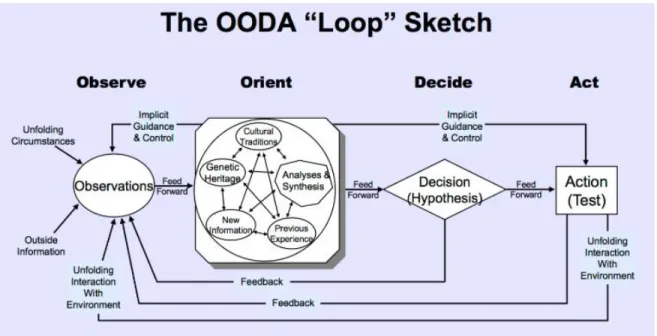
• OODA Loop[45]: It is a decision-making tool that enables individuals and organizations to strategize in every circumstance.
3.1. EFQM Excellence Model
EFQM Excellence model is a framework that shows how a company can achieve excellence. It has 5 enablers for evaluation [42]. According to the model, the kinds of skills company should have for all these enablers are the following.
3.1.1. Leadership
a) Develop vision, mission, values, ethics for Digital transformation (renew purpose of the organization).
b) Organization management system improvement based on DT.
c) Leader engagement with external stakeholder(s); encourage and help them in their own digital transformation journey.
d) Leaders are open-minded to develop the digital skills of the employees.
e) Leaders are open-minded to develop the digital skills of the company. Leaders should support technological advancement and realize the improvement effect of the digital transformation (recognize sustainable advantage and competitiveness).
f) Defining key values of the transition process and find a way to improve these and encourage the employees to also find a way to enhance performance.
g) Defining priorities to which leaders consistently pay attention h) Transferring the organizational goal to employees.
ı) The leader makes time available to listen to stakeholders and employees’ ideas about the digitalization journey.
j) Recognize employee effort and achievements.
k) Promote a culture that supports new ideas and innovations. Also promote equal opportunities.
l)Use of a structured approach for generating and prioritizing creative ideas
3.1.2. Strategy
a) Policies, plans, objectives and processes are developed and deployed to deliver digitalization strategy (New strategy development about DT and integrate it into the vision and mission of the company).
b) Strategy is based on understanding the needs of digital transformation.
c) Strategy is based on understanding internal performance and capabilities. Identify where development is needed to achieve the strategic goals.
d) Strategy and supporting policies about DT are communicated, implemented, monitored. Maintain clear strategy to achieve vision and mission.
f) Identify, analyze, and understand global, local economic, market and social trends. g) Determine potential impact of new technologies (12 enablers) and business models to understand how they complement the organization’s capabilities.
h) Compare their performance with relevant benchmarks to understand their relative strengths and areas for improvement.
ı) Planning a scenario to assess strategic risks.
j) Support translation process of the ideas to aligned processes, projects, and organizational structures and be sure that changes can be implemented true speed through value chain. k) Ensure that financial, physical and technological resources are available on time for transition process.
3.1.3. People
a) Knowledge of employees about DT. Research programs that should be taken by the employees to improve their contribution level into the company to enhance digital capabilities.
b) Educating employees about DT.
c) Obtain a mindset in between employees about DT. d) Support the organization’s strategy.
e) Empowered, aligned, and involved employees.
f) Communication level and brainstorming sessions to come with new ideas. g) Reward system.
h) Defining a people performance level indicator to achieve strategic goals.
ı) Educate people based on new technology company implemented into the operation line to increase digitalization level
j) Renew recruitment, career development, mobility and succession planning process based on the necessity of the digital transformation.
k) Usage of surveys to get ideas of the employees.
l) Obtain mindset that digital capabilities can be applied to products, processes, marketing, organizational structure and business models.
m) Obtain a sharing culture.
3.1.4. Partnership and Resources
b) Management of financial resources in a way of DT.
c) Buildings, equipment, materials, and natural resources are managed based on DT.
d) Technological advancement will be managed by strategy that is already defined based on the transition process about Digitalization.
e) Segmentation of the partners about DT. (If one of them needs help about DT, the company can get help from its stakeholder, or there can be common projects to enhance themselves about DT.)
f) Using and digitalizing of appropriate network. (They can use the same cloud management to increase communication level.)
g) To increase the level of digitalization, decide upon a project and, to prioritize, perform a financial analysis of it. (Evaluate, select, and validate investment respecting their long-term economic effects.
h) Measure and optimize the resource usage.
ı) Obtain a technology portfolio based on the necessity of the DT.
3.1.5. Processes, Products, And Services
a) Processes are designed to optimize stakeholder value
b) Products and services are developed to create optimum value for customers c) Customer relationships are managed and enhanced.
d) Customer perspectives about technological improvements on product. e) Prepare and use a framework for key processes in terms of digitalization.
f) Develop a process performance indicator to review efficiency and the digitalization level of the process. Data usage.
h) Design their service and product portfolio based on the DT.
ı) Know who their customer (existing and potential) and their needs and expectations. j) Development of digital marketing strategies based on the need and expectations of the customers.
k) Segment customers based on the digital data.
l) Communicate customers about what kind of digital technologies they need in the product. Also, EFQM has published a new excellence model in the last quarter of 2019. They defined three parts called direction, execution, and results to assess the excellence level of companies although they described two stages called enablers and results in the previous version of the excellence model that we used in our maturity model. When we compare the new model with the previous version, we realize that strategy and leadership enablers which are defined in the previous version remained the same. They called strategy as purpose, vision, and strategy and called leadership as organizational culture and leadership. In other words, while they are keeping the same enablers, they extended the scope of the first two enablers. However, other enablers that are defined in the previous sections are mostly changed. For example, people enablers changed as a part of engaging stakeholders which are defined at the execution stage of the new model. Engaging stakeholders consist of customers, people, business, society, and partnerships &suppliers. Another two parts (creating sustainable value and driving performance &transformation) and engaging stakeholders’ part are the execution of the first two stages defined as purpose, vision &strategy, and organizational culture &leadership. Although the previous model also focused on process, product, and services, this enabler does not define by the new model. One of the main changes became in this stage. While the results part of the previous model consists of four sub-dimensions called as customer, people, society, and business results, the new model divided this section into two sub-dimensions called stakeholder perceptions and strategic and operational performance. However, when we review these new sections deeply, we realize that these parts carry the same purpose. For example, while the stakeholder perceptions section covers all four results of the previous model based on the stakeholder’s relationship perspective, other result section of the new
model (strategic &operational performance) approach based on the strategic and operational performance perspective.
Another tool that we prefer while we are obtaining questionnaire is BITTMASS HRM Module. It is used to organize a questionnaire for the people section.
3.2. BITTMASS Human Resources Management (HRM) Module
Human resources management needs digital technologies to improve these processes. These are the following:
• IoT: It helps to gather large chunks of data from different operations to analyze with big data analytics tools
• Big Data Analytics: We can use data analytics on social media, automated measurement with sensors, surveys, and requirements for the job. We can detect major points and focus on the improvement process.
• CPSs and Sensors: Work wear sensors and machine sensors can be used to take data from employees and from processes.
Which, in turn, enables automatic data acquisition, information creation and sharing. HR activities can be considered under 6 sub-dimensions:
• Recruitment and selection activities
• Orientation activities
• Training and development activities
• Performance management and appraisal activities
• Activities related to compensation and benefits
• HR data gathering and information creation
According to the six categories, a questionnaire that should be considered as follows [44]: 1) Recruitment and selection activities
For the recruitment and selection activities, a questionnaire and the digital enablers that we can use to answer these questions are the following [44]:
• How much staff do we need at what skill levels?
➢ Big data and analytics to determine the exact number of employees
➢ Employee performance data and skills data from HRM information system.
• Do we recruit the right staff?
➢ Social media profiles
➢ Data mining
➢ Image recognition techniques
• Which channels should we utilize in order to acquire the best talent to the organization?
• Social media profiles (LinkedIn, Twitter, Facebook, for example)
• Which factors that we should focus while screening the candidates?
• Job advertisement requirement analysis with the help of the big data and analytics
• Which tests are the most efficient for a job? 2) Orientation Activities
For the successful orientation activities, a company can answer these questions with the help of the required digital tools that we mention below.
• Are we giving the right orientation when taking onboard new employees?
➢ After the orientation process, we can measure the efficiency of the process with the help of the surveys, efficiency of the new employee data. Than we can optimize the process after evaluation of the data with the help of the big data analytics tools.
• How can we personalize the orientation process?
➢ The company can use augmented/virtual reality tools to show desired skills for the open job positions for the candidates.
• Can we utilize their social networks in order to assign a mentor to the new employee?
➢ Match the new employee and existing ones based on their social media profiles
3) Training and Development activities
For training and development activities, according to [44], the questionnaire and the digital enablers that we can use to answer these questions are the following:
• Which types of trainings are the most effective?
➢ Data analytics over KPIs can help to determine most effective types of training.
• Which voluntary trainings are trending among the employees across the organization? Is there a need for proactive training?
➢ With the help of the wearable sensors, the automated measurement of employee stress and physical fatigue measurement can offer data about the need for proactive training.
➢ Data analysis of the number of employees that assign voluntary activities.
➢ Historical data from the information system by analytics tools
• Who should be considered for development activities?
➢ Social media activities can be used for the selection process (which people are open-minded about developing themselves)
➢ Competition can be organized before the selection process.
• What skills and job experience produce high performance?
➢ Expertise and skills of the employees can be compared with the job requirement with the help of the digital footprint of all employees. Based on these, trainings can be personalized.
• Can we come up with more time and cost-efficient training program?
➢ 3D printing can help quicker learning process for some product development activities.
➢ AR/VR can be used to simulate dangerous scenarios to prepare employees.
4) Performance management and appraisal activities
For the performance management and appraisal activities, a company should answer the following questions with the help of the required digital tools that we mentioned below.
• How are individual KPI’s related with organizational performance?
➢ Analytics on employee skills and expertise data; compare outputs with company objectives.
• How can we identify, nurture, and retain our talents within the organization?
➢ Internal surveys
➢ Employee feedback
• Do we promote the right staff?
➢ Efficiency test of the department and comparison based on the past data.
• Do we have fair pay for a performance system?
➢ Improvement analyze (comparison with the past data)
• Which managers are the best in terms of coaching?
➢ Analyzing the internal communication feedbacks
➢ Social media analyze of the managers
➢ Non-organization recognition
• Which feedback mechanisms are most influential in terms of employee and organizational performance?
➢ Sensors
➢ Product and machine data
➢ Information systems
5) Activities related with the compensation and benefits Following question can measure the level of these phenomena:
• How are the compensations and benefits related with the individual and organizational performance?
➢ Analyze employee performance with data analysis tools. Are there any decreasing trends about performance?
➢ Analysis of entry and exit times with data analysis tools.
➢ Which department has the most people leaving?
➢ Anonymous surveys about complaints.
• How does the compensation and benefits effect employee retention?
➢ Anonymous surveys about complaints and benefits.
• Data analysis on the surveys.
• Reward system development.
• Can we cut compensation and benefits without much reduction in employee and organizational performance?
6) HR Data Gathering and Information Creation
Data gathering can be performed from following areas:
• HR Data
• Data from outside the HR domain (Sales, marketing, finance, production)
• Data from comparison of the employee skills and organizational targets
• Data from comparison with another companies
3.3. SAP BTS (Business Transformation Service Team) Digital SCM Agenda Survey Results and BCG Nine Enabler Technologies for Digital Transformation
SAP BTS define 17 use cases [40] via industry experts and proved their applicability. We decided to use these 17 use cases to obtain our questionnaire for process, product, and
services, as well as partnership and resources. Also, we used five levels (none-descriptive-predictive-prescriptive-self optimized) that are defined by [39] to measure the level of these use-cases. To easily decide which level the company can present, we used Nine Enablers technology defined by BCG [41]. BCG related technologies are shown in the table below.
Table 4: BCG Related Technologies Explanation of all 17 use-cases are the followings:
1- Supply chain control tower: ERP, MES, Computerized Shipping and Tracking, Radio Frequency Identification (RFID), Use Social Media to Streamline Supply Chain, and big data are required to control supply chain.
- ERP and MES: To view and control all value chains, ERP and MES have a crucial role. We can organize inventory data, tracking information, and create electronic bills - Computerized shipping and Tracking: With the help of the transportation
management system, shipping errors can be decreased.
- RFID: RFID technologies have an important role in tracking every product in all stages. Visibility of all processes gives a greater opportunity to improve the value chain of the product and process. Also, RFID provides computerized product management and potential problems can be eliminated before they occur.
- Social Media: Social media can be useful to detect problems and find opportunities to increase the supply chain process with the help of the following:
➢ Shipment alert
➢ Communicate pricing changes
➢ Identify supply chain risks
➢ Provide routing
➢ Relationship management
Levels BCG 9 Technology
0 (None) None
1 (Desc.) Cloud, Cybersecurity, IoT, Sensors, Big data and analytics (Visualization, Data Acquisition Tools) 2 (Pred.) Big data and analytics (Statistical Analysis, Time Series Analysis, Simulation)
3 (Presc.) Big data and analytics (Optimization (Mathematical Programming, Multi-Criteria Decision Making, Data-Driven Decision Making) 4 (Self-opt.) All these processes are working autonomously
➢ Supply chain collaboration (Voice of the customer, functional integration, external integration)
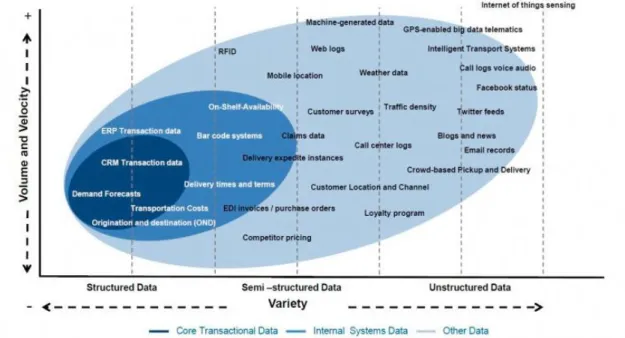
- Big Data: As evidenced in the graph, there are 52 different sources of big data generated in supply chains. Big data also helps to provide more complex network focus on knowledge sharing and collaboration.
*Rozados et. all, “Big Data Analytics in Supply Chain Management: Trends and Related Research”, 6th International Conference on Operations and Supply Chain Management, 2014.
Figure 3: Big Data Sources Generated in Supply Chains
2- Flexible on-demand business IT: Cloud computing will transform supply chain management. The common consensus is that the cloud will include a larger proportion of IT within supply chain management soon.
3- Business network for commodity parts: There are many challenges about supply chain when the suppliers become far away from one other. The main challenges about the supply chain are increased number of business partners, difficulty of tracking parts, lack of transportation infrastructure, logistic data overseas, and increased time for product to reach
end-customer. Cloud and IoT are the main digital technologies to obtain a business network. Cybersecurity to protect intellectual property of the company is another crucial issue. 4- Business network for engineered parts: Cloud and IoT are the main digital technologies to obtain business network. Cybersecurity to protect intellectual property of the company is another crucial issue.
5- Additive manufacturing for plastic parts: Additive manufacturing to produce metal parts. Autonomous robots can be another technology to achieve goals.
6- Additive manufacturing for metal parts: Additive manufacturing to produce metal parts. Autonomous robots can be another technology to achieve goals. Such robots will reduce quality problems in metal parts.
7- High volume equipment reliability analysis for predictive maintenance: For predictive maintenance, analysis will start with the data gathering by sensors. Ad-hoc analysis is another major concern for the predictive maintenance. Also, IoT and cloud technologies are needed before starting the data analytics.
8- High volume equipment reliability analysis for predictive product quality: For predictive product quality, everything will start with the data gathering by sensors. Also, IoT and cloud technologies are needed before starting the data analytics.
9- Intelligent product: The intelligent product needs an internet connection with mobile devices or any other technologies so that the customer can provide remote control over products. IoT and cloud are the major technologies.
10- Geo-located shipping: A transportation management system is needed to gather data on product locations. The Cloud and IoT system are necessary to send information around the supply chain.
11- Augmented reality for warehousing: AR tools are needed. 12- Augmented reality for production.
13- Automated commissioning and packing: Autonomous robots are an important pillar. 14- Selling pattern analysis: Selling pattern analysis is data-based analysis.
15- Customer buying behavior analysis: It is a data-based analysis that the company can detect the buying behavior of its customers.
16- Trend mining: Social media is the biggest tool for the trend analysis. Companies can gather much information from this source. To obtain data, trend mining programs are used. 17- Digital product history: the application of digital product history is IoT technology. Also, RFID, barcode and SIM-cards are needed to gather information.
Another framework that we used is Bosch GmbH conceptual data-driven manufacturing model. We applied it for level strategy of process, product and services, and partnership and resources.
3.4. Bosch GmbH Conceptual DDM Model [39]
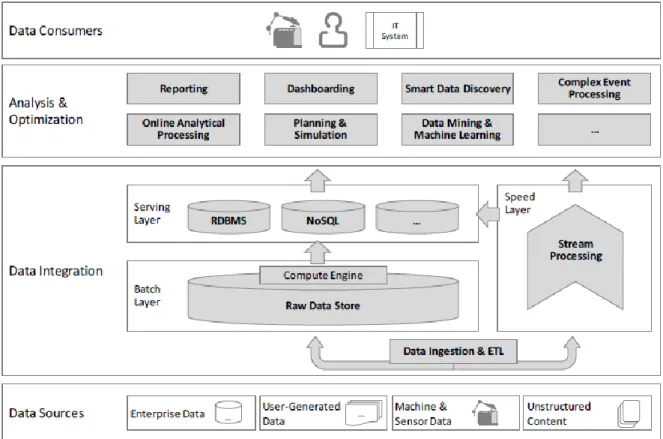
Before starting to explain the Bosch data-driven manufacturing concept (DDM), one of the crucial aspects that make DDM so important is Industry 4.0. It is a general term defining the next generation of the creation of value with the help of Internet-of-things (IoT) and Cyber Physical Systems (CPS). The DDM concept will help to combine these technologies to reach our new industry concept called as Industry 4.0. The main purpose is to reach self-optimized processes and products to achieve dramatic improvements in productivity. With the help of the IoT technology and CPS, large amounts of data can be gathered from the production line (e.g., product model data from engineering, machine sensor data from manufacturing, telemetry data from product usage, etc.). One of DDM’s main purposes is to extract business insight and knowledge from this data (e.g., for predictive maintenance, manufacturing quality analysis, product design improvements, etc.) and it is possible with the help of the data analytics tools. Data analytics terms consist of the followings:
• Business intelligence
• Big data
• Data mining
• Artificial intelligence