Design of a Fall Detection and Prevention
System for the Elderly
by
Jonathan Tomkun
&
Binh Nguyen
Electrical and Biomedical Engineering Design Project (4BI6)
Department of Electrical and Computer Engineering
McMaster University
Hamilton, Ontario, Canada
Design of a Fall Detection and Prevention
System for the Elderly
by
Jonathan Tomkun
&
Binh Nguyen
Electrical and Biomedical Engineering
Faculty Advisor: Prof. Doyle
Electrical and Biomedical Engineering Project Report
submitted in partial fulfillment of the degree of
Bachelor of Engineering
McMaster University
Hamilton, Ontario, Canada
April 23, 2010
ii
Falling is a serious health issue among the elderly population; it can result in critical injuries like hip fractures. Immobilization caused by injury or unconsciousness means that the victim cannot summon help themselves. With elderly who live alone, not being found for hours after a fall is quite common and drastically increases the significance of fall-induced injuries. With an aging Baby Boomer population, the incidence of falls will only rise in the next few decades. The objective of this project was to design and create a fall detection and prevention system for the elderly. The system consists of a wearable monitoring device that links wirelessly with a laptop. The device is able to accurately distinguish between fall and non-fall. Upon detecting a fall, the device emits a significant warning from the device and through the laptop, alerting others to the user’s fall. The device is also able to recognize dangerous tilt indicative of a fall, at which time the device emits a warning to the user to correct their orientation to minimize the risk of falling. The focus of this project was developing the most successful algorithm for detecting falls and distinguishing them from non-falls. Multiple algorithms based on both accelerometer and gyroscope platforms were examined then combined into hybrid algorithms concentrating on acceleration magnitude and angle change. The process of establishing the most successful algorithm involved rigorous testing and data collection.
Keywords: fall detection, acceleration magnitude, angle change, angular velocity, algorithm, threshold, fall prevention, elderly, automatic, wireless, Bluetooth, SVM
iii
The group would like to thank course-coordinator and faculty advisor Dr. Doyle for meeting with the group on multiple occasions to keep project progress on track, provide applicable suggestions, and give instrumental advice on SVM development. Thanks also goes to Dr. Casey Chan for technical advice and providing the use of a rapid prototyping machine, and Mike Willand for hardware suggestion and guidance. Finally, the group is grateful to On Nie (Annie) Cheong and Thilakshan (TK) Kanesalingam for putting their bodies on the line and providing test fall data.
iv
ABSTRACT . . . .. . . ii
ACKNOWLEDGMENTS . . . iii
TABLE OF CONTENTS . . . iv
LIST OF TABLES . . . vi
LIST OF FIGURES . . . vii
NOMENCLATURE . . . viii 1 Introduction 1 1.1 Background . . . 1 1.2 Objectives . . . 2 1.3 Methodology . . . 3 1.4 Scope . . . 4 2 Literature Review 5
2.1 Existing Commercial Devices. . . 5
2.2 Existing Research & Development . . . 6
3 Statement of Problem and Methodology of Solution 9
4 Experimental or Design Procedures 11
4.1 Hardware . . . 11 4.1.1 Microcontroller . . . 11 4.1.2 Sensors . . . 12 4.1.3 Bluetooth . . . 13 4.1.4 Peripherals . . . 13 4.1.5 Housing . . . 14 4.2 Software . . . 17 4.2.1 Testing/Data Collection . . . 17 4.2.2 Fall Algorithms . . . 18 4.2.3 Fall Algorithm 1 . . . 18 4.2.4 Fall Algorithm 2 . . . 20 4.2.5 Fall Algorithm 3 . . . 22 4.2.6 Post-Fall Process . . . 24
v
Appendix A: Accelerometer and Gyroscope Calibration Formulas & Tables 30
Appendix B: Testing/Data Collection Arduino Program 32
Appendix C: Testing/Data Collection PC-side Processing Program 34
Appendix D: Testing/Data Collection Matlab Data Graphing Program 35
Appendix E: Algorithm 1 Arduino Program 36
Appendix F: Algorithm 3 Arduino Program 39
Appendix G: Final Prototype Arduino Program 42
Appendix H: Final Prototype PC-side Processing Program 48
References 53
vi
4.1 Arduino Duemilanove Microcontroller Board Specs . . . 11
5.1 Experimental Results, Sensitivity and Specificity . . . 28
A.1 Accelerometer Calibration Values . . . 30
vii
2.1 Flow chart for an example fall detection algorithm . . . 7
4.1 Full device outside of housing; close up of sensors and buttons . . . 14
4.2 Housing Mk. II, SolidWorks design top view; bottom view . . . 15
4.3 Housing Mk. III, SolidWorks design top view; bottom view . . . 16
4.4 Housing Mk. III, with device components . . . 16
4.5 Flowchart for Fall Detection Algorithm 1 . . . 19
4.6 Flowchart for Fall Detection Algorithm 2 . . . 21
4.7 Flowchart for Fall Detection Algorithm 3 . . . 23
4.8 Flowchart for Post-Fall Process . . . 24
5.1 Binh falling forward; acceleration magnitude; angular velocity . . . 25
5.2 Annie falling forward; acceleration magnitude; angular velocity . . . 25
5.3 TK walking; acceleration magnitude; angular velocity . . . 26
5.4 TK sitting down hard; acceleration magnitude; angular velocity . . . 26
viii
• ADC – Analog to Digital Converter. An ADC converts continuous analog signals (typically voltages) to discrete digital bit numbers.
• Baud rate – The data rate in bits per second (bps) for serial data transmission. Common values include: 9600, 14400, 115200.
• Flash memory – Program space. In the case of microcontrollers, this is where the actual program to be executed is stored.
• I2C/I2C – Inter-Integrated Circuit. I2C is a type of serial bus and the associated protocols for communicating between I2C electronic devices.
• g – One equivalent of Earth’s gravity. 1g = 9.8m/s2.
• SRAM – Static Random Access Memory. In the case of microcontrollers, this is where a program creates and manipulates variables when it runs.
• SVM – Support Vector Machine. SVM’s are a set of learning methods used for classifying data into different categories. Typically they work by projecting data into a high or infinite dimensional space where a hyperplane can separate the data in such a way not possible in regular dimensional space.
1
I
NTRODUCTION
1.1 Background
Every year, one-third to one-half of the population aged 65 and over experience falls [1]. Of these elderly who do fall, half of them do so repeatedly [1]. Falls are the leading cause of injury in older adults and the leading cause of accidental death in those 75 years of age and older, accounting for 70% of accidental deaths [2]. More than 90% of hip fractures occur as a result of falls, with most of these fractures occurring in persons over 70 years of age [3]. Treatment of the injuries and complications associated with falls costs the U.S. over 20 billion dollars annually [4].
Many elderly live alone either in an apartment or a smaller house after their children have grown up and left home. It is not uncommon after a fall that an elderly person is unable to get up by themselves or summon help. There is therefore a need for an automatic fall detection system in which a patient can summon help even if they are unconscious or unable to get up after the fall.
There are already several products on the market attempting to address this problem that have reached commercialization [5,6,7]. However, all of these products require the fall detection device to connect (via RF) to a stationary base station, which is often a separately purchased product. This base station, placed centrally in one’s house and hardwired to a phone line, then phones a call centre for help. The disadvantage of these products is that they all require an intermediary call service which amounts to a hefty monthly fee. Also, they are all limited to the range of one’s house because they depend on the central base station for outside contact.
On the non-commercialized aspect of development, the majority of research in fall
detection is centralized around designing new more successful algorithms for determining falls from non-falls. The work around fall detection is distinguished by the equipment used and by the features extracted from sensor data. The first approach is based on accelerometers. An accelerometer is a device that can detect the magnitude and direction
of acceleration along a certain axis; usually three-axis accelerometers are used. Accelerometers can also calculate one’s angle in relation to the Earth by detecting the acceleration due to gravity of the Earth [8]. The second main approach uses gyroscopes, which measure orientation. A gyroscope consists of a spinning wheel whose axle is free to take any orientation [9]. Like an accelerometer it can measure the orientation along one or multiple axes. Using gyroscopes, it is possible to determine one’s orientation and changes in orientation, which can be used to calculate angular velocity and acceleration [8].
1.2 Objectives
With an aging population of baby boomers, our device aims to satisfy the growing unmet need of fall detection and prevention. The objective of this project is to design and create a Fall Detection System for the elderly. The system is a wearable monitoring device that can link wirelessly with a pre-programmed laptop computer or Bluetooth-compatible mobile phone. Upon detecting a fall, the device communicates wirelessly with the laptop/cell phone to call 911 and/or emergency contacts. The device also detects abnormal tilt and warns the user to correct their posture to minimize the risk of falling.
Our system is unique from existing commercial devices for several reasons. Our aim was to eliminate the middle man call centre service and therefore the extra monthly fee. We accomplished this by incorporating the system with the user’s existing cell
phone/computer, which also minimizes additional setup costs and hardware. This is dependent on the fact that the next generation of elderly (baby boomers) are relatively comfortable with technology and most likely already own a cell phone and/or computer. Our device is also unique in that it offers a manual cancellation button in the event of a false alarm or minor fall that the user was able to recover from. Another advantage our system has is that it allows mobility beyond the range of the house. Wireless linking with a cell phone allows for protection anywhere there is cell service. For more lengthy stays away from home, say when visiting a relatives’ home, wireless linking with one’s own laptop provides mobile protection a fixed base station would not allow. Our device also offers a wide range of selectable alert methods should the user be hearing-impaired,
seeing-impaired or otherwise. In the event of a fall or abnormal tilt, the device is able to emit visual, auditory, and tactile feedback in the form of flashing LED’s, siren, and vibrating buzzer, respectively. Looking at the underlying detection process, our Fall Detection System should improve on previous systems and designs. The incorporation of hybrid fall detection algorithms derived from existing algorithms would allows us to find the one with the highest sensitivity and specificity. In addition, we should be able to use our extensive test data set to design, train, and implement a simple SVM able to examine data from sensors and determine if a fall has occurred on a yes/no basis.
1.3 Methodology
Using accelerometers, the most common and simple methodology for fall detection is using a tri-axial accelerometer and applying thresholds [9,10]. This means that any motion that exceeds some threshold value of acceleration will be considered a fall. More advanced detection involves taking the dot product or cross product of the axial
accelerations to obtain the cross product magnitude and angle change [11]. With this information, new algorithms can be formulated like analyzing post-fall orientation in addition to acceleration threshold. This is important because often when a person falls, their orientation changes from vertically standing to horizontally lying on the floor.
Researchers using accelerometers give a lot of attention to the optimal sensor placement on the body; researchers generally agree that optimal fall sensor placement is at the waist [10,12]. Using gyroscopes, a similarly-placed gyroscope measures pitch and roll angular velocities. Applying a threshold algorithm to angular change, velocity, and acceleration can be successful in fall and tilt detection [9].
This project involved testing and devising algorithms for maximum sensitivity and specificity. We tested existing algorithms while using our own ideas to come up with new hybrid algorithms. Different from existing fall detection systems, our device uses both accelerometers and gyroscopes. This opened doors to new algorithms that integrate both components and essentially allowed us to have two stages of detection whereas existing devices only have one.
Testing and data collection involved multiple persons simulating falls and non-falls or Activities of Daily Living (ADL) [10]. We let the device’s algorithm distinguish between them, followed by algorithm evaluation. Since asking older people to intentionally fall is unreasonable, the simulated falls were completed by young adults (aged 20-25) in a monitored environment.
1.4 Scope
This paper will focus on the development of fall detection algorithms and their implementation in the Arduino programming language for upload onto the Arduino Duemilanove board (ATmega238 microcontroller). It will also examine the
programming used on the laptop computer end to successfully establish a connection and communicate with the device, written in the Processing programming language. In addition, hardware choice and decisions based on which sensor boards, modules, and peripherals to use in the device will be looked at.
2
L
ITERATURE
R
EVIEW
Multiple research journals were consulted to find relevant information regarding fall detection. From these journals, information on how to use the acceleration readings along multiple axes from an accelerometer to calculate acceleration magnitude, cross product magnitude, and angle change was found [11]. In addition, information on how to use the output from our gyroscopes to determine angular change, velocity, and
acceleration was also found [9]. Several journals also included the approximate values of angle change and acceleration thresholds expected during falls, leading up to falls, and in ADL [11].
2.1 Existing Commercial Devices
As expected, there exist several commercial devices already on the market that attempt to address the issue of falling in the elderly. One such device is the iLife™ Fall Detection Sensor by AlertOne® [5]. It is a self-contained, battery operated, wireless fall sensor worn on the body with a belt clip. It is designed to detect falls or abnormal body movements and automatically summon assistance without end-user intervention; it also has a manually activated button for summoning help. There are several differences between this device and ours. It uses only accelerometers and thus only acceleration-based algorithms (no gyroscope). It has only one LED for visual confirmation of
activation; it has no audio or tactile alert for the seeing/hearing-impaired. It also does not facilitate a cancel feature; once an alert is set off there is no turning it off. Finally, it requires a base station that it communicates with by RF and a call centre subscription service (US $27.95/month), both of which are additional costs on top of the wearable device.
Another fall detection device on the market is the myHalo™ by Halo Monitoring™ [6]. This is more of a full body monitoring system in that it is worn as a chest strap and detects falls, monitors heart rate, skin temperature, sleep/wake patterns, and activity levels. Data transfer requires a modem base station, which sends the information to a central server to be uploaded to a caregiver-accessible webpage. Following a fall or
emergency, the device again goes through a call centre (US $49-59/month) before
alerting authorities/emergency contacts. Because this device offers so many features, it is quite complicated and hard to access (chest-mounted). It is a system less focused on fall detection and more on total health monitoring.
One of the more well known commercial devices for fall and emergency detection is the Life Alert Classic by Life Alert Emergency Response, Inc. [7]. This device is
recognizable from long-running TV commercials starring an elderly woman on the floor exclaiming, “Help! I’ve fallen and I can’t get up!”. Despite its popularity, this device is one of the simpler emergency response devices. It consists of a pendant or watch with a single push button. Pressing this button, it connects with a base station via RF, and contacts operators at a call centre. It has no automatic features, sensors, or feedback built into the device; it requires entirely on the user’s ability to manually activate the alert and does not take into account the immobility or unconsciousness of the wearer, as is often the case in elderly post-fall.
2.2 Existing Research & Development
With the prospect of commercialization that often surrounds health related issues, there is substantial research in the academic arena surrounding fall detection for the elderly. The majority of this research is focused on designing new more successful algorithms for distinguishing falls from non-falls. Researchers in this area typically use one of two sensors with which to extract data, develop, and test their algorithms. The first approach uses accelerometers to detect acceleration along a certain axis. When monitoring for a large acceleration from a tri-axis accelerometer, it is better to look at the magnitude vector: AM = ax2+a2y +a2z , rather than at each of the axes separately [13]. To measure
angle change with accelerometer data, the dot product must be calculated:
θ
cos
b a b
a⋅ = , and rearranging for the angle yields:
⋅ = − b a b a 1 cos
θ
, whereb=(bx,by,bz) is a reference acceleration vector that is set by the user when they stand
The second main approach to fall detection uses gyroscopes to detect angular velocity and angle change. A typical bi-axial gyroscope outputs pitch (ωp) and roll (ωr) angular velocities. From these the resultant angular velocity magnitude is calculated:
. From here the resultant angle change and angular acceleration can be computed:
[9].
Using these common calculations or calculations similar to these, researchers have developed many different algorithms for detecting a fall. One example algorithm is as follows:
From this flowchart we can see one example of the steps and decisions that a
microcontroller/processor might take in distinguishing everyday activities from a real fall:
1. Look for an acceleration that exceeds ‘Large Acceleration Threshold’ 2. Wait until the acceleration dissipates and returns to relatively ‘Normal
Acceleration’
3. Analyze the user’s angle/orientation
4. If the user has an ‘Orientation Parallel with the Ground’, classify as a fall
This is one of many algorithms that have been developed for fall detection. As the complexity increases, so often does the sensitivity and specificity. For further examples of fall-detection algorithms, see [9,13,11,15,16].
3
S
TATEMENT OF
P
ROBLEM
&M
ETHODOLOGY OF
S
OLUTION
The objective of this project was to design and create a Fall Detection System for the elderly. The system had to be wearable and capable of wireless communication with a laptop computer. The device had to be able to detect dangerous tilt and if a fall had occurred. In the event of a fall or dangerous tilt, the device had to be able to warn the user and others.
To be able to detect falls, the device first has to be able to sense motion and the different measurable qualities involved with motion. Sensing in the device begins with a digital tri-axis accelerometer, which measures acceleration along the three coordinate axes. An analog bi-axial gyroscope measures the pitch and roll of the device in the form of angular velocities. To use these sensors to detect falls, the sensor readings have to be outputted to a microcontroller for processing and application to algorithms. For this to occur, first the sensor readings are converted from an analog voltage signal to a discretized bit value for the microcontroller to be able to use them. This is accomplished by passing the sensor outputs through an Analog to Digital Converter (ADC) before entering the
microcontroller.
The microcontroller has to take the discretized bit data from the ADC and apply different formulas and conversion factors to calculate the necessary factors (acceleration
magnitude, angle change, angular velocity). Using these factors, the microcontroller feeds them into an algorithm, comparing the inputs with various threshold values, initiating triggers when certain thresholds are met or exceeded.
Upon detecting dangerous tilt, the microcontroller has to initiate a brief audible, tactile, and visual warning to the user to correct their posture. The user is warned via sight, sound, and touch in case of impairment of one of the senses. Upon identifying a fall, the device initiates a continuous audible, tactile, and visual warning. The user is then given a window of time (20 seconds) in which to cancel the alert in the instance that the fall is not serious and the user is able to regain their composure on their own. If left uncancelled, the fall is considered serious and an alert is sent out.
Throughout the process of sensor readings, algorithm triggers, fall detection, etc. the device is continuously synched with a laptop computer. This is done using a Bluetooth module attached to the microcontroller for output. The synched laptop computer
constantly monitors the status of the device; it receives and stores all sensor data onto its hard drive and is updated with any algorithm trigger changes or tilt/fall detections. The laptop is then able to send an alert to the authorities and/or emergency contacts.
4
E
XPERIMENTAL OR
D
ESIGN
P
ROCEDURES
4.1
H
ARDWARE
The following are the design procedures that were involved in determining the
appropriate microcontroller board, sensor boards, peripherals, Bluetooth module, and the appropriate casing (or housing) to mount all the electronics in.
4.1.1 Microcontroller
To perform all our necessary processing, we chose to use the ATmega328
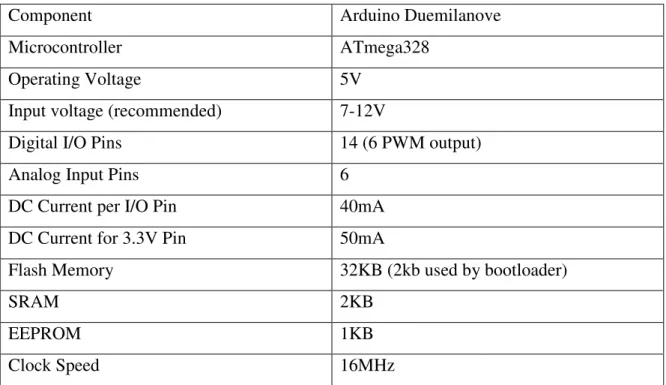
microcontroller mounted on the Arduino Duemilanove board. Some of the pertinent specifications for this microcontroller board are seen below in Table 4.1.
Table 4.1: Arduino Duemilanove Microcontroller Board Specs
Component Arduino Duemilanove
Microcontroller ATmega328
Operating Voltage 5V
Input voltage (recommended) 7-12V
Digital I/O Pins 14 (6 PWM output)
Analog Input Pins 6
DC Current per I/O Pin 40mA
DC Current for 3.3V Pin 50mA
Flash Memory 32KB (2kb used by bootloader)
SRAM 2KB
EEPROM 1KB
Clock Speed 16MHz
The Arduino Duemilanove is a very popular board among hobbyists and is the
microcontroller board of choice when building small model projects. Because of this, there are extensive tutorials and open source examples available to facilitate learning and familiarizing oneself with the board. In addition to this, we chose this board because of the following characteristics:
• Operating voltage – The operating voltage of 5V with a 3.3V option is appropriate
because both our sensor boards and Bluetooth module operate under 5 or 3.3V power and output readings in the range of 0-5V.
• Input voltage – The board has a built-in voltage regulator that allows an input
voltage range of 7-12V, which is suitable because we plan to power the board with a 9V battery.
• Number of pins – The large number of digital I/O pins (14) is fitting because we
need to interface with several peripherals (2 LEDs, 2 buttons, a buzzer, and a siren). The number of analog input pins (6) is sufficient because we require multiple pins to receive input from our sensor boards.
• Memory – The flash memory (32KB) is appropriate because our algorithm
programs can be fairly long and require a decent amount of memory on the microcontroller to store them. The SRAM (2KB) is a little on the low side, but the algorithms can work around this by not storing too many variables, so as to not exhaust the SRAM capacity.
• Specialty pins – The Arduino Duemilanove comes with RX/TX pins, which will
be used for serial communication with our Bluetooth module. The board also comes with I2C compatible pins, which will be crucial to interface with our digital accelerometer.
• USB communication and programming environment – The Arduino
communicates and loads programs from a PC via a USB cable; it can also be powered by USB. This is advantageous and simpler than other microcontrollers that require serial port or parallel communication. The Arduino programming language and environment is very user friendly. It uses the Processing, which is an object-oriented programming language based off C++.
4.1.2 Sensors
For appropriate fall detection, our device required two different types of sensors:
• Accelerometer – We selected the ADXL345 triple axis digital accelerometer to
use in our device. It has a wide settable g range (up to ±16g), which is
can also be set, there is less voltage noise, and there is less zeroing/calibration error: a 0 acceleration reading will actually give a 0, as opposed to analog
accelerometers that will give a non-zero voltage even for 0 acceleration. Also, the ADXL345 requires 3.3V power and is I2C compatible, so our microcontroller board can interface with it correctly.
• Gyroscope – We selected the LPR530AL dual axis gyroscope to use in our
device. It has a high angular velocity range (±300°/s), which is appropriate for the conditions experienced when falling. This gyro board also has built-in filtering and amplification (4x), and requires 3.3V power and outputs in the 0-5V range, so our microcontroller board can interface with it correctly.
See Appendix A for full Accelerometer and Gyroscope calibration tables and formulas.
4.1.3 Bluetooth
For wireless communication, we chose to use Bluetooth as the modality. This is because many modern portable devices (laptop computers, mobile phones, GPS, etc.) are readily compatible with Bluetooth. The Bluetooth modem we chose is the BlueSMiRF gold with a RN41 Class 1 Bluetooth module and built-in antenna. We chose this modem namely because its pins and power are 5V compatible. It also supports RX/TX serial
communication from 9600 to 115200bps (bits per second, baud rate), which makes it fully compatible with our Arduino board.
4.1.4 Peripherals
To provide interface with the user, our device has numerous peripherals:
• Two buttons (red and green) – These two buttons provide input from the user and
allow them to control the device. The chosen buttons were simple 4-pin pushbuttons compatible with 5V power. We used 10kΩ resistors as pull-down resistors to ground.
• Two LEDs (red and green) – These two LEDs provide visual feedback to the user.
They are low voltage LEDs, so required resistors to bring down the 5V power supply appropriately.
• Siren & Buzzer – These devices provide audible and tactile feedback to the user,
respectively. The siren emits a high pitch tone and the buzzer vibrates. Both were chosen for their compatibility with 5V power.
4.1.5 Housing
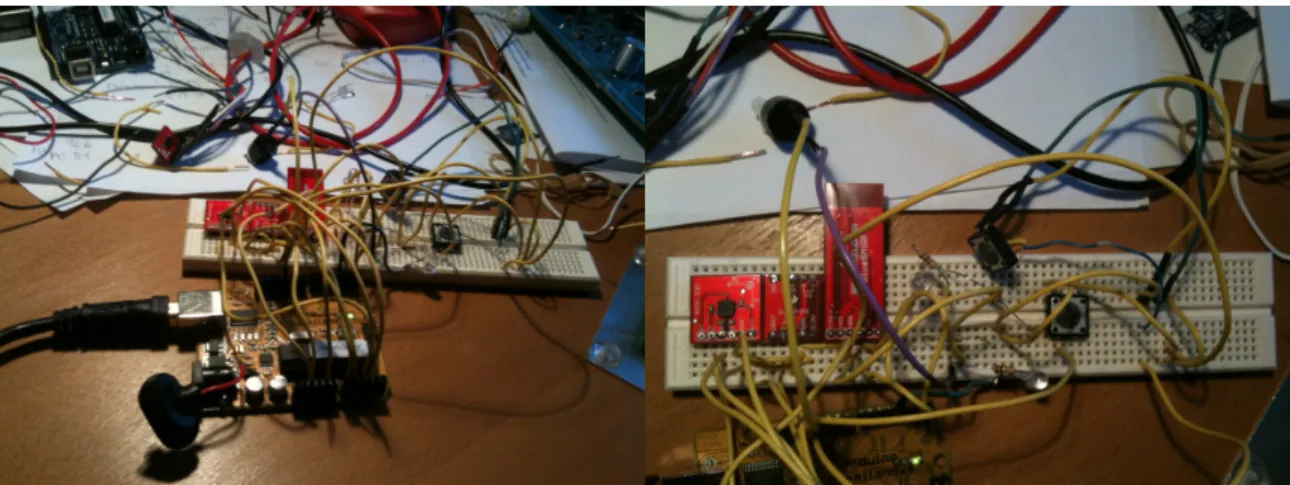
Seen below in Figure 4.1 is the full device laid out and wired on a breadboard. This layout was used for debugging purposes only to make sure all our sensors, Bluetooth, and peripherals were functioning correctly. To perform actual fall testing and data collection, a more robust housing solution was needed.
Figure 4.1: Full device outside of housing (left); close up of sensors and buttons (right).
To complete some preliminary fall testing and data collection, we proceeded to use an off-the-shelf housing box designed for the Arduino. This box was plastic and rectangular in shape with a metal lid. To house our sensors, we mounted them on a smaller
breadboard and attached it to the metal lid of the box. With this apparatus, Housing Mk. I, we were able to gather a large amount of fall data. However, this setup was only for data collection; there was no room for our peripheral alert components and buttons, or a Bluetooth module. We decided that we needed to construct a custom housing for our working prototype.
As discussed in Statement of Problem and Methodology of solution, the system had to be wearable device, capable of wireless communication with a laptop computer. This put
several design constraints on the housing of the device. The device and housing had to be small enough and light enough to be worn comfortably and not inhibit normal daily activities. Because we decided to mount the device around the hip and pelvis area, the device also had to be ergonomic (contoured to the body) and have belt holes. Due to the purpose of the device, the housing had to be shaped in such a way so as to minimize injury to the user should they fall on it. Also, the housing material and design had to be robust enough to absorb impact and endure the user’s weight falling on it. To be completely wireless, the device also had to have its own power source that was strong enough to power all the electronic components for a long period of time. We chose to use a 9V battery because its voltage is compatible with our microcontroller board, it has a suitably long battery life under these conditions, and it is economic.
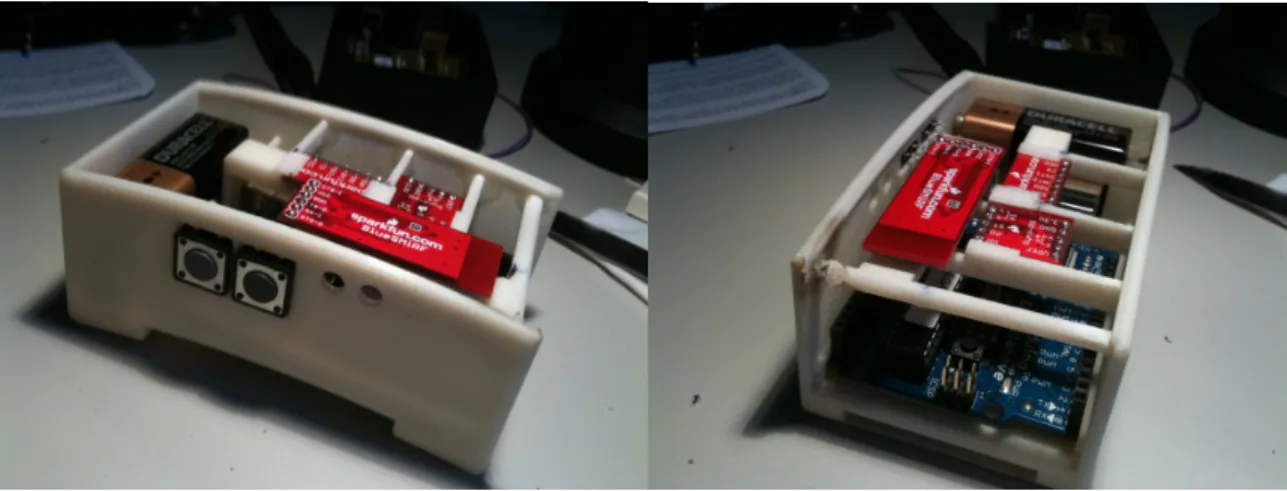
Taking these points into consideration, we came up with our second housing, designed in SolidWorks seen below (Figure 4.2). In this housing, we see bottom is curved to contour and fit the body line, and a loop hole is aligned along the bottom to slide in a belt. There are slots so that our microcontroller board and sensor boards can slide in and be held securely; there are housing holes for the pushbuttons and LEDs positioned for optimal user accessibility and visibility. The roof slides off for easy access. We had this design manufactured by a 3-dimensional prototyping machine in a lightweight, strong material known as ABS (acrylonitrile butadiene styrene); the same material used in Lego bricks.
After Housing Mk. II was milled, we assembled the device components accordingly; it functioned fairly well. However, we noticed it was rather large and cumbersome in size; also, the top of the box was still rectangular and posed a threat should the wearer fall on it. From these observations we developed Housing Mk. III, seen below in Figure 4.3. With this housing, the sensor and Bluetooth mounts were positioned above the
microcontroller to minimize unused space. In addition to filleting and chamfering
(rounding) all edges, the top and bottom of the enclosure was curved to match the contour of the body to maximize comfort for the wearer and minimize injury should the wearer fall on it.
Figure 4.3: Housing Mk. III, SolidWorks design top view (left); bottom view (right).
Housing Mk. III was milled, and we again assembled the device components (Figure 4.4). This version was much smaller and lighter, and functioned well in fall testing.
4.2
S
OFTWARE
All microcontroller programming was done in the Arduino programming language and environment. The computer based programs that communicate with the Arduino are written in the Processing language.
4.2.1 Testing/Data Collecting
For testing and data collection purposes, the device and microcontroller board was tethered to a laptop computer using a USB cable to ensure consistent data transfer and avoid the possible complications of wireless communication. On the Arduino end, the microcontroller had to be programmed to read data from the two sensors and send that data through serial (USB) to the computer. Reading from the gyroscope was done using the analogRead function, which takes the voltage at an analog input pin and converts it into a 10-bit number (0-1023). Reading from the digital accelerometer was a little more involved; it required using I2C communication protocols to writeTo the device address and setting registers to put it in the right mode (±16g, 13 bit resolution) before you could readFrom the device. I2C protocol was used for communicating between the digital accelerometer and microcontroller instead of SPI because I2C is simpler to implement and the compatible pins on our microcontroller board are available. In total, there would be 3 readings from the accelerometer (one for each axis: ax, ay, az) and 2 readings from the bi-axis gyroscope (gx, gy). Once the data from both sensors was properly read in, they were converted to Strings, concatenated, then sent to the computer over the serial connection. A delay of 100ms was inserted to in order to not clog the port. This means we took readings from the sensors 10 times a second, which proved sufficient. Each set of readings was ended with a newline character to distinguish between them on the PC side. The full Arduino data collection program can be seen in Appendix B.
As the Arduino end was running, the PC side had to run a program to receive the data. This program would open a serial communication port then read in the data as it was sent by the Arduino. The data Strings would have to be deconcatenated to extract the relevant data values back into integer form. These values were then written to a text file and stored. The full PC side data receiving program can be seen in Appendix C.
The values stored in text file format were then read into Matlab and so that they could be displayed visually. The Matlab program accesses the text files then computes the
acceleration magnitude and angular velocity magnitude from the data, and graphs them vs. time. The full Matlab graphing program can be seen in Appendix D.
4.2.2 Fall Algorithms
All of the fall algorithms that were developed conceptually had to be converted from a linear flowchart design to Arduino programming, which runs in a continuously looping architecture. Because of the limited memory (2KB SRAM) of the microcontroller, data readings can not be continuously stored in memory and earlier data beyond a certain extent can not be accessed. To ensure the program knows the ‘previous state’ of the algorithm or if one of the thresholds has been broken in a previous loop execution, a ‘trigger’ system was used. In other words, when some threshold was broken a boolean ‘trigger’ variable would be set true; in the next loop execution this would lead to additional decision statements and possible trigger activation/deactivation until all triggers are set true and a fall is detected or all triggers are turned off.
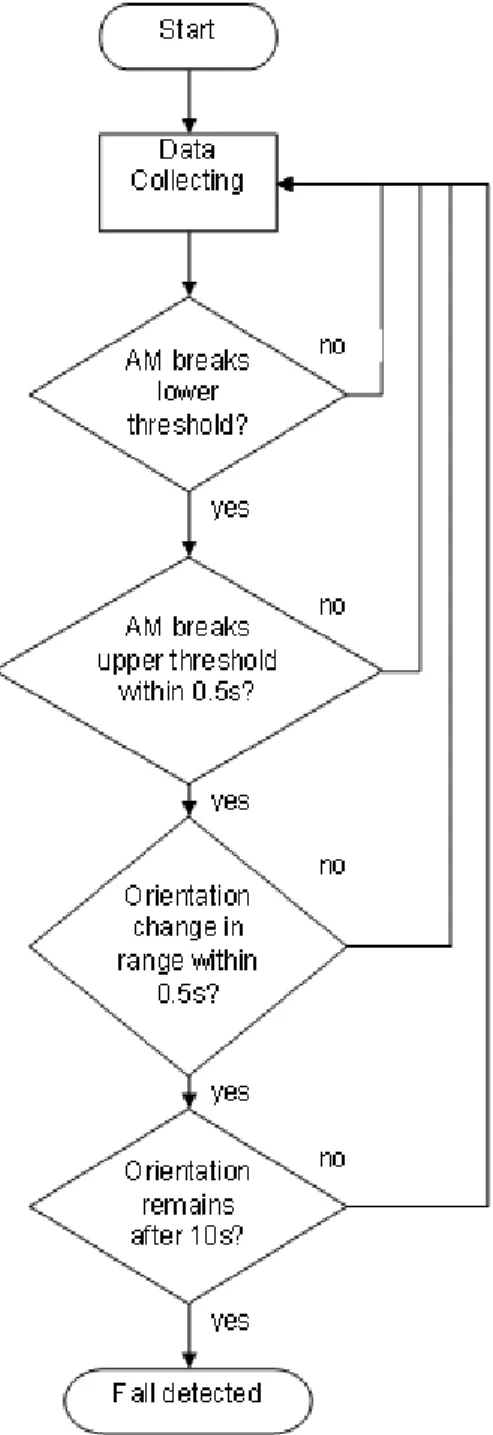
4.2.3 Fall Algorithm 1
The first fall detection algorithm is based off the concept that during a fall, a person experiences a momentary freefall or reduction in acceleration, followed by a large spike in acceleration, then a change in orientation. The flowchart for Algorithm 1 is seen below in Figure 4.5. We see the algorithm checks to see if the acceleration magnitude (AM) breaks a set lower threshold. If this lower threshold is broken, the algorithm then checks to see if AM breaks a set upper threshold within 0.5s. If this upper threshold is broken, the algorithm then checks to see if the person’s orientation has changed in a set range within 0.5s, which would indicate a person has fallen or toppled over. If the person’s orientation has changed, the algorithm then examines to see if that orientation remains after 10s, which would indicate the person is immobilized in their fallen position on the ground. If this holds true, the algorithm recognizes this as a fall. A failure of any of the intermediate decision conditions would reset the triggers and send you back to the start. The strength of this algorithm is that it requires an activity to break two AM
thresholds and have an orientation change. Ideally this additional lower threshold would reduce the number of false positives. The weakness of this algorithm is that it requires the fall to involve an orientation change. Certain falls, like those dropping down on one’s rear or against a wall, would not elicit the necessary orientation change. The full Arduino program for Algorithm 1 can be seen in Appendix E.
4.2.4 Fall Algorithm 2
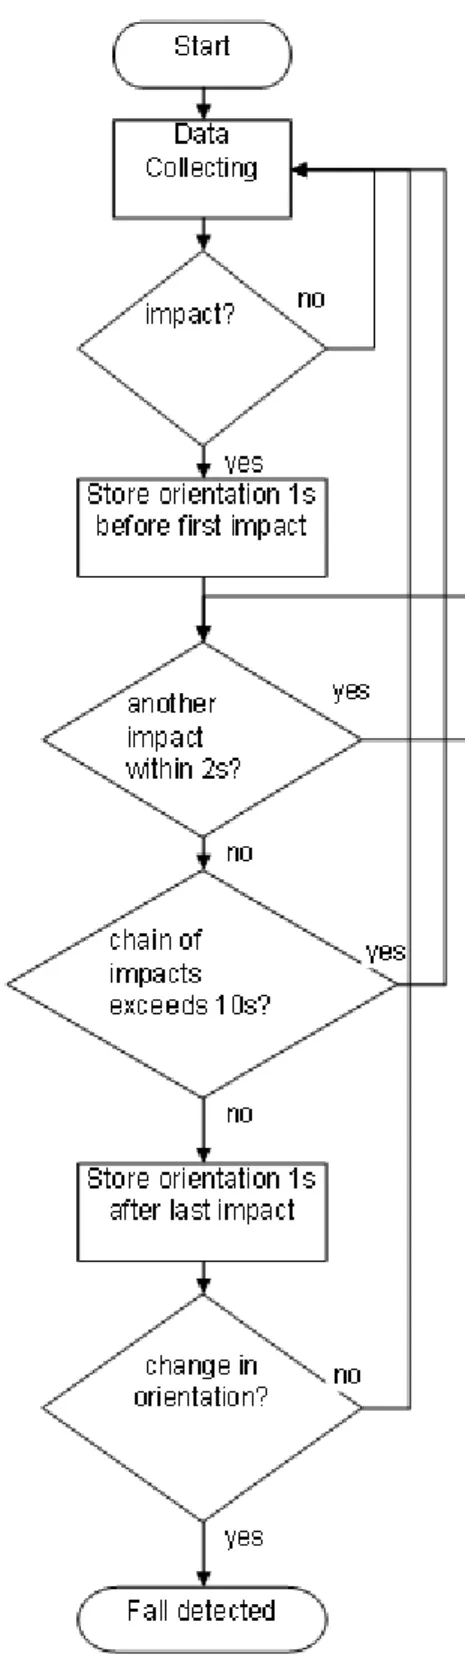
The second fall detection algorithm is focused on distinguishing and eliminating
repetitive activities like walking and running from falls. The flowchart for Algorithm 2 is seen below in Figure 4.6. We see the algorithm checks to see if an impact has occurred (AM breaks a set upper threshold). If an impact occurred, the algorithm stores the
orientation 1s before the first impact. The algorithm then checks if another impact occurs within 2s and continues to loop through until the chain of impacts stops. The algorithm then checks whether this chain of impacts exceeded 10s, which would indicate a
repetitive activity like walking or running. If the chain of impacts is less than 10s, the algorithm stores the orientation 1s after the last impact and compares it to the orientation 1s before the first impact. If a change in orientation has occurred, the person has likely toppled over during the disturbance and a fall is detected. The strength of this algorithm is that it can recognize the successive impacts that would be characteristic of normal activities like walking; it can also recognize and detect complicated falls that would involve a struggle or stumble down stairs. The weakness of this algorithm is that it requires the fall to involve an orientation change.
4.2.5 Fall Algorithm 3
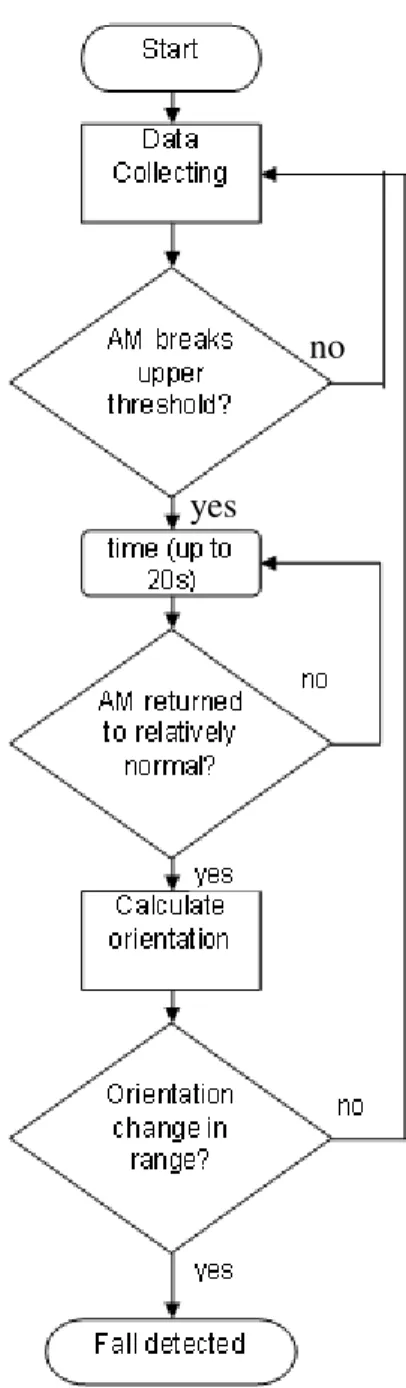
The third fall detection algorithm is based off the idea that during a fall, a person experiences a large spike in acceleration, then a period of time where they may struggle to regain composure. The flowchart for Algorithm 3 is seen below in Figure 4.7. We see the algorithm checks to see if the acceleration magnitude (AM) breaks a set upper
threshold. If this upper threshold is broken, the algorithm then waits up to 20s for the AM to return to a relatively normal level. If the AM returns to a normal level, this would indicate the person has potentially stopped struggling and is immobilized. The algorithm then checks to see if the person’s orientation has changed in a set range, which would indicate a person is motionless in a fallen position on the ground. If this holds true, the algorithm recognizes this as a fall. A failure of the intermediate decision conditions would reset the triggers and send you back to the start. The strength of this algorithm is that it takes into account post-fall struggle and return to normal acceleration to confirm the user is immobilized horizontally. The weakness of this algorithm is that it requires the fall to involve an orientation change. The full Arduino program for Algorithm 3 can be seen in Appendix F.
Figure 4.7: Flowchart for Fall Detection Algorithm 3 no
4.2.6 Post-Fall Process
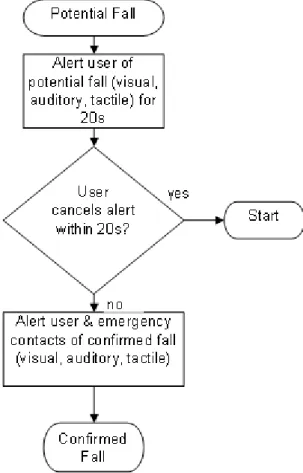
Following the detection of a fall by one of the algorithms, the fall detection programs then go through what is called a post-fall process. The flowchart for the process can be seen in Figure 4.8. In this process, all falls detected by an algorithm are considered ‘potential falls’. The user is then alerted and given a 20s window to cancel the alert if it was a false detection or they were able to regain their composure. If the alert is not cancelled within 20s, the program goes into confirmed fall mode where the user and emergency contacts are alerted of a confirmed fall incident. See Appendix G for the final prototype Arduino program that fully implements the sensors, Algorithm 3, buttons, alert peripherals, and wireless Bluetooth communication with a laptop. See Appendix H for the final prototype PC-side Processing program that fully implements wireless Bluetooth data transfer from the device, data storage to text file, onscreen display messages synched with device modes, and a real time acceleration magnitude plot.
5
R
ESULTS AND
D
ISCUSSION
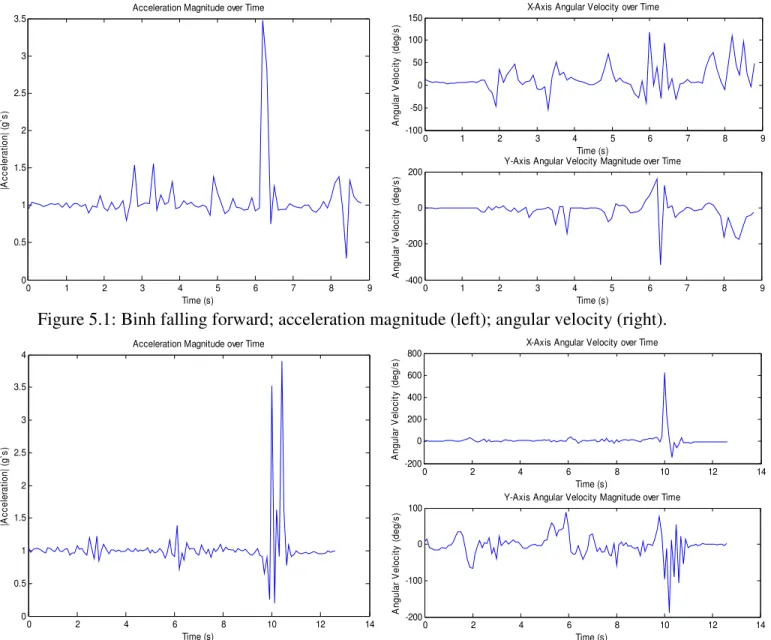
The following series of graphs represent a handful of the fall and non-fall data that we collected during our testing phases. They present a comparison between the fall
characteristics of different test subjects and a contrast between the kind of thresholds we expect to see in a fall and those we expect to see in a non-fall. In Figure 5.1 and Figure 5.2 we see Binh and Annie, respectively, falling forward. We see in both cases their acceleration magnitude reaches a peak of around 3.5-4 g’s. This data helped us set the upper AM threshold value for our algorithms around 3g’s to ensure that the acceleration from all falls will break it.
Figure 5.1: Binh falling forward; acceleration magnitude (left); angular velocity (right).
Figure 5.2: Annie falling forward; acceleration magnitude (left); angular velocity (right).
0 1 2 3 4 5 6 7 8 9 0 0.5 1 1.5 2 2.5 3 3.5
Acceleration Magnitude over Time
Time (s) |A c c e le ra ti o n | (g `s ) 0 1 2 3 4 5 6 7 8 9 -100 -50 0 50 100 150
X-Axis Angular Velocity over Time
Time (s) A n g u la r V e lo c it y ( d e g /s ) 0 1 2 3 4 5 6 7 8 9 -400 -200 0 200
Y-Axis Angular Velocity Magnitude over Time
Time (s) A n g u la r V e lo c it y ( d e g /s ) 0 2 4 6 8 10 12 14 0 0.5 1 1.5 2 2.5 3 3.5 4
Acceleration Magnitude over Time
Time (s) |A c c e le ra ti o n | (g `s ) 0 2 4 6 8 10 12 14 -200 0 200 400 600 800
X-Axis Angular Velocity over Time
Time (s) A n g u la r V e lo c it y ( d e g /s ) 0 2 4 6 8 10 12 14 -200 -100 0 100
Y-Axis Angular Velocity Magnitude over Time
Time (s) A n g u la r V e lo c it y ( d e g /s )
In the following figures, we see examples of everyday activity that should not be detected as falls. Figure 5.3 shows TK walking; his acceleration magnitude does not exceed 1.7g’s. Figure 5.4 shows TK sitting down in a chair hard; his acceleration magnitude in this case does not exceed 1.8g’s. Figure 5.5 shows Binh moving from a standing position to a lying down position; his acceleration does not exceed 1.4g’s. This data confirms our decision to make the upper AM threshold value for our algorithms around 3g’s such that most non-falls do not exceed this value in acceleration.
Figure 5.3: TK walking; acceleration magnitude (left); angular velocity (right).
Figure 5.4: TK sitting down hard; acceleration magnitude (left); angular velocity (right).
0 1 2 3 4 5 6 7 8 9 10 -300 -200 -100 0 100 200
X-Axis Angular Velocity over Time
Time (s) A n g u la r V e lo c it y ( d e g /s ) 0 1 2 3 4 5 6 7 8 9 10 -100 0 100 200
Y-Axis Angular Velocity Magnitude over Time
Time (s) A n g u la r V e lo c it y ( d e g /s ) 0 1 2 3 4 5 6 7 8 9 10 0.8 1 1.2 1.4 1.6 1.8 2
Acceleration Magnitude over Time
Time (s) |A c c e le ra ti o n | (g `s ) 0 1 2 3 4 5 6 7 8 9 10 0.8 1 1.2 1.4 1.6 1.8 2
Acceleration Magnitude over Time
Time (s) |A c c e le ra ti o n | (g `s ) 0 1 2 3 4 5 6 7 8 9 10 -200 -100 0 100 200
X-Axis Angular Velocity over Time
Time (s) A n g u la r V e lo c it y ( d e g /s ) 0 1 2 3 4 5 6 7 8 9 10 -100 -50 0 50 100 150
Y-Axis Angular Velocity Magnitude over Time
Time (s) A n g u la r V e lo c it y ( d e g /s )
Figure 5.5: Binh lying down; acceleration magnitude (left); angular velocity (right). A similar process to the one involving acceleration magnitude described above was completed with the other fall-related parameters of angle change, angular velocity and angular acceleration. For example, using the same test data as above, we also looked at the orientation change involved before and after both falls and non-falls in order to determine our orientation change ranges/thresholds.
Using the values we had determined from both research and our own fall/non-fall data collection and testing above, we established the different thresholds in our algorithms. After setting the threshold variables in our Arduino programs, we began to test the different algorithms. For accuracy and realism, the falls/non-falls were performed on bare ground instead of cushioned mats. Due to the physical demanding nature of the falls, we limited the number of tests to 20 per algorithm. To perform our testing we uploaded each algorithm program to the Arduino one at a time and performed 10 true falls and 10 non-falls and recorded the results. For consistency, only one tester was used for all algorithms and replicated the same style of fall/non-fall for each algorithm as close as possible. The experimental results are seen below in Table 5.1.
0 1 2 3 4 5 6 7 8 0.7 0.8 0.9 1 1.1 1.2 1.3 1.4
Acceleration Magnitude over Time
Time (s) |A c c e le ra ti o n | (g `s ) 0 1 2 3 4 5 6 7 8 -400 -200 0 200 400
X-Axis Angular Velocity over Time
Time (s) A n g u la r V e lo c it y ( d e g /s ) 0 1 2 3 4 5 6 7 8 -100 -50 0 50 100 150
Y-Axis Angular Velocity Magnitude over Time
Time (s) A n g u la r V e lo c it y ( d e g /s )
Table 5.1: Experimental Results, Sensitivity and Specificity
Algorithm 1 Algorithm 2 Algorithm 3 SVM
True Positives 8 7 10 10
False Negatives 2 3 0 0
True Negatives 8 8 8 9
False Positives 2 2 2 1
Total (20) 16/20 15/20 18/20 19/20
Examining these results, we see the SVM designed and trained from test fall data by partner Binh Nguyen performed the best out of the four algorithms. It was able to correctly recognize 10/10 of our real falls (true positives) and 9/10 of our non-falls (true negatives); its only fault was recognizing one non-fall as a fall (false positive). This performance was closely followed by Algorithm 3, which correctly identified 10/10 falls and 8/10 non-falls. Algorithm 1 competed respectfully, identifying 8/10 falls and 8/10 non-falls. Algorithm 2 was least effective of the four algorithms, distinguishing 7/10 falls and 8/10 non-falls.
These results are reasonable and expected. The SVM outperformed the algorithms because it was trained on a wide range of falls and non-falls whereas the regular algorithms focused simply on recognizing falls. In addition, the SVM was trained on data that included specific data from the same person who performed the final testing; it was almost as if the device was customized to the tester’s fall characteristics. Algorithm 3 performed very well as it was quite sensitive to all falls; this is because it calculated orientation change only after the person returned to normal acceleration: either standing up or immobilized on the ground. Algorithm 2 performed somewhat poorer than the others as its primary focus was on repetitive impacts and motions. Algorithm 1 relied too much on the negative acceleration before a fall: several types of fall produced minimal freefall effects before impact. Without this initial drop in acceleration, the algorithm did not pass the first decision statement.
6
C
ONCLUSIONS AND
R
ECOMMENDATIONS
The objective of this project was to design and create a wearable Fall Detection System for the elderly that can link wirelessly with a pre-programmed laptop computer or Bluetooth-compatible mobile phone. By the conclusion of this project, we had achieved our primary goal of creating a working prototype able to recognize both dangerous posture and falls from non-falls, while wirelessly synched with a laptop. Looking at the underlying detection process, our Fall Detection System improves on previous systems and designs. We incorporated hybrid fall detection algorithms derived from existing algorithms to find the one with the highest sensitivity and specificity (Algorithm 3). In addition, we were able to use our extensive test data set to design, train, and implement a simple SVM able to examine data from sensors and determine if a fall has occurred on a yes/no basis that outperformed any of the regular algorithms.
With this project, there are several areas for the future development. On the more commercial aspect of things, improvements would include: having pre-recorded voice instructions for the user, the addition of a microphone so the user can record their own personal voice messages to be sent to contacts during emergencies, establishing
emergency contacts though the PC-side by sending text messages, emails, or Voice over IP (telephoning through the internet), reducing the entire size of the device using custom fabrication/printed circuit boards and Lithium-ion batteries, and porting the PC-side programming onto an iPhone/Blackberry/Google Android phone for completely mobile communication. On the theoretical development side of things, most apparent is the need for additional testing of our existing algorithms; further tweaking of threshold values and decision/trigger conditions could produce new, even better algorithms. In addition, more test subjects from a wider range of physical categories performing more types of fall/non-fall activities would give a much more complete data set to work from. This would significantly improve the training of the SVM, and with enough data one could even implement height/weight/gender-specific SVM lookup tables/algorithms to tailor the device to each user’s individual needs.
A
PPENDIX
A:
A
CCELEROMETER AND
G
YROSCOPE
C
ALIBRATION
F
ORMULAS
&
T
ABLES
Accelerometer: signed 13-bit resolution, range ±16g, bit range -4096 to 4095, 1g=9.8m/s2
Table A.1: Accelerometer Calibration Values Bit Number Equivalent # of g's
-4096 -16 -3840 -15 -3584 -14 -3328 -13 -3072 -12 -2816 -11 -2560 -10 -2304 -9 -2048 -8 -1792 -7 -1536 -6 -1280 -5 -1024 -4 -768 -3 -512 -2 -256 -1 0 0 256 1 512 2 768 3 1024 4 1280 5 1536 6 1792 7 2048 8 2304 9 2560 10 2816 11 3072 12 3328 13 3584 14 3840 15 4095 16
Gyroscope: max ±300°/sec angular velocity, steady state: 4xOUTX=4xOUTY=1.23V 4xOUTX=4xOUTY=1.23V + SoA×°/sec, SoA=3.33mV/deg/sec
Table A.2: Gyroscope Calibration Values Bit Number Voltage deg/sec
47 0.231 -300 64 0.31425 -275 81 0.3975 -250 98 0.48075 -225 115 0.564 -200 132 0.64725 -175 149 0.7305 -150 166 0.81375 -125 184 0.897 -100 201 0.98025 -75 218 1.0635 -50 235 1.14675 -25 252 1.23 0 269 1.31325 25 286 1.3965 50 303 1.47975 75 320 1.563 100 337 1.64625 125 354 1.7295 150 371 1.81275 175 388 1.896 200 405 1.97925 225 422 2.0625 250 439 2.14575 275 456 2.229 300
A
PPENDIX
B:
T
ESTING
/D
ATA
C
OLLECTION
A
RDUINO
P
ROGRAM
#include <Wire.h>
#define DEVICE (0x53) //ADXL345 device address
#define TO_READ (6) //num of bytes we are going to read each time (two bytes for each axis)
byte buff[TO_READ] ; //6 bytes buffer for saving data read from the device
char str[512]; //string buffer to transform data before
sending it to the serial port
const int xpin = 0; // x-axis of the gyroscope const int ypin = 1; // y-axis of the gyroscope void setup()
{
Wire.begin(); // join i2c bus (address optional for master) Serial.begin(9600); // start serial for output
//Turning on the ADXL345
writeTo(DEVICE, 0x2D, 0); //reset power control register writeTo(DEVICE, 0x2D, 16); //put in stanby mode
writeTo(DEVICE, 0x2D, 8); //put in measure mode
writeTo(DEVICE, 0x31, 0); //reset data format register
writeTo(DEVICE, 0x31, 11); //put in +=16g mode >13bit resolution --> 1 sign bit + 12 bit = +-4095 max
}
void loop() {
int regAddress = 0x32; //first axis-acceleration-data register on the ADXL345
int x, y, z, gx, gy;
readFrom(DEVICE, regAddress, TO_READ, buff); //read the acceleration data from the ADXL345
//each axis reading comes in 13 bit resolution, ie 2 bytes. Least Significat Byte first
//thus we are converting both bytes in to one int x = (((int)buff[1]) << 8) | buff[0];
y = (((int)buff[3])<< 8) | buff[2]; z = (((int)buff[5]) << 8) | buff[4];
//the gyro sensor values: gx=(int)(analogRead(xpin)); gy=(int)(analogRead(ypin));
//we send the x y z accel values and x y gyro values as a string to the serial port
sprintf(str, "%d %d %d %d %d", x, y, z, gx, gy); Serial.print(str);
Serial.print(10, BYTE);
//It appears that delay is needed in order not to clog the port delay(100);
}
//--- Functions
//Writes val to address register on device
void writeTo(int device, byte address, byte val) {
Wire.beginTransmission(device); //start transmission to device Wire.send(address); // send register address
Wire.send(val); // send value to write Wire.endTransmission(); //end transmission }
//reads num bytes starting from address register on device in to buff array
void readFrom(int device, byte address, int num, byte buff[]) { Wire.beginTransmission(device); //start transmission to device Wire.send(address); //sends address to read from
Wire.endTransmission(); //end transmission
Wire.beginTransmission(device); //start transmission to device Wire.requestFrom(device, num); // request 6 bytes from device
int i = 0;
while(Wire.available()) //device may send less than requested (abnormal)
{
buff[i] = Wire.receive(); // receive a byte i++;
}
Wire.endTransmission(); //end transmission }
A
PPENDIX
C:
T
ESTING
/D
ATA
C
OLLECTION
PC-
SIDE
P
ROCESSING
P
ROGRAM
///import processing.opengl.*; import processing.serial.*; Serial sp;
byte[] buff; //buff input String read from serial com port float[] r;
PrintWriter output; //to output to text file
int OFFSET_X = 0, OFFSET_Y = 0, OFFSET_Z=0, OFFSET_GX=0, OFFSET_GY=0; //These offsets are chip specific, and vary.
void setup() {
sp = new Serial(this, "COM8", 9600); //creating new serial communication port
buff = new byte[128]; r = new float[5];
// Create a new file in the sketch directory output = createWriter("elevatordown.txt"); }
void draw() {
int bytes = sp.readBytesUntil((byte)10, buff); //receiving the input String from the serial port
String mystr = (new String(buff, 0, bytes)).trim(); if(mystr.split(" ").length != 5) {
println(mystr); return;
}
setVals(r, mystr); //splitting the String back into individual sensor readings and changing the Strings back to floats
float x = r[0], y = r[1], z = r[2], gx=r[3], gy=r[4];
println(x+ "\t" + y + "\t" + z + "\t" + gx + "\t" + gy); //printing to screen
output.println(x+ "\t" + y + "\t" + z + "\t" + gx + "\t" + gy); //printing to text file
}
void setVals(float[] r, String s) { int i = 0; r[0] = (float)(Integer.parseInt(s.substring(0, i = s.indexOf(" "))) +OFFSET_X); r[1] = (float)(Integer.parseInt(s.substring(i+1, i = s.indexOf(" ", i+1))) + OFFSET_Y); r[2] = (float)(Integer.parseInt(s.substring(i+1, i = s.indexOf(" ", i+1))) + OFFSET_Z); r[3] = (float)(Integer.parseInt(s.substring(i+1, i = s.indexOf(" ", i+1))) + OFFSET_GX); r[4] = (float)(Integer.parseInt(s.substring(i+1))+OFFSET_GY); } void keyPressed() {
output.flush(); // Writes the remaining data to the file output.close(); // Finishes the file
exit(); // Stops the program }
A
PPENDIX
D:
T
ESTING
/D
ATA
C
OLLECTION
M
ATLAB
D
ATA
G
RAPHING
P
ROGRAM
clear; clc; clf;
sensordata=dlmread('C:\Documents and Settings\Jonathan\My
Documents\Processing\accel_gyro_to_textfile\binhstumblefrontal1.txt','\
t'); %definining text file path
samplingperiod=0.1; %sampling period is 0.1s
accelx=sensordata(1:length(sensordata),1:1); %acceleration x is 1st column of text file
accely=sensordata(1:length(sensordata),2:2); %acceleration y is 2nd column of text file
accelz=sensordata(1:length(sensordata),3:3); %acceleration z is 3rd column of text file
gyrox=sensordata(1:length(sensordata),4:4); %angular velocity x is 4th column of text file
gyroy=sensordata(1:length(sensordata),5:5); %angular velocity y is 5th column of text file
time=0:samplingperiod:length(sensordata)*samplingperiod-samplingperiod; accelmag=zeros(length(sensordata),1);
gyromag=zeros(length(sensordata),1);
bx=5; by=5; bz=256; BM=((bx^2+by^2+bz^2)^0.5); %base/reference vector
for i=1:length(sensordata)
accelmag(i)=((accelx(i)^2+accely(i)^2+accelz(i)^2)^0.5);
%calculating acceleration magnitude
gyromag(i)=((gyrox(i)^2+gyroy(i)^2)^0.5); %calculating angular
velocity magnitude
angleChange2(i)=acos((accelx(i)*bx+accely(i)*by+accelz(i)*bz)/accelmag( i)/BM)*180/pi; %calculating angle change
end
figure(1) subplot(2,1,1)
plot(time,accelmag/256); %divide by 256 to put y scale in g's
title('Acceleration Magnitude over Time'); xlabel('Time (s)') ylabel('|Acceleration| (g`s)')
subplot(2,1,2) plot(time,gyromag);
title('Angular Velocity Magnitude over Time') xlabel('Time (s)'); ylabel('|Angular Velocity|')
figure(2) subplot(2,1,1)
plot(time,gyrox); title('gx'); subplot(2,1,2)
plot(time,gyroy); title('gy');
figure(3)
plot (time,angleChange2);
title('Accelerometer Angle Change over Time')
A
PPENDIX
E:
A
LGORITHM
1
A
RDUINO
P
ROGRAM
#include <Wire.h>
#define DEVICE (0x53) //ADXL345 device address
#define TO_READ (6) //num of bytes we are going to read each time (two bytes for each axis)
//#define STORE_SIZE (100) //num of past readings we are going to store (10 readings/sec * 10 sec = 100 readings)
byte buff[TO_READ]; //6 bytes buffer for saving data read from the device
char str[512]; //string buffer to transform data before
sending it to the serial port
const int bx=0; const int by=0; const int bz=256; //store reference upright acceleration
int BM=pow(pow(bx,2)+pow(by,2)+pow(bz,2),0.5);
const byte xpin = 0; // x-axis of the gyroscope const byte ypin = 1; // y-axis of the gyroscope //int data[STORE_SIZE][5]; //array for saving past data
//byte currentIndex=0; //stores current data array index (0-255) boolean fall = false; //stores if a fall has occurred
boolean trigger1=false; //stores if first trigger (lower threshold) has occurred
boolean trigger2=false; //stores if second trigger (upper threshold) has occurred
boolean trigger3=false; //stores if third trigger (orientation change) has occurred
byte trigger1count=0; //stores the counts past since trigger 1 was set true
byte trigger2count=0; //stores the counts past since trigger 2 was set true
byte trigger3count=0; //stores the counts past since trigger 3 was set true
void setup() {
Wire.begin(); // join i2c bus (address optional for master) Serial.begin(9600); // start serial for output
//Turning on the ADXL345
writeTo(DEVICE, 0x2D, 0); //reset power control register writeTo(DEVICE, 0x2D, 16); //put in stanby mode
writeTo(DEVICE, 0x2D, 8); //put in measure mode
writeTo(DEVICE, 0x31, 0); //reset data format register
writeTo(DEVICE, 0x31, 11); //put in +=16g mode >13bit resolution --> 1 sign bit + 12 bit = +-4095 max
}
void loop() {
int regAddress = 0x32; //first axis-acceleration-data register on the ADXL345
int x, y, z, gx, gy;
int AM; double angleChange=0;
readFrom(DEVICE, regAddress, TO_READ, buff); //read the acceleration data from the ADXL345
//each axis reading comes in 13 bit resolution, ie 2 bytes. Least Significat Byte first
//thus we are converting both bytes in to one int x = (((int)buff[1]) << 8) | buff[0];
y = (((int)buff[3])<< 8) | buff[2]; z = (((int)buff[5]) << 8) | buff[4]; //the gyro sensor values:
gx=(int)(analogRead(xpin)); //could be bytes? analogRead returns an int (0-1023)
gy=(int)(analogRead(ypin)); //could be bytes? // data[currentIndex][0]=x;
// data[currentIndex][1]=y; // data[currentIndex][2]=z; // data[currentIndex][3]=gx; // data[currentIndex][4]=gy;
//we send the x y z accel values and x y gyro values as a string to the serial port
sprintf(str, "%d %d %d %d %d", x, y, z, gx, gy); Serial.print(str); Serial.print(10, BYTE); AM=pow(pow(x,2)+pow(y,2)+pow(z,2),0.5); if (trigger3==true){ trigger3count++;
if (trigger3count>=10){ //*****100******//allow 10 s for user to regain normal orientation
angleChange=acos(((double)x*(double)bx+(double)y*(double)by+(double)z*( double)bz)/(double)AM/(double)BM);
if (angleChange>=1.396 && angleChange<=1.745){ //if orientation changes remains between 80-100 degrees
fall=true; trigger3=false; trigger3count=0; Serial.println(angleChange);
}
else{ //user regained normal orientation trigger3=false; trigger3count=0;
Serial.println("TRIGGER 3 DEACTIVATED"); }
} }
if (fall==true){ //in event of a fall detection Serial.println("FALL DETECTED");
fall=false; exit(1); }
if (trigger2count>=6){ //allow 0.5s for orientation change trigger2=false; trigger2count=0;
Serial.println("TRIGGER 2 DECACTIVATED"); }
if (trigger1count>=6){ //allow 0.5s for AM to break upper threshold trigger1=false; trigger1count=0;
Serial.println("TRIGGER 1 DECACTIVATED"); }
if (trigger2==true){ trigger2count++;
angleChange=acos(((double)x*(double)bx+(double)y*(double)by+(double)z*( double)bz)/(double)AM/(double)BM);
if (angleChange>=1.396 && angleChange<=1.745){ //if orientation changes by between 80-100 degrees
trigger3=true; trigger2=false; trigger2count=0; Serial.println(angleChange); Serial.println("TRIGGER 3 ACTIVATED"); } } if (trigger1==true){ trigger1count++;
if (AM>=768){ //if AM breaks upper threshold (3g) trigger2=true;
Serial.println("TRIGGER 2 ACTIVATED"); trigger1=false; trigger1count=0;
} }
if (AM<=103){ //if AM breaks lower threshold (0.4g) trigger1=true;
Serial.println("TRIGGER 1 ACTIVATED"); }
//currentIndex++;
// if (currentIndex>=STORE_SIZE){
// currentIndex=0; //cycle back to start of data array (begin overwriting old data)
// }
//It appears that delay is needed in order not to clog the port delay(100);
}
//--- Functions
//Writes val to address register on device
void writeTo(int device, byte address, byte val) {
Wire.beginTransmission(device); //start transmission to device Wire.send(address); // send register address
Wire.send(val); // send value to write Wire.endTransmission(); //end transmission }
//reads num bytes starting from address register on device in to buff array
void readFrom(int device, byte address, int num, byte buff[]) { Wire.beginTransmission(device); //start transmission to device Wire.send(address); //sends address to read from
Wire.endTransmission(); //end transmission
Wire.beginTransmission(device); //start transmission to device Wire.requestFrom(device, num); // request 6 bytes from device
int i = 0;
while(Wire.available()){ //device may send less than requested (abnormal)
buff[i] = Wire.receive(); // receive a byte i++;
}
Wire.endTransmission(); //end transmission }
A
PPENDIX
F:
A
LGORITHM
3
A
RDUINO
P
ROGRAM
#include <Wire.h>
#define DEVICE (0x53) //ADXL345 device address
#define TO_READ (6) //num of bytes we are going to read each time (two bytes for each axis)
byte buff[TO_READ] ; //6 bytes buffer for saving data read from the device
char str[512]; //string buffer to transform data before
sending it to the serial port
const int bx=0; const int by=0; const int bz=256; //store reference upright acceleration
int BM=pow(pow(bx,2)+pow(by,2)+pow(bz,2),0.5);
const byte xpin = 0; // x-axis of the gyroscope const byte ypin = 1; // y-axis of the gyroscope boolean fall = false; //stores if a fall has occurred
boolean trigger1=false; //stores if first trigger (lower threshold) has occurred
boolean trigger2=false; //stores if second trigger (upper threshold) has occurred
byte trigger1count=0; //stores the counts past since trigger 1 was set true
void setup() {
Wire.begin(); // join i2c bus (address optional for master) Serial.begin(9600); // start serial for output
//Turning on the ADXL345
writeTo(DEVICE, 0x2D, 0); //reset power control register writeTo(DEVICE, 0x2D, 16); //put in stanby mode
writeTo(DEVICE, 0x2D, 8); //put in measure mode
writeTo(DEVICE, 0x31, 0); //reset data format register
writeTo(DEVICE, 0x31, 11); //put in +=16g mode >13bit resolution --> 1 sign bit + 12 bit = +-4095 max
}
void loop() {
int regAddress = 0x32; //first axis-acceleration-data register on the ADXL345
int x, y, z, gx, gy;
int AM; double angleChange=0;
readFrom(DEVICE, regAddress, TO_READ, buff); //read the acceleration data from the ADXL345
//each axis reading comes in 13 bit resolution, ie 2 bytes. Least Significat Byte first
//thus we are converting both bytes in to one int x = (((int)buff[1]) << 8) | buff[0];
y = (((int)buff[3])<< 8) | buff[2]; z = (((int)buff[5]) << 8) | buff[4];
//the gyro sensor values:
gx=(int)(analogRead(xpin)); //could be bytes? analogRead returns an int (0-1023)
gy=(int)(analogRead(ypin)); //could be bytes?
//we send the x y z accel values and x y gyro values as a string to the serial port
sprintf(str, "%d %d %d %d %d", x, y, z, gx, gy); Serial.print(str); Serial.print(10, BYTE); AM=pow(pow(x,2)+pow(y,2)+pow(z,2),0.5); if (trigger2==true){ angleChange=acos(((double)x*(double)bx+(double)y*(double)by+(double)z*( double)bz)/(double)AM/(double)BM);
if (angleChange>=1.396 && angleChange<=1.745){ //if orientation change is between 80-100 degrees
fall=true; trigger2=false; Serial.println(angleChange); }
else{ //user regained normal orientation trigger2=false;
Serial.println("TRIGGER 2 DEACTIVATED"); }
}
if (fall==true){ //in event of a fall detection Serial.println("FALL DETECTED");
fall=false; exit(1); }
if (trigger1count>=201){ //allow 20s for AM to return to relatively normal range trigger1=false; trigger1count=0; Serial.println("TRIGGER 1 DECACTIVATED"); } if (trigger1==true){ trigger1count++;
if (AM>=250 && AM<=260){ //if AM has returned to a relatively normal range (0.9768g-1.0159g)
trigger2=true; trigger1=false; trigger1count=0; Serial.println("TRIGGER 2 ACTIVATED");
} }
if (AM>=768){ //if AM breaks upper threshold (3g) trigger1=true;
Serial.println("TRIGGER 1 ACTIVATED"); }
//It appears that delay is needed in order not to clog the port delay(100);
}
![Figure 2.1: Flow chart for an example fall detection algorithm [13].](https://thumb-us.123doks.com/thumbv2/123dok_us/9502236.2825927/16.918.296.625.577.1017/figure-flow-chart-example-fall-detection-algorithm.webp)