Bob’s Project Guidelines:
Writing a Dissertation for a BSc. in Computer Science
Robert S. LarameeVisual and Interactive Computing Group Department of Computer Science
Swansea University, Wales UK∗
Abstract
These detailed guidelines attempt to explain the mechanics of writing a third year project disser-tation in Computer Science. They serve as a useful starting point for students (and new advisors) in their third or fourth year of study in the Computer Science Department of a UK-based university. Afterall, no one is born knowing how to write a dissertation. Yet, there are certain elements, a com-monality, that can be found in virtually all good dissertations. We give our recommendations as to each section a good dissertation consists of as well as what each section contains. These guidelines are generic and can be customized to fit most projects. The guidelines are open and free to use at any university or institution without permission.
We believe that the writing can start with the abstract, however, in practice writing usually starts with the background section. The abstract can be approximately 6-12 sentences. It’s a difficult starting point, but it forces the author to write down a concise description of what it is they are researching and the associated benefits. Chances are, if the author can’t write an abstract, then it is not clear in the author’s mind what the project is about. Of course the abstract will be refined and updated over the lifetime of the project. The abstract can concisely (1) identify the project topic, (2) identify the benefits and advantages that result (3) and if there is novelty, describe the novelty of the presented work. If there’s a description of the project in a previously existing project selection brochure then that can be used as a basis for an abstract.1
∗http://cs.swan.ac.uk/
˜csbob/ e-mail: [email protected] (January 11, 2013)
1
These guidelines are a starting point only and are not a substitute for an advisor. They have been refereed and published in an education journal. [12] We recommend citing these guidelines in your dissertation to support and justify your organizational
Contents
1 Introduction (Motivation)
[included in the Initial Document, Interim Document (if updated), and Final Dissertation] 4
1.1 Formatting: . . . 4
1.2 On LATEX: . . . . 5
1.3 Project Titles: . . . 5
2 Background [included in the Initial Document, Interim Document (if updated), and Final Dissertation] 5 2.1 Related Work . . . 5
2.2 Citations . . . 5
2.3 Previous Systems (or Similar Applications) . . . 6
2.4 Data Characteristics . . . 6
3 Project Specification [included in the Initial Document, Interim Document, and Final Dissertation] 6 3.1 Feature Specification . . . 6
3.2 Technology Choices . . . 7
4 Project Plan and Timetable [included in the Initial Document, updated in the Interim Document, and Final Dissertation] 7 4.1 Time Management . . . 8
4.2 An Aside on Proofreading . . . 8
5 The Interim Document 8 6 Project Design [included in the Interim Document, and Final Dissertation] 9 6.1 Design Diagrams . . . 9
6.2 Figures and Images . . . 11
7 Implementation [started in the Interim Document and completed in the Final Dissertation] 12 7.1 Basic Implementation (Must-Have Features) . . . 12
7.2 Enhancements (or Extentions) . . . 12
7.3 Commenting Your Code . . . 13
7.4 Coding Conventions . . . 13
8 Testing and Evaluation [included in the Final Dissertation] 13 8.1 Results . . . 13
8.2 Performance Analysis . . . 14
9 Conclusions[included in the Final Dissertation] 14
10 Future Work[included in the Final Dissertation] 14
12 Acknowledgements[included in the Final Dissertation] 15
13 Appendix–BCS Accreditation 16
1
Introduction (Motivation)
[included in the Initial Document, Interim Document (if updated), and Final Dissertation]
Although the title of the starting section is “Introduction” it should really be Motivation. In one or two paragraphs, introduce the topic. This is followed immediately with why this is a useful project, including possible applications of the work. “What is this dissertation topic good for?” is really the question a good introduction attempts to answer.
After the motivation behind the subject is described, the benefits, advantages, and possibly novelty of the dissertation are presented. This is actually where a project could start. It starts with an idea, and one key to evaluating how good an idea is being able to identify its benefits and possibly novelty. Each benefit that reading this dissertation provides is identified very explicitly in a bulleted list. Possible points to mention include:
• Does the presented work provide a software tool of some sort? • Does the presented system provide interactive features? • Who will potentially benefit from the work?
• Does the tool or system provide new insight in some way?
• What does the reader potentially gain from reading this dissertation?
Words like, contribute, benefit, advantageous, and possibly novel are used in this list. An explicit bul-leted list is used in order to make the subject black and white to the reader. Otherwise, a reader might not understand the dissertation. The goal of the project has to be carefully considered in this context. Describe the goal of the project here.
The presented work often builds on a previous system or algorithm. If so, your work may inherit benefits from the previous work. Those inherited advantages may also be listed.
In order to achieve the amazing benefits your project has to offer, specific challenges must be overcome, both conceptual and technical. Those challenges can be mentioned here.
The introduction section then concludes with how the rest of the dissertation is organized. Section 2 presents previous work on this topic. Section 3 presents the project specifications followed by the project plan in Section 4. Section 6 presents the project design. The Interim document is describe in Section 5. Section 7 presents our system or method starting with an overview. Section 8 presents an evaluation of our results both from a performance point of view and memory point of view. Section 9 completes the exposition with conclusions and future work (Section 10).
1.1 Formatting:
The format of the dissertation can be very similar to this document: 11 or 12 point times (or similar) font, single column. Excessive white space is to be avoided. Some authors try to pad their dissertation with a lot of unnecessary white space. Sometimes there are blank pages, or pages that are only half occupied with content. This is a waste. Don’t start every new section or subsection on a new page in order to make the documentation appear longer. The goal of a dissertation is not to produce the thickest document possible, but rather to focus on good quality. If it looks like too much padding has been used, this may even reduce the final score of dissertation.
1.2 On LATEX:
The best software for writing papers, dissertations, theses, and books is LATEX. LATEX produces the
highest quality, most professional-looking output. See Kopka and Daly for an excellent LATEX reference
guide [5]. This is one reason why virtually all conferences and journals provide LATEX templates for
paper submissions. You can use the LATEX source from this guideline document if you think it would
help. Simply contact the author. Also, http://www.latex-project.org/is a great online-guide to LATEX.
1.3 Project Titles:
Regardless of the title of your dissertation, it will only be referred to using two to three words. For ex-ample, “Marching Cubes: A High Resolution 3D Surface Construction Algorithm” is referred to simply as‘ “The Marching Cubes” paper [18]. “Visual Analysis and Exploration of Fluid Flow in a Cooling
Jacket” is referred to as “The Cooling Jacket” paper [14]. On one hand the title of your project is
ide-ally simple enough such that it can easily be remembered and referred to with two or three words. On the other hand, a title is also long enough in order to convey some sort of meaning and description to the reader. This problem can usually be resolved using a title:subtitle combination, like in the case of Marching Cubes [18] (no pun intended).
2
Background
[included in the Initial Document, Interim Document (if updated), and Final Dissertation]
This section describes the research the author has done in order to prepare for the project. The back-ground section can be broken down into two sub-sections: (1) related work and (2) previous systems.
2.1 Related Work
The related work section demonstrates to the reader that you have done your homework (research), reviewed the previous literature, and now are ready to present your contribution based on what has been previously published.
One of the difficult aspects of the related work section is choosing the proper scope. There is some subjectivity in choosing which books or papers to refer to and also importantly, which previous literature not to refer to. This is something an advisor is able to help with. In short, each previous publication gets a one paragraph description.
We note that there is literature related to these guidelines [9, 11].
2.2 Citations
Any figure, image, equation, number, or year that is taken from another source must be cited. Content and terminology from other sources must also be cited. For more information about citations and their use, see:
http://www.plagiarism.org/. Click on the “How to cite sources” link.
When referring to previous work use names, not only numbers. So, instead of writing, “In [4], an algorithm for the creating of evenly-spaced streamlines is presented.”, write, “Jobard and Lefer present an algorithm for creating evenly-spaced streamlines [4].” The names are much more helpful to the reader than the numbers alone. Also, the previous literature was written by real people. Writing the names also shows a certain respect and appreciation for the previous work that numbers alone do not.
References should be accurate and complete, i.e., with page numbers etc. A paper without complete and correct references can leave a bad impression on the reader and detract from a dissertation or paper’s credibility. Errors can be interpreted as sloppy and can also be a sign of hastiness.
2.3 Previous Systems (or Similar Applications)
If you are building a piece of software, i.e., an application, then there’s a good chance that other closely-related applications already exist. This section describes those applications. For each previous system the following information is given:
1. the name of the system or application, 2. the URL of the system,
3. a screen shot of the application, and 4. which platforms the application runs on,
5. the duration time of the trial license, e.g., 30 days
6. a one or two paragraph description of the application including:
• why the application was written and • for whom (target users) it was written.
Note that each screen shot is accompanied by a caption, including a citation to the source of that screen shot, e.g., where the software comes from ( including company name, web page author, web page title, URL, and last access date, etc). Some examples are given in the references section of this document.
2.4 Data Characteristics
If your project processes a specific or important data set(s), then a description of that data is important. Some very helpful questions to answer are: Where does the data come from? Who produced the data? Why was the data collected in the first place? In other words, what are the fundamental questions (or knowledge) that we are trying to answer with the data?
A technical description of the data is also very helpful. What is the size (or resolution) of the data set? For example, how many samples does it contain? What is the range (minimum and maximum values) of the data samples? What are the characteristics of the data? Is it time-dependent? Is it abstract data or scientific data? Data is called “scientific” if every data sample has a given position in space, i.e., (x,y,z) coordinates. Abstract data has no position associated with its data samples, e.g., financial data describing stock transactions such as buying or selling. How big is the file that stores the data? What format is the data file in? Provide a complete description of the data file format.
3
Project Specification
[included in the Initial Document, Interim Document, and Final Dissertation]
The Project Specification Section is broken down into two sub-sections: the feature specification and technology choices.
3.1 Feature Specification
Recall the five stages of software development: (1) requirements specification, (2) software design, (3) implementation, (4) testing, and (5) documentation, for both programmers and users.
This section is all about stage one–documenting the requirement specification. The requirement specifi-cation describes the functionality of your system. What features is the software to have? What will it be capable of doing? The feature set is divided into two categories: (1) must-have features and (2) optional features. Must-have features are the minimum set of requirements the system must have in order to be useful whereas optional features are those that bring the level of the application up to outstanding qual-ity. Each feature in both the must-have and optional features sub-sections is presented in a numbered
(enumerated) list.
3.2 Technology Choices
This section outlines which tools and options are available for your implementation. Three basic deci-sions usually have to be made:
• Which programming language to use.
• Which GUI library to use. Some possible choices are
1. The Java Swing Library (free, cross-platform),
2. The Fox Toolkit (free, open-source, cross-platform) [27],
3. QT (cross-platform, both commercial and free, open-source editions available) [1, 25], 4. FLTK (free) [23],
5. GLUI (free) [20],
6. wxWidgets (free, cross-platform) [21], 7. wxWinows (free, cross-platform) [19], 8. GTK+ (open source, cross-platform) [24] etc.
One of these GUI libraries is suitable for your application for sure. There’s a very nice description of how to use the wxWindows library in chapter 18 of Horstmann [3]. (The wxWidgets library is formally known as wxWindows.)
• Which other (if any) libraries are used, e.g., OpenGL, DirectX, etc.
After describing the possible options, why you have chosen those options is given. The best tools are: (1) open source, (2) cross-platform, and (3) provide a forum in which to ask questions, e.g., a mailing list. It’s nice if the description of technology choices includes a screen shot of each GUI option.
4
Project Plan and Timetable
[included in the Initial Document, updated in the Interim Document, and Final Dissertation]
This section describes your project plan. The project is broken down into smaller tasks (divide-and-conquer) and these interim milestones are written down into a table. There may already be a series of deadlines outlined in your course handbook or project syllabus that can be included in the table:
1. initial project document deadline: Semester 1 Week 3, 2. presentation deadline: Semester 1, late November, 3. project review just before the Christmas holiday, 4. interim document deadline: Semester 2 Week 2, and 5. demonstration and viva deadline: Semester 2, Week 10.
These are the absolute minimum milestones. Then, each feature described in the Feature Specification Section (Section 3.1) is included in the table. See Table 1 for an example. The table describing the project plan and timeline can have three columns. In the first column is a number, in the second column is a description of the feature to be implemented and in the third column is a date by which the feature is to be implemented.
Sample Project Timetable
Description Date
1. Initial project presentation (Gregynog) 19 Nov 07 2. File Opener: User opens data file via the File menu 1 Dec 07 3. User is able to view a 2D graph of time (x-axis) vs amplitude (y axis). 8 Dec 07 4. project review just before the Christmas holiday, 15 Dec 07
5. etc... 15 Jan 08
Table 1: A sample table with interim deadlines in this project. The timeline is broken down week-by-week. For each week there is some measure of progress.
Construction of Table 1 is easy. Simply cut and paste each feature listed in the Feature Specification Section (Section 3.1) and place it under the description column in the table. Then add a completion date. Features that are too big to be completed in one week can be broken down into smaller pieces (sub-features). Sub-features can be accomplished within one to two weeks.
4.1 Time Management
We recommend working on your 3rd year project for approximately ten hours per week during your third year. The project is worth 40 credits, or 30% of your third year (at Swansea University). Also, the marks from your third year carry twice the weight as the marks from your second year. Thus the project can be thought of counting for 60 credits towards your final degree.
4.2 An Aside on Proofreading
In the ideal world, the dissertation is proof read by someone outside the project before submission to look for typographical errors. Fresh new eyes that don’t necessarily know the topic can be good for spotting these things, at least in our experience.
5
The Interim Document
The interim document, due the third Monday of semester two, summarizes the project’s progress up to that point in time. The goal of the interim document is to provide the reader a summary of progress
since the initial document. Conceptually, the interim document is an extension of your initial document.
However, if you submit something that looks too much like your initial document, you will not earn the 25% (formerly 30%) of the credit that this portion of your project is worth. Therefore, a table is included in your interim document stating exactly how it is different from your initial document. Table 2 shows an example.
Your table includes every section and subsection of your dissertation that has changed, been updated, or introduced (new sections and sub-sections) since the initial document. If a section has not changed, such as the Introduction, it is not included in the interim document. You may use the minutes of meeting
Summary of Interim Document Section Status
1. Introduction This section has been updated with corrections since initial document. 2. Background This section has been updated and expanded (since the initial document). 2.1 Related Work This section was updated and expanded to include new literature.
2.2 Previous Systems More previous systems were added.
3. Project Specification This section has been updated and expanded with more detail. 4. Project Design This is a new section (not featured in initial document). 5. Project Implementation This is another new section.
6. . . .
Table 2: A sample summary of the interim document indicating what has been done since the initial document was submitted.
notes as a history of the project because they document progress that has been made since the initial document [8].
The table of contents in this document indicates which sections are included in the initial document, interim document, and final dissertation. This is to be used as a very general guideline and can be customized to fit most projects. Also read the description of the interim document in your Computer Science Department’s Course Handbook.
The interim document also requires an updated time table. The time table shows your temporal plan for the remainder of the project. See Section 4 for a sample time table.
6
Project Design
[included in the Interim Document, and Final Dissertation]
This section corresponds to the second stage of the software development process [22]: software design. Your design is most likely object-oriented. The design starts with a list of classes and their responsibili-ties. This is a very important starting point (the list of classes and descriptions). It forces the programmer to start thinking about implementation. After identifying a list of candidate classes and writing a short description of each of them, e.g., 3–4 sentences, the list is reviewed with the project supervisor before proceeding onwards with the description of relationships between them.
6.1 Design Diagrams
The design also depicts the relationships between the classes through class hierarchies and collaboration diagrams. See also Laramee et al. [15] for some examples of this.
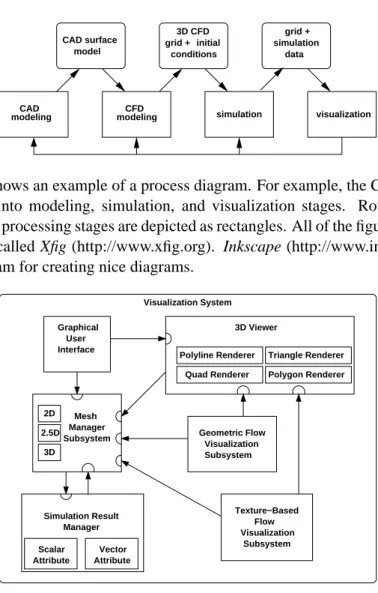
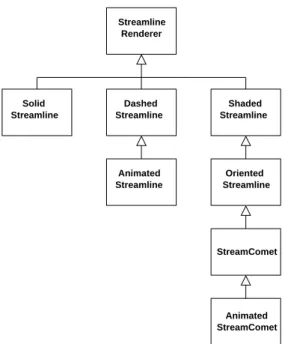
Some types of diagrams that can be included in your design are described here. (1) Process diagrams that show different stages of processing along with input and output data in between stages (Figure 1). (2) System diagrams that identify different sub-systems in your software design and the relationship between them (Figure 2). In modern, object-oriented software development, more time is spent on software design [28] in order to make software more robust, increase code re-use, facilitate maintenance, and make it easier to extend. The design of software is based on object-oriented methodology.
The design of your system can use the notation of Wirfs-Brock et al. [28]. An example is shown in Figure 2. A semicircle with an arrow pointing to it represents a contract. A contract is a subsystem or
visualization simulation CAD surface model modeling CFD 3D CFD grid + initial conditions grid + simulation data modeling CAD
Figure 1: This figure shows an example of a process diagram. For example, the CFD process is iterative and can be pipelined into modeling, simulation, and visualization stages. Rounded boxes represent input/output data while processing stages are depicted as rectangles. All of the figures in this section were made with a program called Xfig (http://www.xfig.org). Inkscape (http://www.inkscape.org) is another free and popular program for creating nice diagrams.
Simulation Result Manager Attribute Scalar Vector Attribute Geometric Flow Visualization Subsystem Texture−Based Flow Visualization Subsystem 2D 2.5D 3D 3D Viewer Triangle Renderer Polygon Renderer Polyline Renderer Quad Renderer Visualization System User Interface Graphical Manager Subsystem Mesh
Figure 2: This is an example of a software system showing some of its subsystems. This example shows a schematic of the design for a visualization system. Only the major subsystems are illustrated.
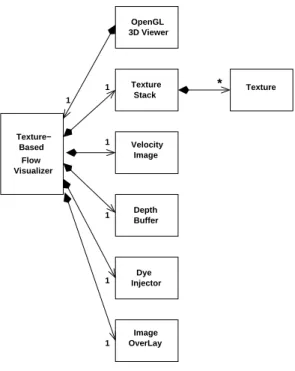
class interface with other classes or subsystems. It represents the set of services that a subsystem or class provides. Figure 2 illustrates the different subsystems and the relationships they have with one another. (3) Class hierarchy diagrams are also very useful (Figure 3). Figure 3 shows different streamline ren-dering options displayed in the class hierarchy in which they were designed and implemented. The hierarchy, following UML notation [2], illustrates the is-kind-of relationship between classes. At the top of the hierarchy we have an abstract base, Streamline Renderer that describes the behavior and contains the interface that all streamline rendering objects implement.
(4) Composition diagrams are also very useful (Figure 4). Figure 4 shows the class relationship be-tween the major components of a texture-based flow visualization subsystem, again using UML notation. However, rather than showing is-kind-of relationships as in Figure 3 we show composition, a variety of aggregation (is-part-of relationship). With composition, the part object (sub-component) may belong to only one whole. Furthermore, the parts are usually expected to live and die with the whole [2]. For exam-ple, the Texture Stack object is part of the Texture-Based Flow Visualizer object and the relationship is one-to-one. Furthermore, an instance of Texture Stack may be in an instance of Texture-Based Flow
Streamline Renderer Solid Streamline Dashed Streamline Animated Streamline Shaded Streamline Oriented Streamline StreamComet Animated StreamComet
Figure 3: This is an example of a class hierarchy diagram. This example is from a class hierarchy of streamline and geometric flow visualization options. UML notation is used.
Visualizer but not the other way around. This is indicated by the black diamond shape arrow.
6.2 Figures and Images
Diagrams may be created with free drawing packages called Inkscape (http://www.inkscape. org) or Xfig (http://www.xfig.org). Figures, images and their captions are “self-contained”. By self-contained, we mean that the reader is able to look at any figure or image, read its caption, and gain a basic understanding without having to read the main text. Enough details are provided in the caption such that the reader is not required to read the whole paper in order to understand an image or figure. Many readers will make a first pass through a document simply by flipping through the pages, looking at the images and captions, and already gain an impression. This first pass may already influence the reader’s opinion. If the reader appreciates the images and can gain an understanding of them from the captions, they may form a favorable first impression.
When a potential reader picks up any reading material, whether it be a newspaper, magazine, or book, they first flip through it to look at the pictures. If they find an interesting picture, they read the caption. If they find interesting pictures and captions, they may then go on to read the main text.
Pedagogic figures are good to include in your dissertation. The author will make their job easier if he makes all images, e.g., screen shots or frame buffer images, the same resolution, perhaps through a user setting. Also, a user setting that changes the background color to white is very useful. Images with a white background are best for papers in our opinion. We refer the reader to Tufte [26] for further stylistic guidelines.
Image OverLay Depth Buffer Image Velocity Injector Dye Stack Texture OpenGL 3D Viewer Texture Visualizer Based Texture− Flow 1 1 1 1 1 * 1
Figure 4: This is an example of a composition diagram. For example, the major components of the texture-based flow visualization design. Here aggregation, or is-part-of, relationships are shown.
7
Implementation
[started in the Interim Document and completed in the Final Dissertation]
Section 7 is the main content of the dissertation and thus occupies the most space. It is broken down into two sub-sections: the must-have features and optional enhancements.
7.1 Basic Implementation (Must-Have Features)
This section describes the must-have features implemented from the specification (Section 3) and how they were implemented. The implementation is based on your model from Section 6. The name of Section 3 could be the name of your system or algorithm (if it has a name, e.g. Image Space Advection (ISA) [17]). Section 7 can also be called simply Implementation.
Section 7 contains screen-shots of your application as well as accompanying descriptions. Some impor-tant questions to be addressed in this section are:
1. What are the different features and options your program offers? 2. How does the application work?
3. What data structures are used in the implementation?
4. Were there any features that were particularly difficult to implement? Why?
The reader then knows how your system (or algorithm) operates after reading this section. The reader is given enough detail such that they can operate or implement the system themselves.
7.2 Enhancements (or Extentions)
After the must-have features of your system are presented in Section 7 a follow-up Section may be added that includes enhancements or extentions to the must-have features. This section presents the optional
features that were first specified in Section 3. The must-have features describe the features that are necessary in order to get a passing note for your project. The extensions describe the features that are necessary in order to obtain a first (distinction) on the project.
7.3 Commenting Your Code
The source code of your project is documented according to the guidelines set forth in a separate doc-ument [10], a copy of which the reader asks for at the start of the implementation phase. For projects written in Java, javadoc can be used to comment the source code:
http://java.sun.com/j2se/javadoc
For projects written in just about any language, e.g., C++, Java, etc doxygen:
http://www.doxygen.org
may be used to comment the source code. Doxygen or javadoc is then used to produce HTML output of your code comments. Doxygen provides the added benefit of automatically generated diagrams [7]. This HTML output will be inspected by the project supervisor and whoever else may assess the project.
7.4 Coding Conventions
The source code of your project also follows the code commenting standards outlined in a separate docu-ment [10], a copy of which the reader asks for at the start of the impledocu-mentation. Following these coding conventions yields several important benefits including, but not limited to: (1) higher code legibility, (2) fewer bugs, (3) higher code quality, and (4) ultimately a better project. The source code of your project will actually be inspected to see if it conforms with the conventions. In the end, following these coding conventions raises the final score of your project.
8
Testing and Evaluation
[included in the Final Dissertation]
Evaluation is a very important part of your project (or any project). A very important question to ask right from the beginning is, “How is this project going to be evaluated?” Some important topics discussed in the evaluation are:
• Testing: How is your software going to be tested? What are the different test cases? What sources
of data will be used to test your system?
• Performance: How well does your application perform? How fast (or slow) is your application?
How memory efficient (or inefficient) is your algorithm or system?
8.1 Results
In this section, the nicest images of your system or algorithm are presented. Your system is applied to interesting data sets and the insight provided is described in addition to a concise description of the data sets. The characteristics of the test data sets is given. Some possible things to describe are:
1. Where did the data (what domain) come from?
2. How large the are the data sets? What is their resolution in the case of structured data? 3. What are the spatial and temporal dimensionalities of the data?
4. Is the data structured or unstructured?
5. It the data multiresolution or adaptive resolution?
Hopefully, you’ll be able to show your algorithm being applied to data sets from another domain, e.g., the visualization of simulation data, in order to demonstrate that your software actually works.
8.2 Performance Analysis
In most areas of computer science like visualization and computer graphics there’s always a trade-off between quality and speed (or memory and speed). Generally, the faster the performance, the lower the quality or the higher the memory requirements. The algorithm or system being presented likely has some free parameters that can be adjusted to trade off quality for speed and vice-versa or to trade off memory for performance and vice-versa. Essentially, every parameter whose value you are not sure of should be a user-defined parameter–an option that can actually be changed by the user at run time (not just compile time).
A table of performance times can report both aspects, optimized for speed, i.e., exploration mode, and optimized for quality, i.e., presentation mode. The best and most honest reports of performance times will show when the algorithm or system reaches its limits, e.g., when it starts to run slow due to perhaps large data sets. Algorithms also usually trade off memory for speed. In other words, faster algorithms often require more memory, basically because more calculations are pre-processed and stored.
If your project is on the subject of visualization, remember, visualization is used for analysis, explo-ration, and presentation. For presentation, the image quality must be at its highest, and thus performance probably at its slowest. The highest quality is used to generate the images for the paper, presentation, and videos. For exploration, the algorithms and systems are tuned for the fastest performance times possible. All optional enhancements may be turned off (unless your algorithm always runs at interactive frame rates).
See Laramee and Bergeron [13] and Laramee et al. [16, 17] for good examples of detailed performance analysis that trades off between performance and quality or memory and speed.
9
Conclusions
[included in the Final Dissertation]The Conclusions Section just summarizes the presented work and lists the resulting advantages. Remind the reader why the presented work is so good and what’s new. Basically, it’s like a concise, one page summary of the abstract and introduction sections.
10
Future Work
[included in the Final Dissertation]The future work section is about possible extentions to the presented work.
11
Turning in Source Code
[included in Final Dissertation]We recommend turning in your source code electronically when submitting your interim and final doc-uments. Your source code can be simply placed online, on your local computer science web server. As an example, instructions on how to do this at Swansea University are given on the CS 235 (Software Engineering) web page:
http://cs.swan.ac.uk/˜csbob/teaching/cs235-softEng/
All undergraduates have accounts created when they start at University. They may have access to their own web space on request. Requests are sent to the computer science technicians: cosit ‘‘at’’ swansea.ac.uk. Within their home directories they have a folder calledpublic html.
Any files/web pages they place there are available on the web and can be accessed from:
http://cos-ugrad.swansea.ac.uk/username
To create a directory inside your public html folder you can use these commands:
%> cd public_html %> mkdir myNewFolder
Where ”myNewFolder” is the name of the folder you would like to create. To copy a file into your public html folder you can use the command:
%> cp file.txt public_html
Where ”file.txt” is the name of a file you’d like to copy into your public html directory. Don’t forget to make files readable to everyone, e.g.,
%> chmod -R ugo+r *
Also, don’t forget to make any directories you create executable by everyone, e.g.,
%> chmod ugo+x myNewFolder
There’s a program called WinSCP (google ”WinSCP”) that enables you to transfer files to/from the CS web server from a Windoze machine. No instructions are provided on how to do that here. We only provide support for the use of the Linux machines. You are welcome to contact the CS technicians with questions (cosit ”at” swansea.ac.uk) concerning the use of any Windoze software.
The best possible thing a student can do is to place the doxygen HTML output onto their web server space [7, 10]. Don’t forget to include the link to your source code in your documentation. See Sec-tions 7.3 and 7.4 for more on this topic.
Some students turn in an electronic copy of their source code and application on CD at the end of their project. We do not recommend printing out your source code at any point since it wastes too much paper. Plus there’s no guarantee that anyone will look at it.
12
Acknowledgements
[included in the Final Dissertation]This section mentions any people that may have contributed in some way, e.g., with the implementa-tion or with discussions or feedback. It is tradiimplementa-tion to menimplementa-tion your advisor here at minimum. The Acknowledgements Section also thanks any agency or organization that may have contributed funding to the presented research, e.g., the EPSRC, KPlus, the NIH, the NSF, etc. An example of a long and complicated acknowledgements section can be found in previous work [6].
Thanks to Daniel O’Sullivan and Nicholas Hammett for providing the impetus behind these guidelines. These guidelines are the result of approximately four years of third-year project supervision in the Com-puter Science Department at Swansea University. We thank the following project students for their valuable discussions and input: Essam Farrag, Nicholas Hammett, Marc Harry, Daniel O’Sullivan. Matt Reid, James Walker, and Ho Yuen Wan. We especially thank Kingsley Hau and Ferdinand Vesely, for their careful proof-reading.
Questions, comments, suggestions for improvement, contributions to these guidelines, or any other feed-back is not only welcome but encouraged. If your department or organization uses these guidelines, we’d like to hear about it. Please contact Robert S. Laramee.
13
Appendix–BCS Accreditation
The following text is taken from from the Computer Science Departmental Handbook at Swansea Uni-versity.
Project Requirements
The following requirements for projects to be acceptable for BCS Accreditation is extracted from infor-mation supplied by the BCS. If you have any doubts as to whether your project meets the requirements please discuss it with your supervisor. For projects to meet the requirements for exemption, they must be passed at the first attempt to gain the award, with no condonement and no referral. All projects must involve a professional approach. The project should be real in the sense that the product is for users other than the author. The report should demonstrate an appropriate level of professional competence in the practical development of a suitable application, tool or similar product. The report on the project should include:
• elucidation of the problem and the objectives of the project;
• an in-depth investigation of the context / literature / other similar products; • a clear description of the stages of the life cycle undertaken;
• a description of the use of appropriate tools to support the development process; • a description of how verification and validation were applied at all stages;
• a critical appraisal of the project, indicating the rationale for design / implementation decisions,
lessons learnt during the course of the project, and evaluation (with hindsight) of the product and the process of its production (including a review of the plan and any deviation from it);
• in the case of group projects, a clear indication of the part played by the author in achieving the
goals of the project;
• references;
• appendices technical documentation.
The specific criteria applicable to projects acceptable for full exemption from the BCS Professional Examinations is that:
• it involves at least 150 hours of individual student effort;
• the task should be to develop an IT solution to a practical problem, which would include the
production of a piece of software (which may be interpreted as some or all of a specification, design or implementation of software);
• it exhibits a structured approach to information systems practice, involving a number of stages in
the life cycle;
• the product exhibits the attributes of quality, reliability, timeliness and maintainability; • it must involve the production of a professional report as described above;
• it must lead to a description of the process and of the product; • it must contribute significantly to the overall award classification.
References
[1] J. Blanchette and M. Summerfield. C++ GUI Programming with Qt 3. Prentice Hall in associate with Trolltech Press., Upper Saddle River, New Jersey 07458, 2004. Bruce Perens’ Open Source Series (free for download).
[2] M. Fowler. UML Distilled: A Brief Guide to the Standard Object Modeling Language. Object Technology Series. Addison-Wesley, third edition, September 2003.
[3] C. Horstmann. Computing Concepts with C++ Essentials. Wiley, 3 edition, 2003.
[4] B. Jobard and W. Lefer. Creating Evenly–Spaced Streamlines of Arbitrary Density. In Proceedings of the Eurographics Workshop on Visualization in Scientific Computing ’97, volume 7, pages 45–55, 1997. [5] Helmut Kopka and Patrick W. Daly. A Guide To LaTeX. Addison–Wesley, 4 edition, 2004.
[6] R.S. Laramee. Interactive 3D Flow Visualization Using Textures and Geometric Primitives. PhD thesis, Vi-enna University of Technology, Institute for Computer Graphics and Algorithms, ViVi-enna, Austria, December 2004. (available online).
[7] R.S. Laramee. Bob’s Concise Introduction to Doxygen. Technical report, The Visual and Interactive Com-puting Group, Computer Science Department, Swansea University, Wales, UK, 2007. (available online). [8] R.S. Laramee. Bob’s Minutes of Meeting Protocol. Visual and Interactive Computing Group, Department of
Computer Science, Swansea University, 2007. (available online).
[9] R.S. Laramee. How to Write a Visualization Research Paper: The Art and Mechanics. In Eurographics Education Papers 2009, pages 59–66. Eurographics, 2009.
[10] R.S. Laramee. Bob’s Concise Coding Conventions (C3
). Advances in Computer Science and Engineering (ACSE), 4(1):23–26, 2010. (available online).
[11] R.S. Laramee. How to Write a Visualization Research Paper: A Starting Point. Computer Graphics Forum (CGF), 29(8):2363–2371, 2010. (available online).
[12] R.S. Laramee. Bob’s Project Guidelines: Writing a Dissertation for a BSC. in Computer Science. Innovation in Teaching and Learning in Information and Computer Sciences (ITALICS), 10(1):43–54, February 2011. (A publication of the UK Higher Education Academy (HEA), available online).
[13] R.S. Laramee and R.D. Bergeron. An Isosurface Continuity Algorithm for Super Adaptive Resolution Data. In Advances in Modelling, Animation, and Rendering: Computer Graphics International (CGI 2002), pages 215–237. Computer Graphics Society, Springer, July 1-5 2002.
[14] R.S. Laramee, C. Garth, H. Doleisch, J. Schneider, H. Hauser, and H. Hagen. Visual Analysis and Exploration of Fluid Flow in a Cooling Jacket. In Proceedings IEEE Visualization 2005, pages 623–630, 2005.
[15] R.S. Laramee, M. Hadwiger, and H. Hauser. Design and Implementation of Geometric and Texture-Based Flow Visualization Techniques. In Proceedings of the 21st Spring Conference on Computer Graphics, pages 67–74, May 2005.
[16] R.S. Laramee, B. Jobard, and H. Hauser. Image Space Based Visualization of Unsteady Flow on Surfaces. In Proceedings IEEE Visualization ’03, pages 131–138. IEEE Computer Society, 2003.
[17] R.S. Laramee, J.J. van Wijk, B. Jobard, and H. Hauser. ISA and IBFVS: Image Space Based Visualization of Flow on Surfaces. IEEE Transactions on Visualization and Computer Graphics, 10(6):637–648, November 2004.
[18] W. E. Lorensen and H. E. Cline. Marching Cubes: a High Resolution 3D Surface Construction Algorithm. In Computer Graphics (Proceedings of ACM SIGGRAPH 87, Anaheim, CA), pages 163–170. ACM, July 27–31 1987.
[19] M. Neifer. Looking Through wxWindows. http://www.ibm.com/developerworks/library/l-wxwin.html [March 2009].
[20] P. Rademacher and N. Stewart. GLUI User Interface Library. http://www.cs.unc.edu/˜rademach/glui/ [De-cember 2007].
[21] J. Smart. wxWidgets. http://www.wxwidgets.org/ [February 2008].
[22] I. Sommerville. Software Engineering. Addison-Wesley, London, 8 edition, 2007.
[23] B. Spitzak. The Fast, Light Toolkit (FLTK). Easy Software Products. http://www.fltk.org/ [December 2007]. [24] The GTK+ Team. The GTK+ Project. The GNOME Foundation. http://www.gtk.org/ [January 2009]. [25] Trolltech. QT. Trolltech ASA. http://trolltech.com/products/qt [December 2007].
[26] E. R. Tufte. The Visual Display of Quantitative Information. Graphics Press, 1983. [27] Jeroen van der Zijp. The Fox Toolkit. http://www.fox-toolkit.org [December 2007].