is licensed University of Babylon
by
Journal of University of Babylon for Engineering Sciences
. Creative Commons Attribution 4.0 International License under a
69
Control of Boundary Layer over NACA0015 Using Fuzzy
Logic by Suction Technique
Yasser Ahmed Nazhat Saeed Basmah. T.dawod
Department of Electromechanical Engineering University of technology/Technology
[email protected]
Submission date:- 9/7/2018 Acceptance date:- 7/8/2018 Publication date:- 11/10/2018
Abstract
Re-attachment the separation of boundary layer using suction method is one of the important techniques, which improve the flow over bodies. This study focused on the design of fuzzy logic controller to control on the separation of the boundary layer, using suction delayed separation technique from the surface of NACA 0015 airfoil. The airfoil was designed and fabricated depending on the airfoil tool with (300x300) mm chord and span length respectively. The upper surface was developed with five holes 6mm diameter to suck the delayed boundary layer along the span of the airfoil about 75% from leading edge . Also there are four BMP180 Piezoelectric pressure sensors distributed with constant pitch on upper surface of model used to sense the pressure difference. Sub sonic wind tunnel with (300x300x 600) mm work section is used. (1.354, 1.915, 2.345, 2.708 and 3.028 x 10⁵) Reynolds numbers and (0o, 3o, 6o, 9o, 12o, 15o, 16o and 17o) are the angles of attack were used as a conditions boundary of the experimental work. The model was tested without applying suction to determine the stall condition. Pneumatic vacuum cleaner with (0.00737 to 0.01329) discharge coefficient range was used to perform the suction experiment. Pressure difference and angle of attack were input of fuzzy logic controller which programmed by using commercial Matlab softwar. The results of applying suction showed an increase of 14.72% in the lift coefficient and increase the stall angle from 15o to more than 17o. Also lift/drag ratio increased when angle of attack increased. Fuzzy logic rules gave steady enhancement at range of suction coefficient CQ universally acceptable.
Keywords: NACA0015, Suction, Fuzzy logic, Piezo electric, Controller, Boundary layer.
Nomenclature
CL= lift coefficient Cd= drag coefficient
CQ = coefficient of suction (Q/ U∞ S) U∞ = free stream velocity (m/s) Q = tunnel flow rate (m3/s). S= airfoil surface area AOA= angle of attack Re = Reynolds number Cd = discharge coefficient ρ = air density
70
1. Introduction
Boundary layer is a thin layer of fluid that shows the effects of viscosity and is closed to the boundary surface. The boundary layer over a surface of boundary continuous in the growing as long as the gradient of pressure equals zero along the surface. The thickness of boundary layer increases severely when pressure gradient is reversed. Also this adverse gradient of pressure and shearing forces (due to viscous) tends to decrease the momentum in the boundary layer, and if any of these factors continues in influence along a certain length of the surface, the growth of boundary layer is stopped. This is called separation, and to avoid separation over an airfoil reattached or energise the boundary layer at halted regions must be achieved. If this performed boundary layer remain thin a drop pressure at the rear of the airfoil prevented, and subsequently, the drag coefficient decreases then lift increases .There are quite a few strategies and methods that have been followed or invented to minimize the effects of boundary layer separation. Fig. (1) shows the flow control strategy. All of these techniques and other which are used to improve the aerodynamic characteristics by energize of boundary layer in the stall region [1], [2]. Efforts and studies of previous researchers in the invention and improvement the methods that delay or preventing the separation of boundary layer from the upper surface of wings, have been touched in this study: Kuok -Yang Tu, et al . applied the fuzzy modelling for nonlinear boundary layer in design of a new fuzzy suction controller, and devoted this process to solve the chattering problem which usually occurred from a sliding- mode controller (SMC) system in unstable situations that system states cross over a switching line [3].M. Goodarzi, et al. studied the principle of active flow controlling by blowing air from slot with (25%) of chord length width, made on the upper surface of NACA0015 airfoil act as fixed blowing jets at different location along the chord. Boundary condition were (Re=45500), attack of angle changed into six times from (12 to 17) degree, and jet speed ratios are (1, 2 and 6 time of free stream velocity). The important results were blowing help in increasing the lift and decreasing the drag coefficient [4]. You and Moin investigated the flow separation by artificial jets on an NACA 0015 aerofoil by using Large Eddy Simulation way. Results given that coefficient of lift (CL) increased by 70% and the coefficient of drag decreased 18 % while flow separation control parameters were changed [5]. Munzarin Morshedinvestigated the drags and lift analysis of four different models, which were cylinder, NACA0015 airfoil and NACA 4415. Three profiles tested at different attack angles and Reynolds number. The range of AOA was (-3o to 18o with 3 degree step for airfoil, while from 0o to 180o for cylinder and sphere with 10o step). All profiles test in the subsonic tunnel at same range of Reynolds (1.4, 2.3, 3 and 3.8 x 10⁵).The important results were obtained drag coefficient depend on the shape. Cambered airfoil exhibit high lift coefficient and lower drag than the other profile [6].Abzalilov et al. investigated on suction theoretical solution by Inverse boundary-Value problem [7].Z. Wang and I. Gursu. studied the influences of post stall of attack angles on the lift enhancement, by using suction method from the top surface of thin flat plate. Various suction sites were applied from leading edge. All experiments were performed in the sub sonic tunnel with low Reynolds number at different suction flow rate coefficient. The authors found: lift improving and delays the stall can be performed when post-stall AOA generate large bubble separation by re-contact the colossal separated flow close the trailing-edge. xs/c = 0.4, represents optimal location of suction that gives the greatest lift coefficient, when the coefficients of suction lower than 3%. Also when applying the suction near the leading-edge, it might be facilitate to reattach the stream for small coefficients of suction, but this leading to small increase in the lift due to generate small bubbles of separation[8]. SS Baljit et al. applied blowing and suction techniques to improving the aerodynamic features of an airfoil, by reattached the boundary layer at separation site by suction the delayed boundary layer or blowing air to empower the boundary layer. Tested model was NACA 0012 in subsonic wind tunnel. Both the experiment were experienced at the position of 25% from the length of chord at (1.2x 10⁵) Reynolds number. Lift force is produced from a pressure variation between the pressures acting in top and lower surfaces. The significant results was the blowing and lift processes proved their capability to improve the aerodynamic features of NACA0012 [9]. Ralf Messing and Markus J. Kloker. advanced direct numerical simulation study of suction of liminal flow control of 3D boundary layer and investigated the effects of decrease the suction holeson the disturbance evolution in laminar three-dimensional of flat plate. Numerous suction holes can stimulate unbalanced cross flow (CF) styles even if the hole spacing is lesser than the chord wise, span wise wavelengths of unbalanced styles, caused by inadequacies in the hole order or suction strength boundary-layer flows with beneficial pressure gradient.It has been found that the most unstable steady vortex mode leads to strong CF vortices that invoke turbulence by secondary instability even on the active suction panel [10].
71
Objectives
This study aims to:
Using suction methods to control the separation of boundary layer of NACA0015.
Using the smart material (PEZIO ELEC) and arduino to detect the separation control boundary layer.
Using fuzzy logic controlling to simulate the system. Improve the lift to drag ratio and robustness electric system
Fig. (1): Possible Flow Control Strategies [2].
2- Control of Boundary Layer by Suction Method
Boundary layer suction, in which the part of boundary layer with less momentum at the surface of wing is extracted. Extraction process is done by sucking the part that is stopped, by either holes located on the wing surface or perforated channel or tube fixed along the span of wing. See fig. (2). Location of the sucking tube depends on the value of the angle of attack (AOA). There are two cases to apply sucking technique, one is delay separation, and other is to postpone transition. In the first case, prevent the growing of boundary layer and keeping it attached the boundary surface, by sucked a part of the turbulent layer, therefore the separation will prevent. Once this happened, it becomes possible to fly with higher angle of attack and lower speeds. This technique may be desirable to reduce the separation from the surfaces of fast vehicles to decrease the size of wake. The estimated fuel efficiency improvements as high as 30% when used this technique. In the current study first case of suction is applied, suction process is performed by absorption air through trailing edge perforated tube by sucker [11], [12].
72
Fig. (2): Schematic Representation of Boundary Layer Suction [11]
3- Smart Material
Smart materials are defined as those that show a link between multiple physical fields. Common examples of these materials are those whose electrical signals can be converted into mechanical movement and the mechanical movement is converted to electrical current [12]. There are other materials whose thermal energy can be converted to a voltage Mechanical, and transform the pair of movement of chemical species within the material into mechanical output or electrical signals. Based on an understanding of the basic physical properties of different types of materials. In the present paper it is developed mathematical models of these smart materials and then integrate these models into engineering systems analysis. There are numbers of smart materials: piezoelectric, shape memory alloy, electrostrictive materials, magnetostrictive materials, electro- reheological (ER) fluid, magneto – rheological (MR) fluids, fiber optic sensors and micro electro –mechanical systems (MEMS). The smart material used in this work is piezoelectric as pressure sensors to detect the different of pressure between free stream and the surface of wing [13], [14].
4-Piezoelectric
Piezoelectric is a phenomenon in smart material using piezoelectric. The function of the piezoelectric is converts the mechanical energy into electrical energy and vice versa .It is elements of intelligent structures. Capable of predicting the response of structural member at given voltage applied to the actuators and providing guidance on optimal location. Inexpensive and more easily fabrication. Structural material, distributed actuators and sensors, control strategies, and power conditioning electronic [15]. There are many types of piezoelectric are used in numerous applications such as. Patch actuator
Macro Fiber
Composite (MFC) actuator Stack actuators
5-Arduino
It is an electronic development board consisting of an open source electronic circuit with a microcontroller on a single board programmed by computer designed to make the use of interactive electronics in multidisciplinary projects easier. Different types of sensors (eg). Temperature, pressure, velocity etc...) Can be connected to Arduino also Arduino is connecting to various programs on the Pc (personal computer) [15].
6- Objectives
Using suction methods to control the separation of boundary layer of NACA0015.
Using the smart material (PEZIOELECTRIC) and Arduino to detect the separation control boundary layer.
Using fuzzy logic controlling to simulate the system. Improve the lift to drag ratio and robustness electric system.
73
6-Experimental Work
6.1 Design and Fabrication of Model Test
The section of wing chosen in the current study was NACA 0015 (symmetrical cross-section with a t/c ratio of 15% with 0% the percentage of camber) with (300mm) chord length and (300mm) span length. Fig. (3) Shows the section of NACA 0015 plotted by importing the data from online airfoil tool. Mat lab program was applied to resize the scale of model. Then printed on the cardboard to make airfoil replica, which used to manufacture the wood frame. Aluminium sheet with 1mm thickness used to cover the frame. Four BMP180 sensors distributed along the chord with constant pitch, each sensor was fixed on the 1.5mm diameter to sense the difference of pressure to determine the separation point. Also upper surface of model includes five ports with 6mm diameter distributed along the span at 75% from leading edge for suction process. To fix the model in the wind tunnel hollow shaft with12mm was fixed on the wood side of model. Opposite side, contain suction tube see fig. (4).
Fig. (3): NACA0015 Profile
a b
c d
Fig. (4): Testing Model. (A) Cutting Section Of NACA 0015 airfoil, (B) Fastened the Section with Long Studs, (C) Fixing the Pressure Sensors; (D) Test Model Was Utilized in the Enhancement
74
6.2 Wind Tunnel
Fig. (5) Shows the subsonic wind tunnel used in this study which has (300x 300x 600) mm work section. Tunnel work with range of air speed between (0) and (36) m/s, it is developed with pilot static tube at the entrance of section to measuring the difference between the static and dynamic pressures to determine the air velocity by:
𝑣 = √2𝑥 9.81∆ℎ
𝜌𝑎 … … … . . ( 1)
Δh = difference between stagnation &static pressure in (mmH
2o), V= velocity
(m.s
-1).
Experimental side is divided into two parts; the first is testing the model without suction at difference Reynolds number and AOA to determine the stall condition. Then conducting the test by using fuzzy logic controller to control on the suction process at the same condition of the first part.
Fig. (5): Subsonic Tunnel
6.3 Fuzzy Logic Control System
Control system as illustrated in fig. (6) Consists of the important electronic parts is
utilized to build the fuzzy logic control circuit detail below:
75
-Pressure sensors: Eight pressure sensors type BMP180 utilized to deduct the variation of the pressure in the current experiment. Two of these pressure sensors fixed on the Pitot - static tube utilized to gauge the stagnation and static pressures at the tunnel entrance. To determine the stall four BMP180 were distributed on the upper surface along the chord by deducting the pressure difference between fourth surface sensors and the sensor fixed on the upper wall of tunnel section. Determining the angle of attack (AOA) obtained by one of the fourth sensors and sensor fixed on the side wall of tunnel section. Fig (7) illustrates the BMP180 pressure sensors.
Fig. (7) BMP180 Pressure Sensor.
-Arduino
: UNO type used as a microcontroller circuit was programed by C-language to
control the speed of sucker motor see fig. (8).
76
Fig. (8): Arduino UNO Type.
-
Servomotor: 180-degree servomotor is to control on the suction speed. The rotor of the servomotor is engaged by small coupling with knob of fan variac that joined in series with vacuum cleaner motor to work as voltage regulator, which in turn controlled the cleaner motor speed. Fig. (9) Shows the 180-degree servo motor.
Fig. (9):180 Degree Servo Motor.
- Sucker: vacuum cleaner with kW is utilized to create sufficient vacuum inside the aioli. The discharge through the hole is governed by the vacuum magnitude, which in turn relates with the speed of cleaner motor. Discharge of air through the holes and the manifold of vacuum cleaner measured by orifice meter which has (0.64) discharge coefficient and the diameter ratio was ( 𝐷2𝑢𝑝𝑠𝑡𝑟𝑎𝑚
𝐷2𝑑𝑜𝑤𝑛𝑠𝑡𝑟𝑒𝑎𝑚= 0.2). Fig. (10) Shows the orifice meter with adapter.
77
𝑄 = 𝐶𝐹 × 𝐴𝑜√
∆𝑝
𝜌 … … … . . (2)
Where Q=airflow rate, Δp = manometer reading, Ao = downstream area, CF = orifice flow coefficient, ρ = density of air.
6.4 Experimental Test without Enhancement
This procedure was very important to determine the position of separation and the
magnitude of lift and drag forces. The range of tunnel speed or free stream speed (U
∞) used in
the current research were (7.062, 9.988, 12.232, 14.1253 and 15.7926 m/s) for each angle of
attack (AOA). Eight angles of attack (0
o, 3
o, 6
o, 9
o, 12
o, 15
o, 16
o, 17
o) were used in this study.
Select this range of AOA to extend the separation-scanning zone and to extend the
empirically acquired knowledge that used in the fuzzy logic design.
6.5 Enhancement the Lift and Drag of NACA0015 by Controlled Suction
Same range of tunnel speed and angles of attack (AOA) were used in this test for comparison between the two cases. Suction was applied by using vacuum cleaner to draw the delayed boundary layer from the surface of model. Fuzzy logic was used to program the suction controller. It is be noted that pressure difference (ΔH) measured by pitot static tube reading at tunnel entrance used as fuzzy input instead of free stream speed (U∞). (3, 6, 9, 12 and 15 mm H2O) range of pressure difference. The fuzzy logic steps were used to control system explained bellow:
7-Fuzzy Inference System
Mamdani fuzzy inference system was adopted in this paper with two input variables, ΔH and AOA (degree) and one output. ΔH has three triangular membership functions in range [9 -15] mm whereas the AOA (degree) has seven triangular membership functions in range [3 -17] degree. The output was volumetric flow rate of air that is produced by a vacuum cleaner, which causes a suction effect on the airfoil (NACA 0015). It was with six triangular membership functions in range [38- 53] m3/h. The Fuzzy inference system was having twenty-one rules. The method was 'minimum', the defuzzification method was 'centroid', the implication method was 'minimum', and the aggregation method was 'maximum the following figures show the adopted fuzzy inference system. Figs. (11), (12) show the member shape function of the input variable of difference head (ΔH) and angle of attack (AOA). Fig. (13) Illustrates the member shape function of output variable (Q- vacuum cleaner).
Fig. (11): The Membership Functio
ns of the Input Variable (ΔH).
78
Fig. (13): The Membership Functions of the Output Variable (Q-vacuum cleaner).
Rules of fuzzy inference system was chosen by making many practical experiments. Two guides were taken to achieve the enhancement, the first made gradual enhancement (with the change in velocity or AOA) the second was the CQ coefficient not to be exceeded . The CQ coefficient was calculated by dividing the volumetric discharge of vacuum cleaner (Q) by (U∞ x surface area of wing). In this study CQ was not exceed 0.0133.The volumetric discharge of vacuum cleaner was calculated by using orifice meter with (Ao = 0.0002769 and Cf =0.64 which represented the downstream area and flow coefficient respectively) by the following formula. Table (1) represents the fuzzy logic rules were used in the program of controller. Fig (14) indicates the Simulink of the open loop fuzzy control system.
Table (1): Shows the Rules of Fuzzy Inference System.
Fig. (14): The Simulink of Open Loop Fuzzy Control System.
8-Results and Discussion
8.1 The Results of Experiment without Suction
Table (2) shows the lift force and drag force were measured by single force balance, that act on the NACA0015 at different Reynolds number and AOA This test was conducted to find the aerodynamic features of NACA0015.
AOA (degree) ΔH (mm) VVL VL L M H VH VVH L VL VL VL L L M M M L L L M M H VH M M H H VH EXTH EXTH
79
Table (2): Lift Force and Drag Force Results.
8.2 Effect of the Attack Angles on the Coefficient of Lift of NACA0015 without Suction
Coefficient of lift values (CL) and coefficient of drag (Cd) are listed in table (3). Where (0.09 m2) is the area of profile and its constant for lift and drag and (ρ =1.18 kg/m3) also fixed for all experiments. Fig. (15) illustrates the influence of attack angle (AOA) on the coefficient of lift (CL) for NACA0015 aerofoil. There is a gradually increase in the CL values when increasing the value of AOA and Re number until the value of attack angle approaches from 15o.There is a significantly increase in CL values at all values of Re numbers, after this value of AOA. Lift coefficient decreased and stall condition appeared. The maximum value of lift coefficient was recorded at AOA (15o) and Reynolds number (3.028 x10⁵).
Table (3): Lift and Drag Coefficient Results.
AOAO Re x 105 FL In (N) Fd In (N) CL Cd CL/Cd 0 1.354 0 0.0217 0 0.00819 0 1.915 0 0.0423 0 0.00799 0 2.345 0 0.06 0 0.00754 0 2.708 0 0.077 0 0.0073 0 3.028 0 0.086 0 0.0065 0 3 1.354 0.03 0.033 0.0113 0.0124 0.9113 1.915 0.075 0.0765 0.0146 0.0114 1.2807 2.345 0.236 0.09 0.03 0.011356 2.641 2.708 0.615 0.12 0.06 0.0113 5.31 3.028 0.954 0.15 0.074 0.01129 6.554 6 1.354 0.191 0.0362 0.0746 0.013687 5.45 1.915 0.432 0.072 0.084 0.01354 6.203 2.345 1.1937 0.107 0.155 0.01352 11.464 2.708 1.834 0.142 0.179 0.013426 13.332 3.028 2.6125 0.174 0.204 0.01312 15.548 9 1.354 0.548 0.0645 0.207 0.02481 8.343 1.915 1.282 0.129 0.242 0.02436 9.754 AOAo Re x 105 FL in (N) Fd in (N) AOAo FL in (N) Fd in (N) 0 1.354 0 0.0217 12 0.612 0.0992 1.915 0 0.0423 2.351 0.198 2.345 0 0.06 4.368 0.283 2.708 0 0.077 5.984 0.377 3.028 0 0.086 9.011 0.45 3 1.354 0.03 0.033 15 0.855 0.1522 1.915 0.075 0.0765 2.768 0.306 2.345 0.236 0.09 7.847 0.448 2.708 0.615 0.12 11.6854 0.5902 3.028 0.954 0.15 16.39 0.7062 6 1.354 0.191 0.0362 16 1.0714 0.18 1.915 0.432 0.072 3.624 0.3746 2.345 1.1937 0.107 8.313 0.5646 2.708 1.834 0.142 11.516 0.7322 3.028 2.6125 0.174 16.155 0.8888 9 1.354 0.28 0.0645 17 1.351 0.19334 1.915 1.241 0.129 4.716 0.3856 2.345 2.64 0.190 8.374 0.5936 2.708 3.686 0.254 11.4 0.7504 3.028 4.804 0.309 16.01 0.92
80
2.345 2.64 0.190 0.343 0.023964 14.313 2.708 3.686 0.254 0.36 0.023982 15.011 3.028 4.804 0.309 0.375 0.02334 16.067 12 1.354 1.001 0.0992 0.378 0.03752 10.07 1.915 2.583 0.198 0.4876 0.0373 13.072 2.345 4.368 0.283 0.569 0.0353 16.119 2.708 5.984 0.377 0.584 0.0356 16.404 3.028 9.0111 0.45 0.704 0.03397 20.724 15 1.354 1.542 0.1522 0.687 0.0575 11.948 1.915 4.274 0.306 0.807 0.0576 14.01 2.345 7.847 0.448 0.9876 0.0564 17.51 2.708 11.685 0.5902 1.103 0.05572 19.795 3.028 16.39 0.7062 1.238 0.05334 23.21 16 1.354 1.882 0.18 0.7107 0.0684 10.39 1.915 4.755 0.3746 0.8976 0.07068 12.7 2.345 8.313 0.5646 1.075 0.07108 15.124 2.708 11.516 0.7322 1.087 0.06912 15.726 3.028 16.155 0.8888 1.22 0.06712 18.176 17 1.354 1.825 0.19334 0.689 0.073 9.438 1.915 4.595 0.3856 0.8675 0.07264 11.942 2.345 8.374 0.5936 1.054 0.07472 14.106 2.708 11.4 0.7504 1.076 0.07084 15.12 3.028 16.01 0.92 1.209 0.06934 17.436Fig. (15): Effect of AOA on the Lift Coefficient (C
L).
8.3 Effect of the Attack Angles on the Coefficient of Drag of NACA0015 without Suction.
Figure (16) indicates that the increase AOA values leads to increase the drag coefficient this is can be attributed to the increase of projected area that facing the stream of air. After AOA (10o) the drag coefficient increased surprisingly and showed the stall conditions at AOA approximately at (150 ). As for the variation of the drag coefficient (Cd) with Re- number of NACA 0015 shown in the fig. (17). Slight decline existed in the values of coefficient of drag, whenever Re- number of air was increased at each attack angle (AOA), the cause of this behaviour due to the rise of the air speed. Fig. (18) illustrate the influence of the attack angle (AOA) on the L/D ratio. Maximum L/D ratio was (23.208) achieved at (AOA =150) and (Re =3.028 x 10⁵) and minimum value was (0) at (AOA =00) because there was no lift at this attack angle.
0 0.2 0.4 0.6 0.8 1 1.2 1.4 0 5 10 15 20
C
LAOA
Re = 1.354 x10^5 Re = 1.915 x10^5 Re = 2.345 x10^5 Re = 2.708 x 10^5 Re = 3.028 x10^581
Fig. (16): Variation of Drag Coefficient with AOA without Suction at Different Reynolds
Number.
Fig. (17): Variation of Drag Coefficient with Re- Number at Different AOA without
Suction
Fig. (18): Lift to Drag Ratio vs. AOA at Different Reynolds Numbers
0 0.02 0.04 0.06 0.08 0.1 0 5 10 15 20
C
dAOA in dgree
Reynolds=1.354 e05 Reynolds =1.915 e05 Reynolds = 2.345 e05 Reynolds = 2.708 e05 Reynolds = 3.028 e05 0 0.01 0.02 0.03 0.04 0.05 0.06 0.07 0.08 1 1.5 2 2.5 3 3.5C
dRe- number (10^5)
AOA = 0 AOA =3 AOA = 6 AOA =9 AOA =12 AOA =15 AOA= 16 AOA =17 0 5 10 15 20 25 0 5 10 15 20C
L/C
dAOA in degree
Reynolds = 1.354 e05 Reynolds = 1.915 eo5 Reynolds =2.345 e05 Reynolds = 2.708 e05 Reynolds =3.028 e0582
8.4 The Results of Enhancement of Experiment According to Fuzzy Logic Rules.
Table (4) shows the general results of enhancement process of NACA0015 airfoil by using suction strategic. Suction of delayed boundary layer was conducted for three values of Reynolds number range (2.35, 2.708 and 3.028 x 10⁵) due to the passive results that be obtained when using lower range of Re – number on the other means due to the degradation in the lift forces for this low range of Re (1.354 and 1.915 x10⁵) was neglected. Pneumatic vacuum cleaner at different suction coefficient (CQ) depending on the fuzzy logic control rules used as a sucker. Table (5) illustrates the values of (CQ, Qv and Qt) suction coefficient, suction flow rate of sucker and tunnel flow rate respectively. The coefficient of discharge CQ was affected by the Re- number, it increased with decreasing Re- numbers. Maximum CQ was (0.01329) achieved at (Re = 2.345 x10⁵) and minimum was (0.00737) at (Re = 3.028 x 10⁵). Table (6) shows the improvement in the lift coefficient according to fuzzy logic rules
Table (4): Results of Enhancement Experiment.
Table (5): Discharge Coefficient and Flow Rate of Tunnel and Sucker
Re x 105 V (m/s) Qt In (m3/s) Qv min In (m3/s) Qv max In (m3/s) CQ min CQ max 2.345 12.232 1.1 0.0104 0.0146 0.00951 0.01329 2.708 14.125 1.271 0.0104 0.0146 0.00824 0.01151 3.028 15.792 1.421 0.0104 0.0146 0.00737 0.01029
Table (6): Represents the Improving in the C
LValues According to Fuzzy Rules.
AOA Re X 105 3 6 9 12 15 16 17 2.345 VL=0.173 VL=0.27 VL=0.33 L=0.45 L=0.65 M=0.73 M=0.745 2.708 L=0.241 L=0.378 L=0.779 M=1.2 M=1.35 H=1.376 VH=1.38 3.028 M=0.281 M=0.471 H=0.805 H=1.234 VH=1.34 EXTH=1.36 EXTH=1.387 AOA Re x 105 FL In (N) Fd In (N) CL Cd CL/Cd 0 2.345 0 0.0467 0 0.0058 0 2.708 0 0.0603 0 0.0057 0 3.028 0 0.0671 0 0.00507 0 3 2.345 1.323 0.0704 0.173 0.0088 19.192 2.708 2.55 0.0933 0.241 0.0088 27.23 3.028 3.73 0.116 0.281 0.0088 31.91 6 2.345 2.102 0.0837 0.27 0.0105 25.603 2.708 4.00 0.11 0.378 0.0104 3.6095 3.028 6.243 0.132 0.471 0.0102 46.0248 9 2.345 2.569 0.148 0.33 0.0187 17.654 2.708 8.253 0.1981 0.778 0.0187 41.591 3.028 10.66 0.482 0.804 0.0182 44.163 12 2.345 3.503 0.22 0.45 0.0277 16.205 2.708 12.74 0.279 1.202 0.0265 45.364 3.028 16.34 0.37 1.234 0.028 44.071 15 2.345 5.061 0.35 0.65 0.044 14.775 2.708 14.27 0.46 1.347 0.043 30.993 3.028 17.74 0.55 1.34 0.041 32.207 16 2.345 5.683 0.4282 0.73 0.054 13.54 2.708 14.578 0.554 1.376 0.052 26.282 3.028 18.01 0.754 1.36 0.057 23.885 17 2.345 5.8 0.463 0.745 0.058 12.783 2.708 14.62 0.584 1.38 0.055 24.975 3.028 18.142 0.715 1.387 0.054 25.644
83
8. 5 Effect the Suction Process on the Lift and Drag Coefficient.
Figures (19), (20) and (21) represent the relation between the lift coefficient (CL) with angles of attack (AOA) at different Re- number and various range of suction coefficient (CQ). Suction was worked according to fuzzy logic rules as shown in table (6), which control the vacuum cleaner motor speed in turn control on the suction rate. Suction strategic gave higher increase in the CL values than the CL values, which were obtained when testing the model without suction at all angle of attack and Re - numbers. Lift coefficient CL also played a vital role in determining the efficiency of an airplane wing. Maximum increasing in CL was (14.7%) verified when fuzzy logic controller applied extra high suction rule (EXTH). High angle of attack and increase in the air velocity led to generate large bubble of separation in this case, the difference of pressure signal that sensed by BMP180 becomes high. To achieve the lift enhancement needed large suction to discharge the delayed boundary layer. The controller running the vacuum cleaner with high speed , thus the size of separation bubble will be determined the selection of suction flow rate by fuzzy logic controller. Lower value of AOA at low or medium air velocity tended to produce small bubbles of separation in this case need lower or medium suction flow rate, so fuzzy logic controller selected the following rules: very low (VL) or low (L) or medium (M) depending on the pressure difference signals to run the sucker at a proper speed.
Fig. (19): Lift Coefficient vs. Angle of Attack at Re = 2.345x 10
5and CQ (0.00958 -
0.0111).
Fig. (20): Lift Coefficient vs. Angle of Attack at Re= 2.708 X 10
5and CQ (0.0089 –
0.0109).
0 0.1 0.2 0.3 0.4 0.5 0.6 0.7 0.8 0 5 10 15 20C
LAOA in dgree
With suction Without suction 0 0.2 0.4 0.6 0.8 1 1.2 1.4 1.6 0 5 10 15 20C
LAOA in dgree
With suction Without suction84
Fig. (21): Lift Coefficient vs. Angle of Attack at Re = 3.028 x 10
5and CQ (0.0086-
0.010358).
8.6 Effect of Suction Process on the Drag Coefficient
Fig. (22) Indicates the influence of attack angle on the coefficient of drag at different Re- numbers and different suction flow rates. There are relatively reduction in the drag coefficient (Cd) almost at all AOA, compared to values of drag coefficient Cd obtained when testing the airfoil (model) without enhancement.
Fig. (22): Effect Angle of Attack on the Drag Coefficient at Different Reynolds Number
and Different CQ.
8.7 Effect the Suction Process on the Lift- Drag Ratio
Fig. (23) Refers the influence of attack angle on the L/D ratio at different Re- numbers and suction flow rate. Maximum lift to drag ratio was ( 46.0248) achieved at AOA (60) and Reynolds number equal (3.028x10⁵) it was more than that was achieved when testing the model without suction. This increase in the CL/ Cd ratio can be attributed to energize the delayed boundary layer by suction process. After that, any increase in the AOA lead to reduce the CL/ Cd ratio, the reason for this behaviour resulted from increasing in the objected area, which in turn leads to increase in the drag values. Also an increase in the air velocity tends to increase the energy of boundary layer.
0 0.01 0.02 0.03 0.04 0.05 0.06 0.07 0 5 10 15 20
C
dAOA Iin degree
Re = 2.345 e05 Re = 2.708 e05 Re = 3.028 e05 0 0.2 0.4 0.6 0.8 1 1.2 1.4 1.6 0 5 10 15 20
C
LAOA in degree
With suction Without suction85
Fig. (23): Effect AOA on the Lift Drag Ratio at Different Re- Number and Suction Flow
Rate.
8.8 Comparison with Literatures
The validation process for suction method was conducted by comparing the practical
data of the NACA0015 without and with suction against the results produced by three
literatures. Table (4.6) represents the comparison which carried out between C
Lof current
search and C
Lwas obtained from literatures [6], [8] and [9]. There was a slight increasing
between CL result of the experiment without suction and the results obtained from Munzarin
Morshed et al [6] see figure (4.10). Figure (4.11) indicates the comparison between C
Lresults
with suction of current research and the one obtained from the enhancement of a flat plate
airfoil results Z. Wang and I. Gursul [8]. Comparison between the results of C
Lof
NACA0015 and NCAC0012 with applying suction process at different AOA at the same
range of the suction coefficient shown in the figure(4.12) . Suction with NACA0015 gave a
higher improvement rate than NACA0012 and an increase in the angle of stall from 15
oto
more than 17
o.
Table (4.6): Comparison among the Current Study and Literatures.
Table (4.7) shows the validation ratio of lift coefficient C
Lwithout and with using
suction technology of three case studies that mentioned in literature review and used in the
comparison with present study case. Maximum ratio of C
Lwas achieved at AOA 15
0when
compared the present case with case mentioned in the literature [8] (flat plate airfoil), but this
ratio decreased slightly when applying suction on both cases and reach into about (1.313).
Also this ratio increased with increased AOA. There is a slightly increase in the C
Lratio
recorded when validating the present case with case mentioned in the literature [9]
(NACA0012), and maximum value was (1.289) can be seen at AOA (17
o).
AOA CL without suction of [21] CL without suction of [29] CL without Suction of [26 ] CL without Suction of [search] CL with suction of [29] CL with Suction of [26] CL with Suction of [search] 0 0 0 0 0 0 0 0 3 0.098 0.2 0.275 0.074 0.32 0.3 0.281 6 0.237 0.4 0.48 0.204 0.595 0.537 0.471 9 0.422 0.6 0.86 0.375 0.9 0.895 0.804 12 0.73 0.75 0.785 0.704 1.03 1.12 1.234 15 1.03 0.9 0.72 1.238 1.175 1.02 1.34 16 0.982 0.88 0.8 1.22 1.14 1.01 1.36 17 0.962 0.83 0.765 1.209 1.076 1.013 1.387 0 5 10 15 20 25 30 35 40 45 50 0 5 10 15 20
C
L/C
dAOA in degree
Re = 2.345 e05 Re = 2.708 e05 Re = 3.028 e0586
Table (4.7): Validation Lift Coefficient Ratio.
AOA 𝑐𝐿 𝑠𝑒𝑎𝑟𝑐ℎ 𝐶𝐿[6] Without suction 𝑐𝐿 𝑠𝑒𝑎𝑟𝑐ℎ 𝐶𝐿[8] Without suction 𝑐𝐿 𝑠𝑒𝑎𝑟𝑐ℎ 𝐶𝐿[9] Without suction 𝑐𝐿 𝑠𝑒𝑎𝑟𝑐ℎ 𝐶𝐿[8] With suction 𝑐𝐿 𝑠𝑒𝑎𝑟𝑐ℎ 𝐶𝐿[9] With suction 0 0 0 0 0 0 3 0.755 0.269 0.37 0.937 0.878 6 0.860 0.425 0.51 0.877 0.791 9 0.888 0.436 0.625 0.898 0.893 12 0.964 0.897 0.9387 1.1018 1.198 15 1.202 1.719 1.3756 1.313 1.140 16 1.242 1.525 1.386 1.346 1.193 17 1.257 1.58 1.4566 1.369 1.289
Fig. (24): Comparison C
LResults of the Present Experiment without Suction with C
LResults of Reference [6], Which Has NACA0015.
Fig. (24): Comparison Lift Coefficient Results between the Present Research and
Reference [8].
0 0.2 0.4 0.6 0.8 1 1.2 1.4 1.6 0 5 10 15 20C
LAOA
CL OF REF [8] CL of research 0 0.2 0.4 0.6 0.8 1 1.2 1.4 0 5 10 15 20C
LAOA
CL REF [6] CL of reseach87
Fig. (25): Comparison C
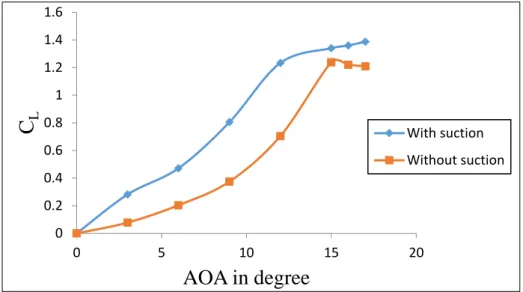
LResults between the Present Research and Reference [9].
9-Conclusions
The investigation in the current search leads to the following conclusions:
1. The outcomes of experimenting the model without suction show up that the drag coefficient Cd increased when AOA increased and decreased with increasing the Re- numbers. Also results referred to that the coefficient of lift CL increased when AOA and Re increased and maximum value of CL was (1.238) at stall angle.
2. Stall of BL occurred when testing NACA0015 at AOA (150) almost at all Re – numbers.
3. Flow control of vastly detached flows above a NACA 0015 and the influence of suction at different AOA and Re- numbers and different flow rates were investigated practically by using FL controller 4. Steady improving the aerodynamic features at different AOA and Re-numbers and different suction
discharge coefficient CQ was obtained when applying rules of fuzzy logic (FL).
5. Fuzzy logic rules have made improvement within range of suction coefficient CQ universally acceptable limits less than that used in literatures.
6. Fuzzy logic rules were formulated to be more precise by conducting more experiments.
7. It turns out that programming the Arduino in C language gives two benefits: first control the suction flow rate of vacuum cleaner. Second Process and display of data at similar time.
8. Mat Lab version 17 makes use of Simulink to the control process to decrease the time for designing the control system.
9. Five holes with 6 mm diameter gives surprising results in comparison with literatures.
10. Maximum increase in the value of CL was (14.72%) achieved at AOA (170) when applying suction process. This means the angle of stall increased.
11. When AOA increased, the CL/Cd ratio increased until AOA equal 12o then decreased.
12. Comparison was conducted between the outcomes of the current work with consequences of the published research proved that put the suction holes on a distance 75% from the leading edge gives great improvement.
Acknowledgement
The authors gratefully acknowledge to the chief of engineering Falih Husain Al- azawi for his efforts to perform this research. Also the authors gratefully acknowledge collage of engineering of Thi-Qar University due to allowing use the wind tunnel. Experimental investigation has been conducted in this wind tunnel.
CONFLICT OF INTERESTS.
- There are no conflicts of interest.
0 0.2 0.4 0.6 0.8 1 1.2 1.4 1.6 0 5 10 15 20
C
LAOA
CL REF [9]88
References
[1] T. Moghaddam, and N. B. Neishabouri,’’On the Active and Passive Flow Separation Control Techniques over Airfoils”, Journal of Materials Science and Engineering, vol.248, no. 3, 2017. [2] S. J. Johnson, C.P. Case van Dam and Dale E. Berg,’’ Active Load Control Techniques for Wind
Turbines’’, Sandia National Laboratories, University of California. Aug, 2008.
[3] K. Yang Tu,’’Design of a New Fuzzy Suction Controller UsingFuzzy Modeling for Nonlinear Boundary Layer’’, IEEE Journal, vol. 13, no. 5, October 2005.
[4] M. Goodarzi, M. Rahimi and R. Fereidouni "Investigation of Active Flow Control over NACA0015 Airfoil via Blowing ", International Journal of Aerospace Sciences, Vol. 1, no. 4, pp. 57- 63, APL. 2012.
[5] D. You and P. Moin, “Active Control of flow Separation over anairfoil using synthetic jets,”
Journal of Fluids and Structures, vol. 24, pp. 1349-1357, 2008.
[6] M. Morshed, S. B. Sayeed, S. A. Al Mamun and GM Jahangir Alam, " Investigation of Drag Analysis of Four Different Profiles Tested at Subsonic Wind Tunnel", Journal of Modern Science and Technology, Vol. 2. No. 2, pp. 113-126September 2014.
[7] D. F. Abzalilov, L. A. Aksentev and N. B. IL’Inskii,’’The inverse Boundary-Value problem for an airfoil with a suction slot”, Journal of Applied Mathematics and Mechanics, vol. 61, 1997.
[8] Z. Wang and I. Gursul,’’Post-Stall Lift Enhancement of a Flat Plate Airfoil by Suction’’, Journal of American institute of Aeronautics and Astronautics, vol. 55, no.4, pp.1-18, Jan. 2015.
[9] S S Baljit, M R Saad A Z Nasib, A Sani, M R A Rahman and A C Idris,’’Suction and Blowing Flow Control on Airfoil for Drag Reduction in Subsonic Flow”, in 2017 International Conference on Materials Physics and Mechanics, IOP 2017,2017.
[10]Ralf Messing and Markus J. Kloker,” Investigation of suction for laminar flow control of three-dimensional boundary layers”, Journal of Fluid Mech. vol. 658, pp. 117- 147, Mar. 2010.
[11] H.J.B. van de Wal,’’Design of a Wing with Boundary Layer Suction”, M.S. Thesis of Science, Delft University of Technology, Aug. 2010.
[12] Alexandru Dumitrache, Florin Frunzulica , Horia Dumitrescu and Vladimir Cardos ’’Blowing jets as a circulation flow control to enhancement the lift of wing or generated power of wind turbine”, Journal of Incas Bulletin, vol. 6, pp. 33-49, Feb. 2014.
[13] H. P. Monner,’’Smart materials for active noise and vibration reduction’’, Keynote Paper ,Saint-Raphaël,France, Apr.2005.
[14] Wen Hui Duan, Quan Wang, and Ser Tong Quek," Applications of Piezoelectric Materials in Structural Health Monitoring and Repair", Journal of Materials, no. 3, pp. 5169-5194, December.2010.
[15] Kubínová, S. and Šlégr, J,’’ChemDuino: Adapting Arduino for Low-Cost Chemical Measurements in Lecture and Laboratory’’, Journal of Chemical Education, vol. 92, no. 10, pp.1751-1753, 2015.