European Online Journal of Natural and Social Sciences 2018; www.european-science.com Vol.7, No 1 pp. 177-192
ISSN 1805-3602
Openly accessible at http://www.european-science.com 177
Gender Poverty Occupational Choice and Economic Growth Nexus in Poor and
Non-Poor Households: An Empirical Analysis
Hina Ali1*Asmat Naz2, Urwa Andleeb1
1
Department of Economics, The Women University Multan, Pakistan, 2
Department of History, The Women University Multan, Pakistan
*Email: hinaali@wum.edu.pk Received for publication: 23 September 2017.
Accepted for publication: 06 January 2018. Abstract
Our research is based on Gender Poverty and Occupational Choice in Poor and Non- Poor Household and the analysis is based upon the Household Survey of Pakistan. Poverty and Occupational choice has much importance in whole world especially in UDC’s it is most important issue. The connection between Gender Poverty and Occupational Choices and economic growth has been extensively validated. The research relevant to this study is incomplete because the poverty and occupational choice is an international issue for all economies of the world. In this study we use Time Series data from that time period 1973 to 2014 and this data shows the impact of poverty and occupational choice on economic growth. This data is collected from SBP (State Bank of Pakistan). In this study researcher has used IV(Investment) as dependent variable and others like RGDP(Real Gross Domestic Product), GFCF(Gross Fixed Capital Formation), EDUEX (Education Expenditure), NNS(Net National Saving), POP(Population) CPI(Consumer Price Index) and POV(Poverty) are used as independent variables. In this study ARDL Technique is implied along with ADF Unit Root Test. Moreover, stationary is also checked by different coefficient of variables. Different tests are used to check the stationarity of different variables, and stationary use for forecasting of variables. Stationary is also applied to achieve the objectives of our research. Our object is to enhance the intellectual’s living standard by giving good job opportunities as well as basic facilities to poor households to reduce poverty level in Pakistan. The Time Series Data technique is applied to inspect this research. The different variables show the association with poverty, therefore, this study highlights the development in saving, investment and in livestock subdivision of Pakistan which will be helpful to reduce the poverty level and will be the cause of increasing source of the income.
Keywords: Investment, Population, Consumer Price Index, Gross Fixed Capital Formation, Real Gross Domestic Products
Introduction
In Pakistan in 1990 the ratio of average women’s earnings were less than the earnings of mans. There was much gap between the earnings of both males and females. There were many reasons that cause a big gap between their earnings which may be Education level, experience, area of residence and many other things. The difference between earnings gives the result not honest works or experience accrued by the workers market differences. The advantage of this situation causes the unsatisfied economic position providing a specification for government authorities for economy /markets. If the difference in earnings satisfied the males and females then the interfere of Government is uncertain about equality and will cause misrepresentation.
Hina Ali, Asmat Naz, Urwa Andleeb
Openly accessible at http://www.european-science.com 178 Now we have to know about those factors which were caused of differences in the wages of males and females. This reason about differences in wages checked labor demand side and also checked by labor supply side. The difference of wages conclusion is that prejudice ca not spread in long run time period because by getting the help of women’s cost can be minimized at as usual output level. The statistically changes can be going on the basis of group links as females consume less than males, and the males and females difference in the labor market can be estimated by the range of earning among mans and women’s at the basis of justified for difference in assets and other qualitative personal good habits. Then due to multidimensional structure nature of males and females change it is difficult to measure it completely. It is possible that the females are satisfied with low wages because of different professions. The different wages of males and females regards to the employer’s discrimination. If it is sure in real life then after measuring different wages according to taste tells the wages level and poverty. In Pakistan many females are concerned with agriculture sector and work as agriculture workers.
The people of social and political sides explain briefly about poverty. There are some effects by the policymakers to check the poverty in both terms i-e as mentally issue and as mobile working. Here the poverty can be explained by the sample of regulations of traditional techniques and is no role of other values i-e society attitude, behavior of cultural and other different of social sides.
There are some characteristics of poor generation. 1st: They cannot attain the high profit by the effects. 2nd: High unemployment level for unskilled people. 3rd: They gain low wages from their work. 4th: The ownership of people anything which has values. 5th: The wealth distribution is not equal distribute among the people. Poverty can be explained in the form that “Unable to achieve basic needs” that condition called poverty. In developed countries the poverty has so many features because it is not a new topic of the history. Many people of developing countries living in rural areas and also relevant with agricultural sectors so, the agriculture side is not advanced in technically progress. The relationship of poverty with growth of economy and income is non-linear which so much difficult to understand and also have some complexities. The applicable fact is that if growth rate is low it shows inequalities and inequalities show the poverty.
Relevant to poverty there are three approaches are defined;
1st: In the 1st approach money term explain the poverty. i-e the poor people gain low level of income (gain less than one dollar per day)
2nd: The setting of any object is not satisfied.
3rd: The minimum level of basic needs and not ability to achieve basic resources.
According to this condition distribution among women’s change with the passage of time. The further research about different wages of women and man’s problems is most important check the links between occupational choice poverty. The high level poverty in rural areas has quick action speech on production and output trends in the agriculture side. In the 1995-96 to 2004-05 the growth rate was3.52 percent and in 2002-3 the poverty rate was 38.65percent. Poverty is out of control in rural areas because of low income, low facilities of sanitary, human rights, health and education. Poverty also increased by many other reasons which are following explains 1st: high population. 2nd natural resources are not available. 3rd clean water is not available. Contribution in growth directly, many other factors also effect the contribution to pro-poor growth, with the respect of links of the poor sector. When the income of people low and the needs are more than poverty exist and when income equal to their necessities.
To understand the differences correctly to examine how poverty is created how poverty is reduced. It is especial to check the poverty flows where it is exist. For this purpose we have to take help by three steps (a) those people which survived by poverty. (b) Survived by poverty people compare with long time poor people (c) common things which are exist among poor and non- poor
Social science section
Openly accessible at http://www.european-science.com 179
household. Education, ownership of lands, wages getting by out of country has no matter to surviving by poverty.
Poverty is generally concept because poverty exists all time. The measurements of poverty use different variables different concepts about poverty and different poverty lines. Poverty is international issue result of different methods that are social, political and economic in nature, and poverty also explained by different concepts to show different factors i-e population growth, education, health and income distribution and different atmosphere. Poverty issue also faced by country of Pakistan. Last 4 decades Pakistan faces the incidence of poverty. Poverty mostly exists in rural areas where more people are living in unsatisfation position.
As we know that poverty is a major issue in different understand countries so poverty has different types at different places. Basically poverty creates when the basic needs are not available as basic resources. The poverty accrues when financial assets are not provided and therefore life is not standard and the people are bound to living in extreme poverty. According to 1960 survey the poverty is less in urban but greater in rural areas. It is the research of different researchers by different surveys the poverty exist when people could not attain the basic needs.
Many people give the basic needs approach to check the level of poverty in different places. Poverty always lie in the development of economy, because many people living in situation of poverty in Pakistan. It is a historical fact which effects the growth of economy. It is always associated with the economic growth rate. As we see in Pakistan many people living in rural areas and also associate with agriculture side and the structure of growth in agriculture is very low. In agriculture side no progress because of low capital, low investment, low experienced and no education.
In most LDC’s people are attached with agriculture therefore they are living in extreme poverty. Unsatisfied geographical factors also maximize the socioeconomic disparities so; it is big cause of poverty. With high level of production the people of rural areas living in not better condition because of low earnings. They earn low they spend low and therefore they can’t gain a standard life.
According to different household survey the rural poverty is increased 40 percent during 1960 and after that decrease in 1970 and 1980. In rural areas poverty again extend in 1990 and after this decreasing returned. The process of checking the poverty in different areas is also different. In southern Punjab the poverty is a big issue and clear abases of development of the economy of southern Punjab. The development of growth of economy can reduce the poverty. The employment opportunities also reduce the poverty; because the people are unemployed definitely they face the poverty situation. Inequality of distribution of income also creates poverty in rural areas. The inflation rate also a big cause of poverty. The people are bound to face inflation problems. Poverty has many aspects like, no good cloth to wear, no facility of school, no employment, no availability of clean water so many people lose hope to live happy and better life. Poverty is the problem which can’t give the standard life.
Many people of rural areas face the poverty situation and many abs tackles have to face relevant to schooling, low income, low level of education, lack of resources and many other problems they have to face. As the report of survey 61percent population living in rural areas in Pakistan and 65percent population linked with agriculture sectors so, their income and employment level is so poor. Rural areas have much poverty than urban areas. Poverty increased in 19960 and growth rate extend by 6 percent.
In terms of HDI the Pakistan at a 136 number out of 177 countries. 20% people are not best growing, and 132.6% are living in poverty situation in period of 2000-2002. 17% population living
Hina Ali, Asmat Naz, Urwa Andleeb
Openly accessible at http://www.european-science.com 180 below the poverty line in period of 2005. According to occupational choices in developing countries where poor face the basic problems of hazard and limited job opportunities. Labor-tying is most special factor in which the poor get income and then consumes income. In Bangladesh it is important that poor apparatus leads to increase their consumption.
Literature Review
Tahir et al, 1999 worked on the study which was ‘Dynamics of Growth Poverty and Inequality in Pakistan. This data consist on Time Series poverty data and its survey from 1963-64 to1994-95. The data based on OLS Ordinary Least Square technique. The procedure adopted by Kakwani1993 and Kanbur1987 made use of single survey and give information on the short term elasticity’s but consist on silent condition about long time relationship between poverty, growth, and inequality. There were two approaches in the definition of poverty line 1st; arbitrary explained clearly a monitory amount as poverty line.2nd follows a more methodically qualitative quasi objectives approach. The study provided long run elasticity’s of poverty with respect to growth and inequality which were useful for policy purposes. The result of this study we have found that the data give us good procedure to observe the poverty and the relevant issues.
Muneer Ahmed, 2003 worked on article Agriculture Productivity, Efficiency and Rural Poverty in Irrigated Pakistan frontier. To improvement in inputs it would also increase the output and it would become reason to reduce poverty and agriculture productivity showed negative relation. When agriculture productivity low the income also low and it increase more poverty. The relationship can be observed by using simultaneously model equation. Big roll of the Government in private sector in the rural areas starting income growing for the poor and non form poor household to cut the vicious circle of poverty, low living standard, low output in agriculture productivity. The OLS Technique was use used in this paper. This study used the ‘Pakistan Rural Survey PRHS data for the time period the in cropping year 2001. This paper resulted that a serious problem of the farmer is adversely change the farm growth.
Christopher B. et al, 2005. Estimated an article named Rural Poverty Dynamics; Development Policy Implications. According to policies the disparity between transitory and high poverty showed the need to clear the condition of ‘’Cargo net’’ and ‘’ Safety net’’ to surviving and a main role for great impressive achievements of surviving. In this study Y return from productive assets used as dependent variable and a vector of productive assets and R as vector of the returned on productive assets, temporary income shocks and measurement error were used as independent variables. In this study the sufficient Time Series data used on the equal household members, but to gain more research for good future the economists used past panel data. The conclusion of this paper shows simple regression model in ‘A’ increase the assets with the presence of a poverty trap, and concavity use to gain internally condition of equilibrium .policies to check high poverty depend on careful, effective policies shows the domestic situations.
G .Quilca et al, 2007 examined the Poverty dynamics and the role of livestock in the Peruvian Ands. He used multiple methods or surveys but during research many other authors’ used Panel data of two years. This study used common linear regression model based on OLS. We gained in this study multiple methods adding stage of successful and household survey which gave us a combination of qualitative and qualitative conclusion. We found declining livestock assets for household that have decreasing in poverty. Improvements in livestock quality were also related to mobile in livestock quality were also related to movements out of poverty. The reason why people were becoming poor from the reason why people were coming out of poverty. The policies that were needed to stop people from decreasing must be handling the reasons for falling. The above study
Social science section
Openly accessible at http://www.european-science.com 181
concluded that providing information the rural people deal with Poverty and share its condition with Policy market.
Hashim et al, 2008. Worked on the article Trends and Determinants of Rural Poverty. A logistic regression analysis of selected district of Punjab. According to World Bank 2006 poverty is the incompetent to sustain low standard action relevant to basic needs i-e consumption, income for satisfaction. In this study the household data used consist of 4 rounds of the international food policy research institute IFPRI time period from 1986-87 to 1990-91, and also added panel data household in the 2001-02 Pakistan Rural Household Survey PRHS. Dependent variable Y poor household, independent variables, education poverty and Xi probability of poor household showed negative relationship because education was important to give up poverty. Poverty status regression was applied mostly and used probity or logit model. The major objective of this paper was to clear the complex relevant to agriculture growth and situation of rural poverty and the factors which estimate the poverty status. More adult’s members cause to decreasing poverty. Inequality and their Shifters at Household.
Malik et al., 2009 analyzed the study The Impact of Socioeconomic and Demographic variables on Poverty. This study used Primary data by the household survey. In this paper two main approaches used, 1st poverty profile and 2nd an econometric approach in our research experience. In this paper education , participation rate, population at big level and ownership of lands by household were found to be positively related to income and negatively related to poverty incident. The survey was conducted in 2006.In this study author used R2 and F-test. This study resulted as strong and sufficient link between education levels and rural poverty.
Sharif et al, 2010 Rural Poverty Dynamics in Status and Regions of India. In this study panel data was applied which was consist at 12 years period from 1993 to 2005. Our observed information of rural poverty is not suitable with other and more widely-used information resulted by consumption data which was adopted by the National Sample Survey Organization NSSO. Recent survey by the NSSO and many other surveys given observations about the big poverty at the domestic level. The writer used in this paper the terms of reasons which are Simultaneous inward and outward flows. This study shows the result that here is no direct correlation exists at the level of standard between High Growth rate and High Poverty decreasing.
Janjua et al, 2011worked on the Impact of Village Group Financial Service on women empowerment and Poverty. This study based on two types of data, Primary and Secondary data. The data was observed by the Open ended questionnaire and focused on group discussion. In this paper Ordinary Least Square technique was used. This study find out the result that it based On Score cards show that Aids which was provide as by VGGS is near to poor Segment of the Women in district Gilgit.
Malik et al, 2012 worked on Analysis of Rural Poverty in Pakistan, Bi-Model Estimation of some Selected Villages. This study based on Primary data by Rural Household Survey collected from last four Decades to observe the Poverty level in Pakistan. To estimate the study the author used F test and t tests. From this study we conclude that the Government has to Improve Poverty standard by control over the diseases given good facility of health and very basic health problems related to Household.
Akram et al, 2013, estimated an article named as An Investigation of Poverty, Income, level in Pakistan. This paper presented the realities relevant very low level .Unbalance of income also a big problem which enhances the poverty.0.43 show high income inequality measurement by Gini to household poverty and inequality level by using Pakistan Social and Living Standards Survey PSLM which was based on Primary data from that time period 2008-2009.In this study Y income used as
Hina Ali, Asmat Naz, Urwa Andleeb
Openly accessible at http://www.european-science.com 182 dependent variable, while different categories of poverty are independent variables. All independent variables had negative relationship with Y income. According to econometric methods Multinomial logit Model adopted in this paper. In this paper Arif as a reference used panel data. The result of this study is that according to survey household status is coefficient.
Khan et al, 2014. Worked on the article which is The Long Term Impact of Health on Economics Growth in Pakistan. In this paper the Time Series data used period from 1972-2006. The study also point out other than small role of public health consumption in estimating the per capita GDP. There was a positive relation between human capital and economic growth measuring health status by infant mortality rate, life expectancy rate and crude health rate and per capita GNI as indicator of economic growth, The Co integration, Error correction and Granger causality techniques were used in this paper. There was a health indicator had positive relation with Per capita GDP. Malik 2006 finds that if OLS was used then there was no significant relationship between health status and economic growth. In this study we take result that the Policy implications of that study is that the Countries can achieve the high level of per capita by enhance the Stock health Human capital.
Ahmed et al, 2015. He analyzed the study The Dynamics of Energy Consumption Liberalizations, Financial Development, Poverty and Carbon Emission in Pakistan. In this study the writer used Panel data for research time period from 1993 to 2004. In this paper author used Gross Domestic Products GDP as dependent variable and Energy Consumption, Trade Liberalization, Poverty, Environmental Degradation etc, as independent variables .This study analyzed the effects of economic growth energy expenditure, clearness of economics financial progress control for the effects of poverty levels on atmosphere degradation measured by carbon dioxide bring out for the 1972-2011 period. The ADF test is applicable when the error terms were continuously correlated .From this study we find the result that Improvement in efficient Status part can provide the help to display the Poverty through the availability to Microfinance to the poor Segments of Pakistan.
Data and Methodology
For good result, a reliable data set is required. Time series data used for analysis. To analyze the relationship among variables used data from 1973 to 2015. In this chapter discuss the theory of data and techniques.
Description of Variables
Gross Domestic Product (GDP)
In this model the independent variable is gross domestic product. Real gross domestic product is measuring the value of the production of economy accommodate for change in prices. An economic value that is measuring by the base year prices is called real gross domestic product.
Labor Force Capital Formtion (LFPR)
In this model the dependent variable is LFPR. The percentage of the labor force due to the total population. People who are willing and able to work are included in LFPR but those people who are not willing and not able to work are not included in LFPR, e.g.; children’s and over age people.
Education Expenditure (EDU)
Expenditure on education is an investment that increases the augmentation of economy and reduces the unfairness. Expenditure on education means development in education sector. For improving in educational institutions, expenditures on education are compulsory.
Gross Fixed Capital Formation (GFCF)Gross fixed capital formation is defined as the
Social science section
Openly accessible at http://www.european-science.com 183
expenditure of fixed assets, and also it is not include in purchasing land. It is a part of fixed expenditure approach for measuring GDP.
Investment (IV)
Investment is a credit that is acquirement with the desire that it will develop income in the eventual. In financial point, it is the acquirement of goods that are not sell on the day but used in the eventual to make wealth. In economic point, investment is commercial credit bought with the concept that credit will give income in the eventual and be selling at a maximum price.
Saving (S)
The part of expendable income which cannot spend on the customer goods but acquired exactly in basic material or in refunding off a homeowner’s loan or inexactly by bought of bonds. It is that money which we not spend on anything from our salary.
Table 1: Nature of Sources of Data
Variables Descriptive Variables Unit of Measurement Source Sign Dependent
Variables
IV Investment Percentage State Bank +
of Pakistan
Independent
Variables
CPI Inflation Percentage State Bank +
of Pakistan
GFCF Gross Fixed Capital Million Rupees State Bank +
Formation of Pakistan
GDP Gross Domestic
Product
Percentage State Bank +
of Pakistan
LFPR Labor Force Capital Percentage Bureau of -
Formation Labor Statistics
POV Poverty Percentage State Bank -
of Pakistan
POP Population Percentage State Bank -
of Pakistan
EDU Education Expenditure Percentage World Bank +
S Saving Percentage State Bank +
of Pakistan
Inflation (CPI)
It is explain as a continuous raise in the specific point of prices for equipment and benefits. Inflation is deliberate as a yearly percentage raise. As it increases, each dollar which we purchase a shorter percentage of an equipment and benefit.
Poverty (POV)
Poverty is ordinary drought, inadequacy, or the case of one who loss a sure amount of actual dominion or money. Poverty has a various concepts, which involve social, economical, and political variables. Poverty is defined in two terms which are absolute and relative.
Hina Ali, Asmat Naz, Urwa Andleeb
Openly accessible at http://www.european-science.com 184
Population (POP)
All fundamental, particular, or entities that accommodated the option norm for a bundle of studies, and by which a delineative element is chosen for cued assessment. The overall population is known as universe.
Process of Estimation
Estimation theory is a doctrinal organization which collects the methods to solve the problems with very simple way, clarification from reality for value of enormity has taken from these clarifications relevant to consideration departing about observations. We have no idea about magnitude directly but it have a link it observation as many aspects. If the observations are real than there will be no exist any error or uncertainty and then magnitude will determine without any mistakes. So the all experiments whenever repeated the values must be same. Therefore the estimation theory concerned with these observations, and these observations help to achieve the possible extent at correct basis.
Estimation theory classified into two parts; a. Parametric estimators:
b. Non –parameters:
These estimators are collected by real knowledge and by assumptions while non-estimators are non-assumptions.
Data Stationary
Stationary of data is must for forecasting of variables. It is used to check the data integration in different orders. Stationary exist when mean and variance are constant. If mean and variance is not constant then stationary not exist. If data is not stationary then forecasting is not possible.
ADF Unit Root Test
Augmented Dickey- Fuller (ADF) it is asample transformation which is use to applied to eliminate the parameters. In this data Time Series Data use and when there exist mysterious deterministic tendency then we purpose to ADF test to clear the determinants complexities for the improvement in deterioration analysis. From the limitations of these tests we gain statistics methodology. According to Time Series Data the new inventions in these tests show the comparison of ADF with ADF t-test. These tests help us to check the non-stationary and also help to determining the drift whether it is stochastic or deterministic. The t-test also called ADF tests and these tests also known as Phillips Zα and Zt tests. The ADF test also use to changing in economy models. The limits of constant valuation are simple revolution and it is useful to determine the parameters providing by the ADF tests for all complicated problems.
Bound test
The economist of some countries adopts different models to deal with exchange rate from last 50 years. So these tests specify the evidence of long run relationship among exchange rate, prices of different goods and interest rate etc. From this we can get clear information OR strong substantiation about equality and non-equality theories. So international level this is a big issue that how to manage exchange rate, how it can resolute. There is no satisfied arguments about inflation that how it can show the significant level of the exchange rate. But with the passage of time some profiles are missing to explain the exchange rate properly, so economists of U.S country adopt Bound-Tests to determine the exchange rate. With the help of Bound- Tests the models satisfied and the problems of exchange rate solve.
ARDL Technique
In econometric analysis about short run and long run relations focus on experimental and theoretical research. When variables show different stationary the analysis become more complicated to understand. Stationary concerned with long run co-efficient of variables. But
Social science section
Openly accessible at http://www.european-science.com 185
traditional ARDL approach is not applicable for this analysis. There are some small samples for performance of ARDL, AIC, ARDL-Sc. There are two steps for parameters estimation;
1st: (1) at the first difference level and 2nd: (0) at the best level.
The ARDL technique use to compute the standard error of long run parameters.
Co-integration Analysis
The term co-integration determine by the existence of long run relation among the variables which one non stationary co-integration are use to check the relation of variables in the long run term. If long run relation does not exist then only find out the short run relation among variables.
Econometric Analysis
We define the Gender, Poverty and occupational choice in poor and non-poor Household: This Analysis Based on the Household Survey data of Pakistan. In this paper we showed the time series data developed and composed by the SBP. This data collected by State Bank of Pakistan and the collection period was 1973 to 2014.Iv(dependent) used as dependent variable and RGDP(Real Gross Domestic Productive), LFPR(labor force participation rate ) GFCF() EDUEX() NNS(Net National Saving) POPG2(Population Growth) CPI( Consumer Price Index)
RGDP , GFCF, EDUEX, NNS and CPI have positive effect on economy these variables leads the economy at higher level while the IV, LFPR, POPG2 and POV have negative effect on economy because these variables decrease the economic development.
Model specification
The following are estimated variables and their impact on model explained;
Ln IV= Ln β0 +Lnβ1RGDP + Lnβ2GFCF + Lnβ3EDUEX + Lnβ 4NNS - Lnβ5POPG2 + Ln β6CPI - Lnβ7POV
There is a Investment (IV) natural log dependent variable and natural log of RGDP, natural log of GFCF, natural log of EDUEXP( Education Expenditure) natural log of NNS(Net National Saving) natural log of POP(Population), Natural log of CPI (Consumer Price Index) and natural log of POV(Poverty) used as independent variables. The following study implemented on ARDL during the period of 1973 to 2014.Staionarity of not for pre-requisite for this ARDL Technique, so the Stationary of data checked by order two because ARDL is already integrated for order 2. To justify the long run relationship between ARDL Equation estimated
∆ = + ∆ + ∆ + ∆ + ∆
+ ∆ + ∆ + ∆ + ∆
+ ∆ + + + + +
+ + + +
The 2nd step involves the estimation of long run and short run relationship between the variables. The long run model is projected through following equation:
Hina Ali, Asmat Naz, Urwa Andleeb
Openly accessible at http://www.european-science.com 186
= + + + + +
+ + + + + ∈
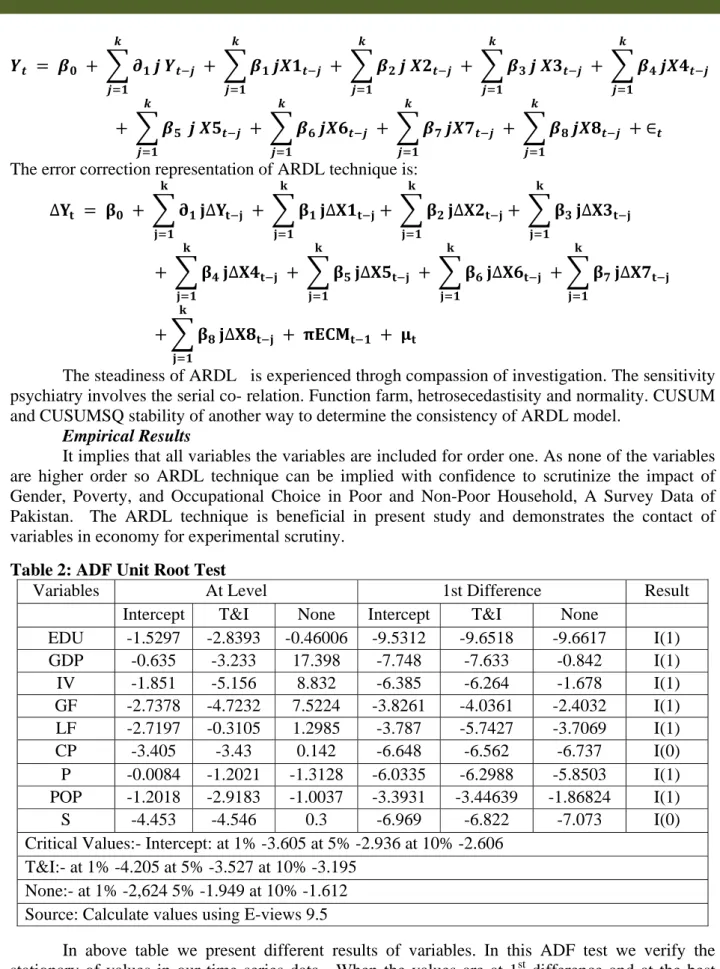
The error correction representation of ARDL technique is:
∆ = + ∆ + ∆ + ∆ + ∆
+ ∆ + ∆ + ∆ + ∆
+ ∆ + +
The steadiness of ARDL is experienced throgh compassion of investigation. The sensitivity psychiatry involves the serial co- relation. Function farm, hetrosecedastisity and normality. CUSUM and CUSUMSQ stability of another way to determine the consistency of ARDL model.
Empirical Results
It implies that all variables the variables are included for order one. As none of the variables are higher order so ARDL technique can be implied with confidence to scrutinize the impact of Gender, Poverty, and Occupational Choice in Poor and Non-Poor Household, A Survey Data of Pakistan. The ARDL technique is beneficial in present study and demonstrates the contact of variables in economy for experimental scrutiny.
Table 2: ADF Unit Root Test
Variables At Level 1st Difference Result
Intercept T&I None Intercept T&I None
EDU -1.5297 -2.8393 -0.46006 -9.5312 -9.6518 -9.6617 I(1) GDP -0.635 -3.233 17.398 -7.748 -7.633 -0.842 I(1) IV -1.851 -5.156 8.832 -6.385 -6.264 -1.678 I(1) GF -2.7378 -4.7232 7.5224 -3.8261 -4.0361 -2.4032 I(1) LF -2.7197 -0.3105 1.2985 -3.787 -5.7427 -3.7069 I(1) CP -3.405 -3.43 0.142 -6.648 -6.562 -6.737 I(0) P -0.0084 -1.2021 -1.3128 -6.0335 -6.2988 -5.8503 I(1) POP -1.2018 -2.9183 -1.0037 -3.3931 -3.44639 -1.86824 I(1) S -4.453 -4.546 0.3 -6.969 -6.822 -7.073 I(0)
Critical Values:- Intercept: at 1% -3.605 at 5% -2.936 at 10% -2.606 T&I:- at 1% -4.205 at 5% -3.527 at 10% -3.195
None:- at 1% -2,624 5% -1.949 at 10% -1.612 Source: Calculate values using E-views 9.5
In above table we present different results of variables. In this ADF test we verify the stationary of values in our time series data. When the values are at 1st difference and at the best
Social science section
Openly accessible at http://www.european-science.com 187
level then we will apply the ARDL technique i-e some variables have 1st difference and some have at best level. Optimum lag time-span is compulsory the model through ARDL technique and it give outcome by different criteria’s.
Table 3: Estimate Equation
R-squared 0.999 Mean dependent Var 12.5727
Adjusted R-squared 0.999 S.D. dependent Var 1.36468 S.E. of regression 0.0577 Schwarz criterion -2.24734 Sum squared resid 0.0868 Hannan-Quinn criter -2.50922 Log likelihood 55.32757 Durbin-Watson stat 2.23855
F-statistic 2367.523 Akaike info criterion -2.6473
Prob(F-statistic) 0 Source: Calculate values using E-views 9.5
If the value of R-squared and Adjusted R-squared near to one (1) value then it shows the best result. If the value is not near to one (1) then may be result not sufficient OR problems can be arise. Now we see the value of Durbin Watson and here it is 2 which show the expected value is very best. If the Durbin Watson lie in the 1.5 and 2.5 then it is best level When the Durbin Watson values is 2 it shows there is no auto-correlation.
Table 4: Diagnostic Test
Serial correlation Test 0.1421
Hetrosckedasticity Test 0.3330
Normality Test 101.80
Ramsey Reset Test 0.1446
Source: Calculation using E-views 9.5
The observations of diagnostic table show that in our model no serial correlation, no hetroscedasticity and all inputs normally distributed with each other. The value of Ramsey Reset test shows that no specification error in our model.
Table 5: Bound Test
In above Bound Test we show the F-statistics values. The value which occur in this test is high from all other values and the values of F-statistics greater than upper boundaries and also greater than lower boundaries then it shows Co-Integration in the long run relationship.
F-statistics 9.658514
Critical value Bound LB UB
Significance 10% 1.85 2.85
Significance 5% 2.11 3.15
Significance 2.5% 2.33 3.42
Significance 1% 2.62 3.77
Hina Ali, Asmat Naz, Urwa Andleeb
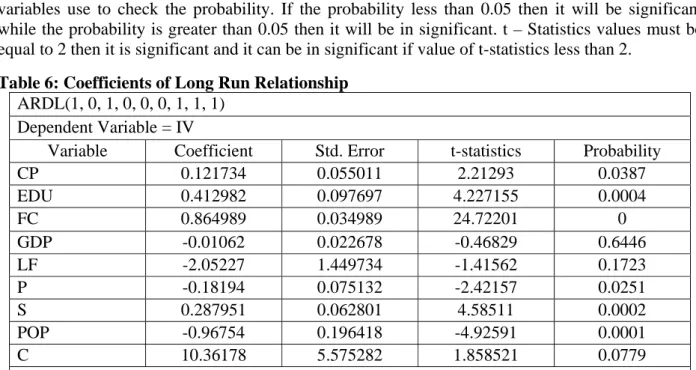
Openly accessible at http://www.european-science.com 188 Below is a coefficient of long run relationship in this we explain the different effects of variables. Here is GDP(Gross Domestic Product), LF( Labor Force), POV(Poverty) and the POP(Population) shows negative association with poverty and occupational choices while CP(Consumer Price), EDU(Education Expenditure), FC(), S(Saving) and C(Cost). The effects of variables use to check the probability. If the probability less than 0.05 then it will be significant while the probability is greater than 0.05 then it will be in significant. t – Statistics values must be equal to 2 then it is significant and it can be in significant if value of t-statistics less than 2.
Table 6: Coefficients of Long Run Relationship ARDL(1, 0, 1, 0, 0, 0, 1, 1, 1)
Dependent Variable = IV
Variable Coefficient Std. Error t-statistics Probability
CP 0.121734 0.055011 2.21293 0.0387 EDU 0.412982 0.097697 4.227155 0.0004 FC 0.864989 0.034989 24.72201 0 GDP -0.01062 0.022678 -0.46829 0.6446 LF -2.05227 1.449734 -1.41562 0.1723 P -0.18194 0.075132 -2.42157 0.0251 S 0.287951 0.062801 4.58511 0.0002 POP -0.96754 0.196418 -4.92591 0.0001 C 10.36178 5.575282 1.858521 0.0779
Source: Calculating values using E-views 9.5
There is coefficient of short run relationship. In this table we explain the effects of different variables. The coefficients CP(Consumer Price), EDU(Education), FC(Fixed Cost) and S(Saving) show positive effect and DGP(Gross Domestic Product), LF(Labor Force), P(Poverty), POP(Population) and ECM() shows the negative association with Gender, Poverty and occupational choices in poor and non-poor households in this table. In this table the effects of variables apply to verify the probability of values. If the probability is less than 0.05 then it will be significant while if the probability is greater than 0.05 then it will be insignificant.
Table 7: Coefficients of short Run Relationship
Variable Coefficient Std. Error t-statistics Probability
dCP 0.131578 0.035034 3.755727 0.0012 dEDU 0.344602 0.053118 6.487468 0 dFC 0.903026 0.052582 17.17356 0 dGDP -0.01157 0.013928 -0.83059 0.416 dLF -2.624 1.373475 -1.91048 0.0705 dP -0.07672 0.060998 -1.25782 0.2229 dPOP -0.16902 0.285722 -0.59156 0.5608 dS 0.124121 0.038761 3.202228 0.0045 ECM(-1) -1.18468 0.141294 -8.38446 0
Social science section
Openly accessible at http://www.european-science.com 189
Graph of Cumulative Sum of Recursive Residuals:
The stability in long and short run parameters is checked by the CUSUM square. This diagram of CUSUM Square lies within red lines which are critical boundaries lines at 5% level so this show the level is significant. This situation shows our model is precise and accurate established.
Graph of Cumulative Sum of Squares of Recursive Residuals:
In this diagram the parameters of short run and long run checked by CUSUM tests. The graph of CUSUM lies within these red lines and show 5% level so that is significant level. This significant show that our model is best and complete stable form.
Policies Implications
Government policies focus on increase the income growth and also increase economic growth. In economic term policies have to adopt for development of economy and to increase the standard of life of everyone in the UDC’s.During the 1950s and the 1960s Government made policies to achieve the high economic growth of economy. And in 1970s the further improvement in these policies that Pakistan Development Strategy changed.
IRDP (Integrated Rural Development Progress) 1972- 1980 this programmed improve the farmer, and that is to reduction of poverty and enhances the employment level in Pakistan. There is also need to those steps OR introduce new ideas that promote those steps which are cause to overcome poverty. To increase the income level to increase the saving and to increase the job opportunities the occupational choices and poverty can be diminish at some ranges. Population which is living in very poor condition i-e living in rural areas can be promoted at best standard level by adopting some policies implications. Taking some different Household Expenditure Survey we can get brief detail about rural poverty as well as urban poverty, and these surveys also give methods to solve the all issues relevant to poverty and job opportunities. In the long run time, The Time Series Data give good analysis at the relation of growth rate and poverty. This study makes available long run elasticity’s of poverty and employment opportunities with respect to undistribution of income and growth which are purposeful to policy makers. Involvement in service
-0.4 0.0 0.4 0.8 1.2 1.6 1992 1994 1996 1998 2000 2002 2004 2006 2008 CUSUM of Squares 5% Significance
-15 -10 -5 0 5 10 15 1992 1994 1996 1998 2000 2002 2004 2006 2008 CUSUM 5% S ignificanc e
Hina Ali, Asmat Naz, Urwa Andleeb
Openly accessible at http://www.european-science.com 190 is important for decline of poverty because poverty has negative impact on household welfare and income growth. So, the participation by women’s in employment sector because it is a big solution to solve the poverty issues. Women’s also constitute a great part of increasing the welfare of society. The progress in first decade of independent was not sustained because the unemployment and poverty level was high. In 1970s the country has to face the low economic growth, low employment level, unavailability in economy therefore the growth rate was –ve i-e -0.3% in 2000. So the result of above all problems leads to enhance the poverty and unemployment level. The relationship between income of males and females showed much gap this is because of labor market not allowed to gain job opportunities for women so the income disparity increased. This problem also increases the poverty level.
Policy interventions:
Policy interventions to improve the quality of income of women’s to getting job opportunities and it is must to condense the poverty. The policies improve the great participation of women’s because it is important to reduce the poverty and unemployment level. The process that can improve the quality of income, equal distribution of people based on different occupational choices are important for policy makers. According to best education policies the job opportunities can be increase productivity level in production side relevant to agriculture side. Investment can be increase by adopting policies and all these leads to decrease the poverty level.
Improvement in Rail Transportation:
Improvement in rail transportation it supports to lead the employment level at industrial sides and the income level increase between 1860 to 1920. This collision increases the economic movement and increase the demand for labors. In 19th century the different segment modes to reduction of poverty and decreasing the job opportunities in short run and in long run.
Steps by Government, for Development:
Following are some steps by Government; 1. Improvement in Rural Areas.
2. Progressive Steps for Human and Capital Development. 3. Economic Growth for Reduction of Poverty.
4. Land Reforms.
5. Food Security Programmers. 6. Employment Opportunities. 7. Social Development.
8. Social and Economic Security Programmers. 9. PPAF (Pakistan Poverty Alleviation Fund). 10. High Education and Technical Education level.
Economists and policymakers focus to remove the poverty indicators. Each economist has different implications for reduction of poverty. They can alleviate the poverty by increasing the investment, generate the assets, increase wealth and many others progressive steps. These are significant implications to gain the good level of economy and to increase the assets for policymakers. Government has always to specify the steps which help to increase the social welfare and provide basic facilities for poor.
In last 50 years Government has made different policies, schemes and programmers to achieve the best growth level. Some steps are continued and some are replacing with new ideas.
Conclusion
This study focuses upon four phases in which Gender Poverty, Job Opportunities, Security and qualifications are involved. There are some policies implications for encouraging women’s
Social science section
Openly accessible at http://www.european-science.com 191
participation in different occupational sides. For this purpose the Government takes some steps to improve the labor market and also give job opportunities to reduce the job discriminations in labor force faced by poor and non-poor households. Policies for increasing education level for women have been made to enhance the experience and education of women.
As we know that occupational choice is important for female earnings so there are some difficulties in good performances by females in professional sides. In Integration for gender poverty there are some significant problems such as to determine the gender poverty, poverty in capacity for working, poverty in security and poverty in empowerment. To improvising above all problems some schemes and programs are organized. But the gender poverty may not be completely solved because of some complicated impacts of gender.
There is need to invent gender sensitive programmers, to reduce the poverty and to improve the employment level in Pakistan. There is also need to imply those steps Or to introduce new ideas which can affect the reduction of poverty in Pakistan. The unavailability of occupational choices and poverty in different rural and urban areas can be controlled to increase the saving and job opportunities. By some policies implications, the poor condition of rural areas residences could be enhanced at best scale and this step leads towards standard life. Different Household Expenditure Surveys we have get great detail about rural and urban poverty level and also get the methods to solve out all above issues relevant to poverty and jobs. In the long time, the Time Series data gives us good analysis at the relation and growth of economy. This study provides long run elasticity’s of poverty and employment opportunities with respect to unequal distribution of income and growth which are purposeful for policy makers. From this study we also conclude that some steps have to take for increasing the literacy velocity. Educational programmers have to developed and successfully advanced to maintain the enrolment proportion in school. Agriculture services must be providing to enhance the rural life at the great stage. Efforts also taken to expert the agriculture goods to increase the economy growth of the country. Some techniques i-e ARDL and tests i-e Unit Root Test are applied to check the relations of variables with economic growth. This study shows growth elasticity of undistribution of income greater in farm productivity and household welfare while to reduce the poverty of urban areas than in rural areas. Therefore the lattice growth elasticity of poverty and unavailability of occupations is higher in rural than urban areas. Protected possessions rights can increase the households.
References
Ahmad, M. (2003). Agricultural productivity, efficiency, and rural poverty in irrigated Pakistan: A
stochastic production frontier analysis. The Pakistan Development Review, 219-248.
Akhtar, S., Saboor, A., Mohsan, A. Q., Hassan, F. U., Hussain, A., Khurshid, N., ... & Hassan, I.
(2015). Poverty dynamics of rural Punjab and over time changes. J. Anim. Plant Sci, 25,
572-577
Akram, W., Hussain, Z., Sabir, H. M., & Hussain, I. (2008). Impact of agricultural credit on growth
and poverty in Pakistan (time series analysis through error correction model). European
Journal of Scientific Research, 23(2), 243-51.
Ali, S. S., Tahir, S., & Arif, G. M. (1999). Dynamics of Growth, Poverty, and Inequality in Pakistan
[with Comments]. The Pakistan Development Review, 837-858.
Ali, A., & Abdulai, A. (2010). The adoption of genetically modified cotton and poverty reduction in
Pakistan. Journal of Agricultural EconomiKrishna, A., & Shariff, A. (2011). The irrelevance
Hina Ali, Asmat Naz, Urwa Andleeb
Openly accessible at http://www.european-science.com 192 (2012). Poverty, income inequality, and growth in Pakistan: a pooled regression analysis.
regions of India, 1993–2005. World Development, 39(4), 533-549.
Ali, S., Waqas, H., & Ahmad, N. (2015). Analyzing the Dynamics of Energy Consumption,
Liberalization, Financial Development, Poverty and Carbon Emissions in Pakistan. Journal
of Applied Environmental and Biological Sciences, 5(4), 166-183.s
Awumbila, M., & Ardayfio-Schandorf, E. (2008). Gendered poverty, migration and livelihood
strategies of female porters in Accra, Ghana. Norsk Geografisk Tidsskrift-Norwegian
Journal of Geography, 62(3), 171-179.
Barrett, C. B. (2002). Food security and food assistance programs. Handbook of agricultural
economics, 2, 2103-2190.
Barrett, C. B. (2005). Rural poverty dynamics: development policy implications. Agricultural
Economics, 32(s1), 45-60. Case Study of the First Micro Finance Bank Gilgit. Dialogue
(1819-6462), 6(4).
Cheema, A. R., & Sial, M. H. (2012). Poverty, income inequality, and growth in Pakistan: a pooled regression analysis. Nisar, R., Anwar, S., Hussain, Z., & Akram, W. (2013). An Investigation of Poverty, Income Inequality and Their Shifters at Household Level in
Pakistan. Journal of Finance and Economics, 1(4), 90-94. cs, 61(1), 175-192.
Justino, P., Litchfield, J., & Pham, H. T. (2008). Poverty dynamics during trade reform: Evidence from
Kahn, M. E. (2005). The death toll from natural disasters: the role of income, geography, and
institutions. Review of economics and statistics, 87(2), 271-284.s
Kristjanson, P., Krishna, A., Radeny, M., Kuan, J., Quilca, G., Sanchez-Urrelo, A., & Leon-Velarde,
C. (2007). Poverty dynamics and the role of livestock in the Peruvian Andes. Agricultural
Systems, 94(2), 294-308.
Muhammad, M., Janjua, P. Z., & Ullah, K. (2011). Impact of Village Group Financial Services on Women Empowerment and Poverty: AMalik, S., Chaudhry, I. S., & Hanif, I. (2012). Analysis of Rural Poverty in Pakistan; Bi-Model Estimation of Some Selected
Villages. International Journal of Humanities and Social Science, 2(8), 73-80.
Qureshi, S. K., & Arif, G. M. (2001). Profile of poverty in Pakistan, 1998-99. Pakistan institute of
development economics (PIDE)
Schreiner, M. (2010). A simple poverty scorecard for Pakistan. Journal of Asian and African
Studies, 45(3), 326-349.
sRahut, D. B., Ali, A., Behera, B., & Aryal, J. (2015). Impact of Irrigation Water Scarcity on Rural Household Food Security, Income and Poverty Levels in Pakistan.s