Developing Multithreaded
Applications: A Platform
Consistent Approach
THIS DOCUMENT IS PROVIDED "AS IS" WITH NO WARRANTIES WHATSOEVER, INCLUDING ANY WARRANTY OF MERCHANTABILITY, FITNESS FOR ANY PARTICULAR PURPOSE, OR ANY WARRANTY OTHERWISE ARISING OUT OF ANY PROPOSAL, SPECIFICATION OR SAMPLE.
Information in this document is provided in connection with Intel products. No license, express or implied, by estoppel or otherwise, to any intellectual property rights is granted by this document or by the sale of Intel products. Except as provided in Intel's Terms and Conditions of Sale for such products, Intel assumes no liability whatsoever, and Intel disclaims any express or implied warranty, relating to sale and/or use of Intel products including liability or warranties relating to fitness for a particular purpose, merchantability, or infringement of any patent, copyright or other intellectual property right. Intel products are not intended for use in medical, life saving, or life sustaining applications.
Intel retains the right to make changes to its test specifications at any time, without notice.
The hardware vendor remains solely responsible for the design, sale and functionality of its product, including any liability arising from product infringement or product warranty.
Performance tests and ratings are measured using specific computer systems and/or components and reflect the approximate performance of Intel products as measured by those tests. Any difference in system hardware or software design or configuration may affect actual performance. Buyers should consult other sources of information to evaluate the performance of systems or components they are considering purchasing. For more information on performance tests and on the performance of Intel products, reference www.intel.com/procs/perf/limits.htm or call (U.S.) 1-800-628-8686 or 1-916-356-3104.
The Pentium® III Xeon™ processors, Pentium® 4 processors and Itanium® processors may contain design defects or errors known as errata which may cause the product to deviate from published specifications. Current characterized errata are available on request.
Copyright © Intel Corporation 2003-2005
Contents
1. Multithreading Consistency Guide ...3
1.1 Motivation...3 1.2 Prerequisites ...3 1.3 Scope ...3 1.4 Organization ...3 Editors 4 Authors 4 Reviewers 4 Technical Writers ...4
Intel® Multithreading Consistency Working Group Chairs ...4
2. Intel® Software Development Products ...5
Intel® C/C++ and Fortran Compilers ...5
Intel® Performance Libraries...5
Intel® VTune™ Performance Analyzer...6
Intel® Thread Checker ...6
IntelThread Profiler...6
2.1 Automatic Parallelization with Intel Compilers...7
2.2 Multithreaded Functions in the Intel Math Kernel Library ...12
2.3 Avoiding and Identifying False Sharing Among Threads with the VTune Performance Analyzer ...15
2.4 Find Multithreading Errors with the Intel Thread Checker ...20
2.5 Using Thread Profiler to Evaluate OpenMP Performance ...26
3. Application Threading...31
3.1 Choosing an Appropriate Threading Method: OpenMP Versus Explicit Threading...32
3.2 Granularity and Parallel Performance ...37
3.3 Load Balance and Parallel Performance ...42
3.4 Threading for Turnaround Versus Throughput ...46
3.5 Expose Parallelism by Avoiding or Removing Artificial Dependencies ...49
3.6 Use Workload Heuristics to Determine Appropriate Number of Threads at Runtime ...53
3.7 Reduce System Overhead with Thread Pools...56
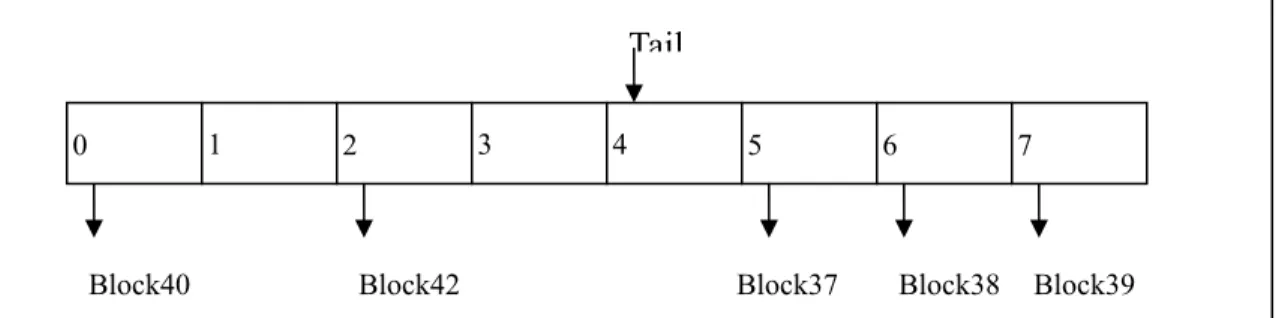
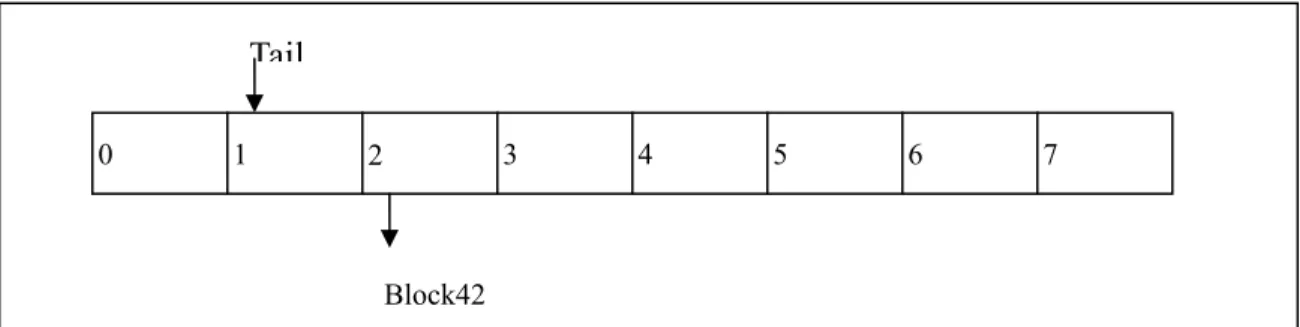
3.8 Exploiting Data Parallelism in Ordered Data Streams ...59
3.9 Manipulate Loop Parameters to Optimize OpenMP Performance...65
4. Synchronization...69
4.1 Managing Lock Contention, Large and Small Critical Sections ...70
4.2 Use Synchronization Routines Provided by the Threading API Rather than Hand-Coded Synchronization...75
4.3 Win32 Atomics Versus User-Space Locks Versus Kernel Objects for Synchronization...78
4.4 Use Non-Blocking Locks when Possible ...82
4.5 Use a Double-Check Pattern to Avoid Lock Acquisition for One-Time Events...85
5. Memory Management...89
5.1 Avoiding Heap Contention among Threads...89
5.2 Use Thread-Local Storage to Reduce Synchronization...93
5.3 Offset Thread Stacks to Avoid Cache Conflicts on Intel Processors with Hyper-Threading Technology ...98
6. Investigating Poor Parallel Application Scaling...103
Software Tools for Root-Cause Analysis ...103
Preparing for Root Cause Analysis...104
Contributing Authors...104
6.1 Estimating the Degree of Parallelism for a Given Application and Workload...105
6.2 Identifying Load Imbalance among Threads and Processors...109
6.3 Analyzing Threading Design of Applications and Identifying Issues ... 112
6.4 Locking of Shared Resources ... 117
6.5 Identifying and Reducing Frequent Operating System Calls ...120
1.
Multithreading Consistency Guide
1.1 Motivation
The objective of the Multithreading Consistency Guide is to provide guidelines for developing efficient multithreaded applications across Intel-based symmetric
multiprocessors (SMP) and/or systems with Hyper-Threading Technology. An application developer can use the advice in this document to improve multithreading performance and minimize unexpected performance variations on current as well as future SMP architectures built with Intel® processors.
The first version of the Guide provides general advice on multithreaded performance. Hardware-specific optimizations have deliberately been kept to a minimum. In future versions of the Guide, topics covering hardware-specific optimizations will be added for developers willing to sacrifice portability for higher performance.
1.2 Prerequisites
Readers should have programming experience in a high-level language, preferably C, C++, and/or Fortran, though many of the recommendations in this document also apply to languages such as Java, C#, and Perl. Readers must also understand basic concurrent programming and be familiar with one or more threading methods, preferably OpenMP*, POSIX threads (also referred to as Pthreads), or the Win32* threading API.
1.3 Scope
The main objective of the Guide is to provide a quick reference to design and
optimization guidelines for multithreaded applications on Intel® platforms. This Guide is not intended to serve as a textbook on multithreading nor is it a porting guide to Intel platforms.
1.4 Organization
The Multithreading Consistency Guide covers topics ranging from general advice applicable to any multithreading method to usage guidelines for Intel® software products to API-specific issues. Each topic in the Multithreading Consistency Guide is designed to stand on its own. However, the topics fall naturally into four categories:
1. Programming Tools – This chapter describes how to use Intel software products to develop, debug, and optimize multithreaded applications.
2. Application Threading – This chapter covers general topics in parallel performance but occasionally refers to API-specific issues.
3. Synchronization – The topics in this chapter discuss techniques to mitigate the negative impact of synchronization on performance.
4. Memory Management – Threads add another dimension to memory management that should not be ignored. This chapter covers memory issues that are unique to
multithreaded applications.
Though each topic is a standalone discussion of some issue important to threading, many topics complement each other. Cross-references to related topics are provided throughout.
Editors
Henry Gabb and Prasad Kakulavarapu
Authors
Clay Breshears, Aaron Coday, Martyn Corden, Henry Gabb, Judi Goldstein, Bruce Greer, Grant Haab, Jay Hoeflinger, Prasad Kakulavarapu, Phil Kerly, Bill Magro, Paul Petersen, Sanjiv Shah, Vasanth Tovinkere
Reviewers
Clay Breshears, Henry Gabb, Grant Haab, Jay Hoeflinger, Peggy Irelan, Lars Jonsson, Prasad Kakulavarapu, Rajiv Kapoor, Bill Magro, Paul Petersen, Tim Prince, Sanjiv Shah, Vasanth Tovinkere
Technical Writers
Shihjong Kuo and Jack Thornton
Intel
®Multithreading Consistency Working Group Chairs
2. Intel
®Software
Development Products
Intel software development products enable developers to rapidly thread their applications, assist in debugging, and tune multithreaded performance on Intel processors. The product suite supports multiple threading methods, listed here in increasing order of complexity – automatic parallelization, compiler-directed threading with OpenMP, and manual threading using standard libraries such as Pthreads and the Win32 threading API.
This chapter introduces the components of Intel’s software development suite by
presenting a high-level overview of each product and its key features. The Intel software development suite consists of the following products:
y Intel® C/C++ and Fortran Compilers
y Intel® Performance Libraries
y Intel® VTune™ Performance Analyzer
y Intel® Thread Checker
y Intel Thread Profiler
For more information on Intel software development products, please refer to the following web site: http://www.intel.com/software/products.
The Intel® Software College provides training in all Intel products as well as instruction in multithreaded programming. Please refer to the following web site for more
information on the Intel Software College: https://shale.intel.com/softwarecollege.
Intel
®C/C++ and Fortran Compilers
In addition to high-level code optimizations, the Intel compilers also enable threading through automatic parallelization and OpenMP support. With automatic parallelization, the compiler detects loops that can be safely and efficiently executed in parallel and generates multithreaded code. OpenMP allows programmers to express parallelism using compiler directives and C/C++ preprocessor pragmas.
Intel
®Performance Libraries
The Intel® Math Kernel Library (MKL) and Intel® Integrated Performance Primitives
(IPP) provide consistent performance across all Intel® microprocessors. MKL provides support for BLAS, LAPACK, and vector math functions. All level-2 and level-3 BLAS functions are threaded with OpenMP. IPP is a cross-platform software library which provides a range of library functions for multimedia, audio and video codecs, signal and image processing, speech compression, and computer vision plus math support routines. IPP is optimized for Intel microprocessors and many of its component functions are already threaded with OpenMP.
Intel® VTune™ Performance Analyzer
The VTune Performance Analyzer helps developers tune their applications for optimum performance on Intel® architectures. The VTune performance counters monitor events inside Intel microprocessors to give a detailed view of application behavior, which helps identify performance bottlenecks. VTune provides time- and event-based sampling, call-graph profiling, hotspot analysis, a tuning assistant, and many other features to assist performance tuning. It also has an integrated source viewer to link profiling data to precise locations in source code.
Intel
®Thread Checker
The Intel Thread Checker facilitates debugging of multithreaded programs by
automatically finding common errors such as storage conflicts, deadlock, API violations, inconsistent variable scope, thread stack overflows, etc. The non-deterministic nature of concurrency errors makes them particularly difficult to find with traditional debuggers. Thread Checker pinpoints error locations down to the source lines involved and provides stack traces showing the paths taken by the threads to reach the error. It also identifies the variables involved.
Intel
Thread Profiler
The Intel Thread Profiler facilitates analysis of applications written using Win32
threading API, Posix Threading API or OpenMP pragmas. The OpenMP Thread Profiler provides details on the time spent in serial regions, parallel regions, and critical sections and graphically displays performance bottlenecks due to load imbalance, lock contention, and parallel overhead in OpenMP applications. Performance data can be displayed for the whole program, by region, and even down to individual threads.
The Win32 API or Posix Threads API Thread Profiler facilitates understanding the threading patterns in multi-threaded software by visual depiction of thread hierarchies and their interactions. It will also help identify and compare the performance impact of different synchronization methods, different numbers of threads, or different algorithms. Since Thread Profiler plugs in to the VTune Performance analyzer, multiple runs across different number of processors can be compared to determine the scalability profile. It also helps locate synchronization constructs that directly impact execution time and correlates to the corresponding source line in the application.
2.1
Automatic Parallelization with Intel Compilers
Category
Software
Scope
Applications built with the Intel compilers for deployment on symmetric multiprocessors (SMP) and/or systems with Hyper-Threading Technology (HT).
Keywords
Auto-parallelization, data dependences, programming tools, compiler
Abstract
Multithreading an application to improve performance can be a time consuming activity. For applications where most of the computation is carried out in simple loops, the Intel compilers may be able to generate a multithreaded version automatically.
Background
The Intel C++ and Fortran compilers have the ability to analyze the dataflow in loops to determine which loops can be safely and efficiently executed in parallel. Automatic parallelization can sometimes result in shorter execution times on SMP and HT-enabled systems. It also relieves the programmer from:
y Searching for loops that are good candidates for parallel execution
y Performing dataflow analysis to verify correct parallel execution
y Adding parallel compiler directives manually.
Adding the -Qparallel (Windows*) or -parallel (Linux*) option to the compile
command is the only action required of the programmer. However, successful parallelization is subject to certain conditions that are described in the next section. The following Fortran program contains a loop with a high iteration count:
PROGRAM TEST PARAMETER (N=100000000) REAL A, C(N) DO I = 1, N A = 2 * I – 1 C(I) = SQRT(A) ENDDO PRINT*, N, C(1), C(N) END
Dataflow analysis confirms that the loop does not contain data dependencies. The compiler will generate code that divides the iterations as evenly as possible among the threads at runtime. The number of threads defaults to the number of processors but can be set independently via the OMP_NUM_THREADS environment variable. The parallel speed-up
for a given loop depends on the amount of work, the load balance among threads, the overhead of thread creation and synchronization, etc. but will, in general, be less than the number of threads. For a whole program, speed-up depends on the ratio of parallel to serial computation (see any good textbook on parallel computing for a description of Amdahl’s Law).
Advice
Three requirements must be met for the compiler to parallelize a loop. First, the number of iterations must be known before entry into a loop so that the work can be divided in advance. A while-loop, for example, usually cannot be made parallel. Second, there can be no jumps into or out of the loop. Third, and most important, the loop iterations must be independent. In other words, correct results most not logically depend on the order in which the iterations are executed. There may, however, be slight variations in the accumulated rounding error, as, for example, when the same quantities are added in a different order. In some cases, such as summing an array or other uses of temporary scalars, the compiler may be able to remove an apparent dependency by a simple transformation.
Potential aliasing of pointers or array references is another common impediment to safe parallelization. Two pointers are aliased if both point to the same memory location. The compiler may not be able to determine whether two pointers or array references point to the same memory location, for example, if they depend on function arguments, run-time data, or the results of complex calculations. If the compiler cannot prove that pointers or array references are safe and that iterations are independent, it will not parallelize the loop, except in limited cases when it is deemed worthwhile to generate alternative code paths to test explicitly for aliasing at run-time. If the programmer knows that
parallelization of a particular loop is safe, and that potential aliases can be ignored, this can be communicated to the compiler with a C pragma (#pragma parallel) or Fortran
directive (!DIR$ PARALLEL). An alternative way in C to assert that a pointer is not aliased
is to use the restrict keyword in the pointer declaration, along with the -Qrestrict
(Windows) or -restrict (Linux) command-line option. However, the compiler will
never parallelize a loop that it can prove to be unsafe.
The compiler can only effectively analyze loops with a relatively simple structure. For example, it cannot determine the thread-safety of a loop containing external function calls because it does not know whether the function call has side effects that introduce
dependences. Fortran 90 programmers can use the PURE attribute to assert that
subroutines and functions contain no side effects. Another way, in C or Fortran, is to invoke inter-procedural optimization with the -Qipo (Windows) or -ipo (Linux) compiler
option. This gives the compiler the opportunity to analyze the called function for side effects.
When the compiler is unable to parallelize automatically loops that the programmer knows to be parallel, OpenMP should be used. In general, OpenMP is the preferred solution because the programmer typically understands the code better than the compiler and can express parallelism at a coarser granularity (see 3.2: Granularity and Parallel
Performance). On the other hand, automatic parallelization can be effective for nested loops, such as those in a matrix multiply. Moderately coarse-grained parallelism results from threading of the outer loop, allowing the inner loops to be optimized for fine-grained parallelism using vectorization or software pipelining.
Just because a loop can be parallelized does not mean that it should be parallelized. The compiler uses a threshold parameter to decide whether to parallelize a loop. The
-Qpar_threshold[n] (Windows) and -par_threshold[n] (Linux) compiler options
adjust this parameter. The value of n ranges from 0 to 100, where 0 means to always
parallelize a safe loop and 100 tells the compiler to only parallelize those loops for which a performance gain is highly probable. The default value of n is 75.
The switches -Qpar_report[n] (Windows) or -par_report[n] (Linux), where n is 1 to
3, can be used to learn which loops were parallelized. Look for messages such as:
test.f90(6) : (col. 0) remark: LOOP WAS AUTO-PARALLELIZED
The compiler will also report which loops could not be parallelized and the reason why, e.g.:
serial loop: line 6
flow data dependence from line 7 to line 8, due to “c”
This is illustrated by the following example:
void add (int k, float *a, float *b) {
for (int i = 1; i < 10000; i++) a[i] = a[i+k] + b[i];
}
The compile command ‘icl -c -Qparallel -Qpar_report3 add.cpp’ results in the
following messages:
add.cpp
procedure: add serial loop: line 2
anti data dependence assumed from line 2 to line 2, due to "a" flow data dependence assumed from line 2 to line 2, due to "a" flow data dependence assumed from line 2 to line 2, due to "a"
Because the compiler does not know the value of k, it must assume that the iterations
depend on each other, as for example if k equals -1. However, the programmer may know
otherwise, due to specific knowledge of the application (e.g., k always greater than
10000), and can override the compiler by inserting a pragma:
void add (int k, float *a, float *b) {
#pragma parallel
for (int i = 1; i < 10000; i++) a[i] = a[i+k] + b[i];
The messages now show that the loop is parallelized:
add.cpp
add.cpp(3) : (col. 3) remark: LOOP WAS AUTO-PARALLELIZED. procedure: add
parallel loop: line 3 shared: {"b", "a", "k"} private: {"i"}
first private: { } reductions: { }
However, it is now the programmer’s responsibility not to call this function with a value of k that is less than 10000, as this could lead to incorrect results.
Usage Guidelines
Try building the computationally intensive kernel of your application with the -parallel
(Linux) or -Qparallel (Windows) compiler switch. Enable reporting with -par_report3
(Linux) or -Qpar_report3 (Windows) to find out which loops were parallelized and
which loops could not be parallelized. For the latter, try to remove data dependencies and/or help the compiler disambiguate potentially aliased memory references.
The transformations necessary to parallelize a loop may sometimes impact other high-level optimizations (e.g., loop inversion). This can often be recognized from the compiler optimization reports. Always measure performance with and without parallelization to verify that a useful speedup is being achieved.
If -openmp and -parallel are both specified on the same command line, the compiler
will only attempt to parallelize those functions that do not contain OpenMP directives. For builds with separate compiling and linking steps, be sure to link the OpenMP runtime library when using automatic parallelization. The easiest way to do this is to use the compiler driver for linking, e.g.: icl -Qparallel (IA-32 Windows) or efc -parallel
(Itanium® processor for Linux).
References
In this manual, see also:
2.2: Multithreaded Functions in the Intel Math Kernel Library
2.5: Using Thread Profiler to Evaluate OpenMP Performance 3.2: Granularity and Parallel Performance
See also:
• The Intel® C++ Compiler User’s Guide or The Intel® Fortran Compiler User’s Guide, see “Compiler Optimizations/Parallelization/Automatic Parallelization”
• “Efficient Exploitation of Parallelism on Pentium®III and Pentium 4 Processor-Based Systems”, Aart Bik, Milind Girkar, Paul Grey and Xinmin Tian, Intel Technology Journal
• http://www.intel.com/technology/itj/q12001/articles/art_6.htm
• The Intel Software College provides extensive training material on Intel software development products.
2.2
Multithreaded Functions in the
Intel Math Kernel Library
Category
Software
Scope
Applicable to 32-bit processors from the Pentium processor through the Intel® Xeon™
processor and to the Intel® Itanium® processor family on both the Windows and Linux
operating systems
Keywords
Math Kernel Library, BLAS, LAPACK, FFT, programming tools
Abstract
A number of key and appropriate routines within the Intel Math Kernel Library (MKL) have been threaded to provide increased performance on systems with multiple
processors in a shared-memory environment. We will show that the use of this library makes available to the user an easy way to get high performance on key algorithms both on single processor systems and on multiprocessor systems. The user need only tell the system how many processors to use.
Background
A great deal of scientific code can be parallelized, but not all of it will run faster on multiple processors on an SMP system because there is inadequate memory bandwidth to support the operations. Fortunately, important elements of technical computation in finance, engineering and science rely on arithmetic operations that can effectively use cache, which reduces the demands on the memory system. The basic condition that must be met in order for multiple processors to be effectively used on a task is that the reuse of data in cache must be high enough to free the memory bus for the other processors. Operations such as factorization of dense matrices and matrix multiplication (a key element in factorization) can meet this condition if the operations are structured properly. It may be possible to get a substantial percentage of peak performance on a processor simply by compiling the code, possibly along with some high-level code optimizations. However, if the resulting code relies heavily on memory bandwidth, then it probably will not scale well when the code is parallelized because, it will not scale well because there will be inadequate cache usage, and with that, inadequate memory bandwidth to supply all the processors.
Widely used functions such as the level-3 BLAS (basic linear algebra subroutines) (all matrix-matrix operations), many of the LAPACK (linear algebra package) functions, and, to a lesser degree, DFT’s (discrete Fourier transforms) all can reuse data in cache
Advice
There are really two parts to the advice. First, wherever possible the user should employ the widely used, de facto standard functions from BLAS and LAPACK since these are available in source code form (the user can build them) and many hardware vendors supply optimized versions of these functions for their machines. Just linking to the high-performance library may improve the high-performance of an application substantially, depending on the degree to which the application depends on LAPACK, and by implication, the BLAS (since LAPACK is built on the BLAS).
MKL is Intel’s library containing these functions. The level-3 BLAS have been tuned for high performance on a single processor but have also been threaded to run on multiple processors and to give good scaling when more than one processor is used. Key functions of LAPACK have also been threaded. Good performance on multiple processors is possible just with the threaded BLAS but threading LAPACK improves performance for smaller-sized problems. The LINPACK benchmark, which solves a set of equations, demonstrates well the kind of scaling that threading of these functions can yield. This benchmark employs two high-level functions from LAPACK – a factorization and a solving routine. Most of the time is spent in the factorization. For the largest test problem, MKL achieved a 3.84 speedup on four processors, or 96% parallel efficiency.
In addition to these threaded routines, the DFT’s are also threaded and scale very well. For example, on 1280x1280 single precision complex 2D transforms, the performance on the Itanium 2 processor for one, two, and four processors is respectively 1908, 3225 (1.69 speedup), and 7183 MFLOPS (3.76 speedup).
Usage Guidelines
There are caveats in the use of these functions with the current releases of MKL (up through MKL 6.0 beta update) that have nothing to do with the library directly. Problems can arise depending on the environment.
OpenMP is used to thread MKL. MKL uses the same OpenMP runtime library as the Intel compilers. Therefore, problems can arise when OpenMP applications that use MKL are not compiled with the Intel compilers. Specifically, the application will attempt to use two different OpenMP libraries, one from the non-Intel compiler and the other from MKL. When the OMP_NUM_THREADS environment variable is greater than one, chaos
results when both libraries attempt to create threads and the program will fail. A future version of MKL will provide an alternate means of controlling thread creation. In the meantime, if this problem is encountered, the issue should be submitted to Intel through
http://premier.intel.com for an interim solution.
A second issue can arise on clusters with symmetric multiprocessor nodes1. MPI or PVM applications running on such clusters often create one process for each processor in a node. If these applications use MKL, threads may also be created by each MPI or PVM
1 A node is defined as a computer with an operating system image. In a typical cluster, an operating system
process. This could result in over-subscription of processor resources within a node. For MPI or PVM applications that create one process per processor, it is recommended that
OMP_NUM_THREADS be set to one. References
In this manual, see also:
2.1: Automatic Parallelization with Intel Compilers
2.5: Using Thread Profiler to Evaluate OpenMP Performance See also:
• The Intel Math Kernel Library can be obtained at
http://developer.intel.com/software/products/perflib/.
• The Intel Software College provides extensive training material on Intel software development products.
2.3
Avoiding and Identifying False Sharing Among
Threads with the VTune Performance Analyzer
Category
Software
Scope
General multithreading
Keywords
VTune, cache coherence, data alignment, profiler, programming tools
Abstract
In symmetric multiprocessors (SMP), each processor has a local cache. The memory system must guarantee cache coherence. False sharing occurs when threads on different processors modify different variables that reside on the same cache line. Each write will invalidate the line in other caches, forcing an update and hurting performance. This topic covers methods to detect and correct false sharing using the Intel VTune Performance Analyzer.
Background
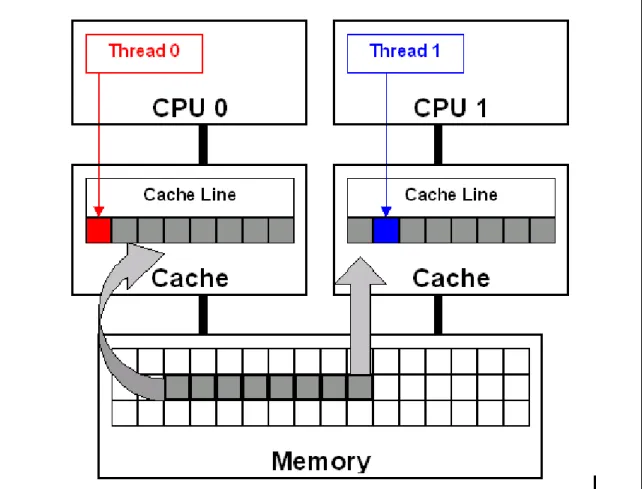
False sharing is a well-known performance issue on SMP where each processor has a local cache. It occurs when threads on different processors modify variables that reside on the same cache line, as illustrated in. The reason this is called false sharing is because each thread is not actually sharing access to the same variable. Access to the same variable, or true sharing, would require programmatic synchronization constructs to ensure ordered data access.
The source line highlighted in red in the following example code causes false sharing:
double sum=0.0, sum_local[NUM_THREADS];
#pragma omp parallel num_threads(NUM_THREADS) {
int me = omp_get_thread_num(); sum_local[me] = 0.0;
#pragma omp for
for (i = 0; i < N; i++)
sum_local[me] += x[i] * y[i];
#pragma omp atomic sum += sum_local[me]; }
There is a potential for false sharing on array sum_local. This array is dimensioned
according to the number of threads and is small enough to fit in a single cache line. When executed in parallel, the threads modify different, but adjacent, elements of sum_local
(the source line highlighted in red), which invalidates the cache line for all processors.
Figure 1: False sharing occurs when threads on different processors modify variables that reside on the same cache line. This invalidates the cache line and forces a memory update to maintain cache coherency. This is illustrated in the diagram (top). Threads 0 and 1 require variables that are adjacent
in memory and reside on the same cache line. The cache line is loaded into the caches of CPU 0 and CPU 1 (gray arrows). Even though the threads modify different variables (red and blue arrows), the
cache line is invalidated. This forces a memory update to maintain cache coherency.
To ensure data consistency across multiple caches, Intel multiprocessor-capable
processors follow the MESI (Modified/Exclusive/Shared/Invalid) protocol. On first load of a cache line, the processor will mark the cache line as ‘Exclusive’ access. As long as the cache line is marked exclusive, subsequent loads are free to use the existing data in cache. If the processor sees the same cache line loaded by another processor on the bus, it marks the cache line with ‘Shared’ access. If the processor stores a cache line marked as ‘S’, the cache line is marked as ‘Modified’ and all other processors are sent an ‘Invalid’ cache line message. If the processor sees the same cache line which is now marked ‘M’ being accessed by another processor, the processor stores the cache line back to memory
and marks its cache line as ‘Shared’. The other processor that is accessing the same cache line incurs a cache miss.
The frequent coordination required between processors when cache lines are marked ‘Invalid’ require cache lines to be written to memory and subsequently loaded. False sharing increases this coordination and can significantly degrade application
performance.
Advice
The basic advice of this section is to avoid false sharing in multithreaded applications. However, detecting false sharing when it is already present is another matter. The first method of detection is through code inspection. Look for instances where threads access global or dynamically allocated shared data structures. These are potential sources of false sharing. Note that false sharing can be obscure in that threads are accessing completely different global variables that just happen to be relatively close together in memory. Thread-local storage or local variables can be ruled out as sources of false sharing.
A better detection method is to use the Intel VTune Performance Analyzer. For multiprocessor systems, configure VTune analyzer to sample the ‘2nd Level Cache Load Misses Retired’ event. For Hyper-Threading enabled processors, configure
VTune analyzer to sample the ‘Memory Order Machine Clear’ event. If you have a high occurrence and concentration of these events at or near load/store instructions within threads, you likely have false sharing. Inspect the code to determine the likelihood that the memory locations reside on the same cache line.
Once detected, there are several techniques to correct false sharing. The goal is to ensure that variables causing false sharing are spaced far enough apart in memory that they cannot reside on the same cache line. Not all possible techniques are discussed here. Below are three possible methods.
One technique is to use compiler directives to force individual variable alignment. The following source code demonstrates the compiler technique using ‘__declspec
(align(n))’ where n equals 16 (128 byte boundary) to align the individual variables on
cache line boundaries.
__declspec (align(16)) int thread1_global_variable; __declspec (align(16)) int thread2_global_variable;
When using an array of data structures, pad the structure to the end of a cache line to ensure that the array elements begin on a cache line boundary. If you cannot ensure that the array is aligned on a cache line boundary, pad the data structure to twice the size of a cache line. The following source code demonstrates padding a data structure to a cache line boundary and ensuring the array is also aligned using the compiler ‘__declspec (align(n))’ statement where n equals 16 (128 byte boundary). If the array is
dynamically allocated, you can increase the allocation size and adjust the pointer to align with a cache line boundary.
struct ThreadParams {
// For the following 4 variables: 4*4 = 16 bytes unsigned long thread_id;
unsigned long v; // Frequent read/write access variable unsigned long start;
unsigned long end;
// expand to 128 bytes to avoid false-sharing // (4 unsigned long variables + 28 padding)*4 = 128
int padding[28];
};
__declspec (align(16)) struct ThreadParams Array[10];
It is also possible to reduce the frequency of false sharing by using thread-local copies of data. The thread-local copy can be read and modified frequently, and the result copied back to the data structure only when complete. The following source code demonstrates using a local copy to avoid false sharing.
struct ThreadParams {
// For the following 4 variables: 4*4 = 16 bytes unsigned long thread_id;
unsigned long v; //Frequent read/write access variable unsigned long start;
unsigned long end; };
void threadFunc(void *parameter) {
ThreadParams *p = (ThreadParams*) parameter; // local copy for read/write access variable unsigned long local_v = p->v;
for(local_v = p->start; local_v < p->end; local_v++) {
// Functional computation }
p->v = local_v; // Update shared data structure only once }
Usage Guidelines
Avoid false sharing but use these techniques sparingly. Overuse of these techniques, where they are not needed, can hinder the effective use of the processor’s available cache. Even with multiprocessor shared-cache designs, it is recommended that you avoid false sharing. The small potential gain for trying to maximize cache utilization on
multi-processor shared cache designs does not generally outweigh the software maintenance costs required to support multiple code paths for different cache architectures.
References
In this manual, see also:
2.5: Using Thread Profiler to Evaluate OpenMP Performance
5.3: Offset Thread Stacks to Avoid Cache Conflicts on Intel Processors with Hyper-Threading Technology
The Intel Software College provides extensive training material on Intel software development products. The online course “Getting Started with the VTune Performance Analyzer” is recommended with respect to the present topic.
2.4
Find Multithreading Errors with the
Intel Thread Checker
Category
Software
Scope
Automated debugging of multithreaded applications in the Windows and Linux environments
Keywords
Thread Checker, VTune, debugger, programming tools, race conditions
Abstract
The Intel Thread Checker, one of the Intel Threading Tools, is used to debug
multithreading errors in applications that use Win32, PThreads or OpenMP threading models. Thread Checker automatically finds storage conflicts, deadlock or conditions that could lead to deadlock, thread stalls, abandoned locks, and more.
Background
Multithreaded programs have temporal component that makes them more difficult to debug than serial programs. Concurrency errors (e.g., data races, deadlock) are difficult to find and reproduce because they are non-deterministic. If the programmer is lucky, the error will always crash or deadlock the program. If the programmer is not so lucky, the program will execute correctly 99% of the time, or the error will result in slight numerical drift that only becomes apparent after long execution times.
Traditional debugging methods are poorly suited to multithreaded programs. Debugging probes (i.e., print statements) often mask errors by changing the timing of multithreading programs. Executing a multithreaded program inside a debugger can give some
information, provided the bugs can be consistently reproduced. However, the
programmer must sift through multiple thread states (i.e., instruction pointer, stack) to diagnose the error.
The Intel Thread Checker is designed specifically for debugging multithreaded programs. It finds the most common concurrent programming errors and pinpoints their locations in the program. All error examples shown below use examples from the Win32 application domain:
y Storage conflicts – The most common concurrency error involves unsynchronized modification of shared data. For example, multiple threads simultaneously
incrementing the same static variable can result in data loss but is not likely to crash the program. The next section shows how to use the Intel Thread Checker to find such errors.
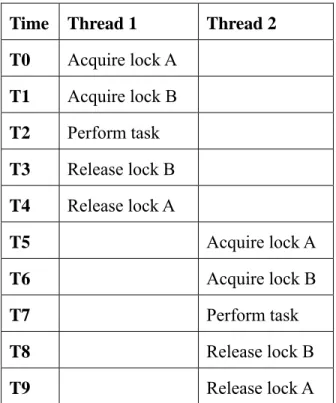
y Deadlock – When a thread must wait for a resource or event that will never occur, it is deadlocked. Bad locking hierarchies are a common cause. For example, a thread tries to acquire locks A and B, in that order, while another thread tries to acquire the locks in the reverse order. Sometimes the code executes without deadlock (Table 2.1).
Table 2.1: A bad locking hierarchy can sometimes execute without deadlock.
Time Thread 1 Thread 2 T0 Acquire lock A T1 Acquire lock B T2 Perform task T3 Release lock B T4 Release lock A T5 Acquire lock A T6 Acquire lock B T7 Perform task T8 Release lock B T9 Release lock A
However, this locking hierarchy can also deadlock both threads (Table 2.2). Both threads are waiting for resources that they can never acquire. Thread Checker
identifies deadlock and the potential for deadlock, as well as the contested resources.
Table 2.2: Deadlock due to a bad locking hierarchy.
Time Thread 1 Thread 2 T0 Acquire lock A
T1 Acquire lock B
T2 Wait for lock A
T3 Wait for lock B
y Abandoned locks – Thread Checker detects when a thread terminates while holding a Win32 critical section or mutex variable because this can lead to deadlock or
unexpected behavior. Threads waiting on an abandoned critical section are deadlocked. Abandoned mutexes are reset.
y Lost signals – Thread Checker detects when a Win32 event variable is pulsed (i.e., the Win32 PulseEvent function) when no threads are waiting on that event because this
is a common symptom of deadlock. For example, the programmer expects a thread to be waiting before an event is pulsed. If the event is pulsed before the thread arrives, the thread may wait for a signal that will never come.
Thread Checker also finds many other types of errors, including API usage violations, thread stack overflows, and scope violations.
Advice
Use the Intel Thread Checker to facilitate debugging of OpenMP, PThreads and Win32 multithreaded applications. Errors in multithreaded programs are harder to find than errors in serial programs not only because of the temporal component mentioned above, but also because such errors are not restricted to a single location. Threads operating in distant parts of the program can cause errors. Thread Checker can save an enormous amount of debugging time, as illustrated by the simple example shown below.
To prepare a program for Thread Checker analysis, compile with optimization disabled and debugging symbols enabled. Link the program with the /fixed:no option so that the
executable can be relocated. Thread Checker instruments the resulting executable image when it is run under the VTune Performance Analyzer, Intel’s performance tuning environment. For binary instrumentation, either the Microsoft Visual C++ compiler (version 6.0) or the Intel C++ and Fortran compilers (version 7.0 or later) may be used. However, the Intel compilers support source-level instrumentation (the /Qtcheck option),
which provides more detailed information.
The following program contains a subtle race condition:
#include <stdio.h> #include <windows.h>
#define THREADS 4
DWORD WINAPI ReportID (LPVOID my_id) {
printf (“Thread %d reporting\n”, *(int *)my_id); }
int main (int argc, char *argv[]) {
int id;
HANDLE h[THREADS];
DWORD barrier, thread_id;
for (id = 0; id < THREADS; id++) h[id] = CreateThread (NULL, 0,
ReportID, (LPVOID)&id, 0,
&thread_id);
barrier = WaitForMultipleObjects (THREADS, h, TRUE, INFINITE); }
The program is supposed to create four threads that report their identification numbers. Sometimes the program gives the expected output:
Thread 0 reporting Thread 1 reporting Thread 2 reporting Thread 3 reporting
Threads do not always report in the order of their identification numbers but all threads print a message. Other times, some threads appear to report more than once, others do not report at all, and a mysterious new thread appears, e.g.:
Thread 2 reporting Thread 3 reporting Thread 3 reporting Thread 4 reporting
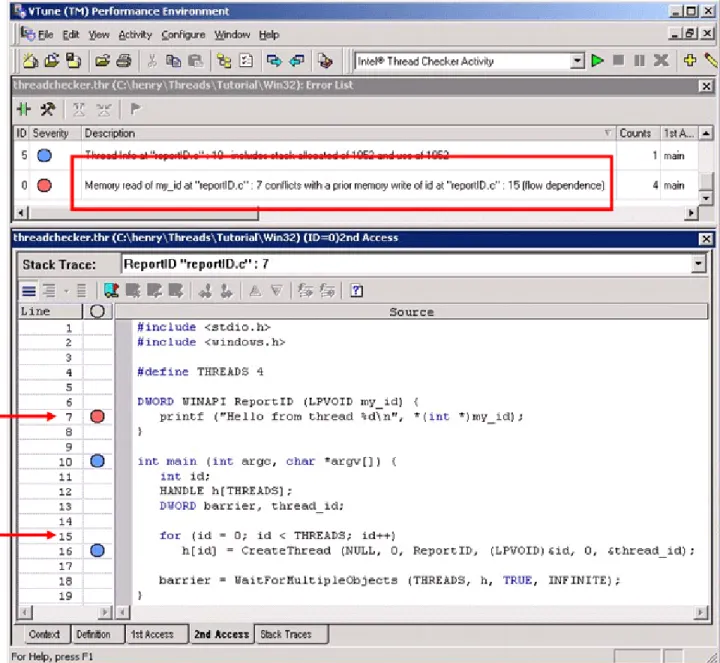
Thread Checker easily finds the error in this program and shows the statements responsible (Figure 2):
Figure 2: The Intel Thread Checker
The error description (see the red box in Figure 2) explains the storage conflict in plain English – a thread is reading variable my_id on line-7 while another thread is
simultaneously writing variable id on line-15. The variable my_id in function ReportID
is a pointer to variable id, which is changing in the main routine. The programmer
mistakenly assumes that a thread begins executing the moment it is created. However, the operating system may schedule threads in any order. The main thread can create all worker threads before any of them begin executing. Correct this error by passing each thread a pointer to a unique location that is not changing.
Usage Guidelines
Intel Thread Checker currently is available for the 32-bit versions of the Microsoft Windows 2000 and Windows XP operating systems, 32-bit and 64-bit versions of Linux operating systems. Thread Checker supports OpenMP, the Win32 threading API and the POSIX PThreads threading API. The Intel compilers are required for OpenMP support. They are also required for more detailed source-level instrumentation on 32-bit operating systems and the only mode available on 64-bit Linux operating systems.
Note that the Intel Thread Checker performs dynamic analysis, not static analysis. Thread Checker only analyzes code that is executed. Therefore, multiple analyses exercising different parts of the program may be necessary to ensure adequate code coverage. Thread Checker instrumentation increases the CPU and memory requirements of an application so choosing a small but representative test problem is very important.
Workloads with runtimes of a few seconds are best. Workloads do not have to be realistic. They just have to exercise the relevant sections of multithreaded code. For example, when debugging an image processing application, a 10 x 10 pixel image is sufficient for Thread Checker analysis. A larger image would take significantly longer to analyze but would not yield additional information. Similarly, when debugging a multithreaded loop, reduce the number of iterations.
References
• The Intel Thread Checker web site
• “Getting Started with the Intel Threading Tools,” distributed with Intel Threading Tools.
• “Intel Thread Checker Lab,” distributed with the Intel Threading Tools.
• The Intel Software College provides extensive training material on Intel software development products. The online course “Using the Intel Threading Tools” is recommended with respect to the present topic.
• Using Intel Thread Profiler for Win32 Threads: Philosophy and Theory • Using Intel Thread Profiler for Win32 Threads: Nuts and Bolts
2.5
Using Thread Profiler to Evaluate
OpenMP Performance
Category
Software
Scope
OpenMP performance tuning on Windows platforms
Keywords
Profiler, programming tools, OpenMP, VTune, parallel overhead
Abstract
Thread Profiler is one of the Intel Threading Tools. It is used to evaluate performance of
OpenMP threaded codes, identify performance bottlenecks, and gauge scalability of OpenMP applications.
Background
Once an application has been debugged and is running correctly, engineers often turn to performance tuning. Traditional profilers are of limited use for tuning OpenMP for a variety of reasons (unaware of OpenMP constructs, cannot report load imbalance, do not report contention for synchronization objects).
Thread Profiler is designed to understand OpenMP threading constructs and measure their performance over the whole application run, within each OpenMP region, and down to individual threads. Thread Profiler is able to detect and measure load imbalance (from uneven amounts of computation assigned to threads), time spent waiting for
synchronization objects as well as time spent in critical regions, time spent at barriers, and time spent in the Intel OpenMP Runtime Engine (parallel overhead).
Advice
To prepare an OpenMP application for use with the Thread Profiler, build an executable that includes the OpenMP profiling library (use /Qopenmp_profilecompiler switch).
When setting up a Thread Profiler Activity in VTune Performance Analyzer, be sure to use a full, production data set running with an appropriate number of threads. Best results for production performance tuning will be obtained using a representative data set that exercises the code as close to normal as possible. Small, test data sets may not fully exercise the parallelism of the code or the interaction between threads, which can lead to overlooking serious performance problems. While the execution time will be increased by the instrumentation of the OpenMP threads, this increase is minimal.
Once the application has completed execution, summary performance results are displayed in the Thread Profiler window. There are three graphical views of the
performance data that can be used. Each is accessible from separate tabs found below the Legend pane. These three views are summarized below:
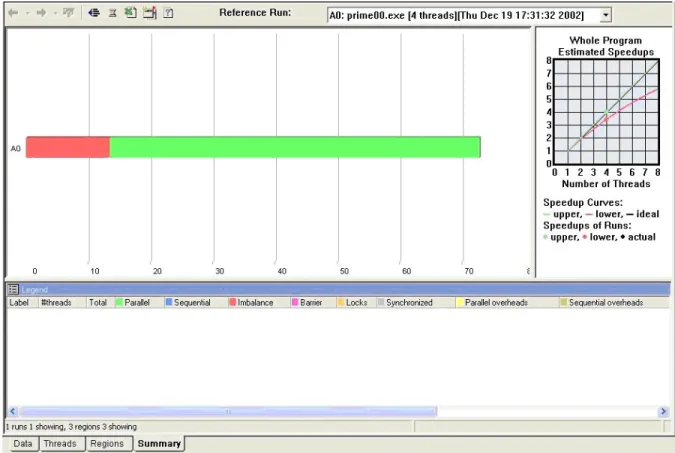
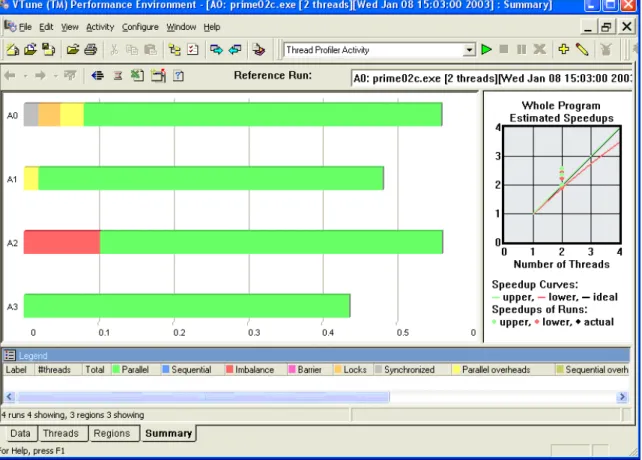
y Summary View – This view is the default for the Thread Profiler (Figure 3). The
histogram bar is divided into a number of regions indicating the average amount of time the application spent in the observed performance category. These performance categories are:
o parallel execution (time within OpenMP parallel regions) in green, o sequential time in blue,
o idle time due to load imbalance between threads in red, o idle time waiting at barriers in purple,
o idle time spent waiting to gain access to synchronization objects in orange, o time spent executing within critical regions in gray, and
o parallel (time spent in OpenMP Runtime Engine) and sequential (time
spent in OpenMP regions that are not executed in parallel) overheads in yellow and olive, respectively.
Left clicking on the bar will populate the legend with numerical details about total execution time for each category over the entire run of the application.
Figure 3: Summary View in Thread Profiler
Of course, the best possible display is a histogram that is mostly green with minimal amounts of blue sequential time. Large amounts of other colors within the summary histogram are an indication of performance problems. The severity of any problems noted will depend on the type of problem cited and the actual amount of time spent in
that category. Relatively small performance problems may be tolerable, especially if it is determined that no easy fix would be possible due to algorithmic implementation. The Summary View can also be used to compare scalability of an application with varying numbers of threads. Just drag and drop different activity runs of the same code with the same data executed with different numbers of threads onto the Summary View. Besides showing scalability, some performance obstacles may manifest themselves as the number of threads is varied. For example, lock contention often increases as more threads are added, which can prevent some applications from scaling well even when adequate resources are available.
After deciding to pursue a performance problem seen in the Summary View, a more detailed analysis will need to be done in order to locate and identify the source of the problem. Examining the timing data through the Regions View does this.
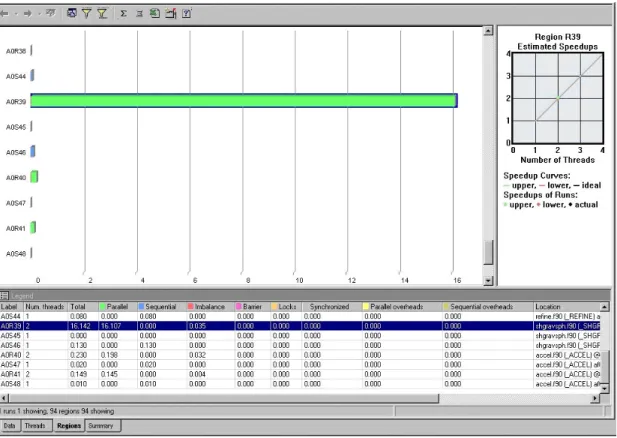
y Regions View: This view breaks down the summary data by each region within
the source code (Figure 4). These include the OpenMP parallel regions and the surrounding sequential regions. The Regions View gives you the power to
determine which parts of the code are causing the performance problems, whether it is one single region or all regions. Observation of large sequential regions could be used to identify portions of the code for further parallel development. Click on regional histograms in order to populate the Legend pane with numerical details about the time spent within each performance category. Multiple regions can be selected and compared in the Legend.
The Figure 4 shows a set of parallel and serial regions from an application. This view contains one parallel region (A0R39) that accounts for much of the time spent in the application, several smaller parallel regions, and several sequential regions. The sequential regions shown are too small to consider further
parallelization.
Right-clicking on a selected region histogram (surrounded with blue outline) pops up a menu dialog that includes an option to display source code. Thus, once you’ve determined a region that you wish to tune, you can find the corresponding source code for assessment of the cause and devise a solution. The source code locations for regions are also noted in the Legend pane.
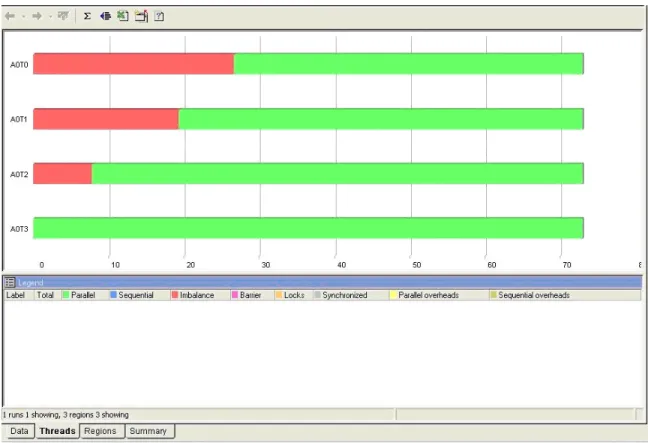
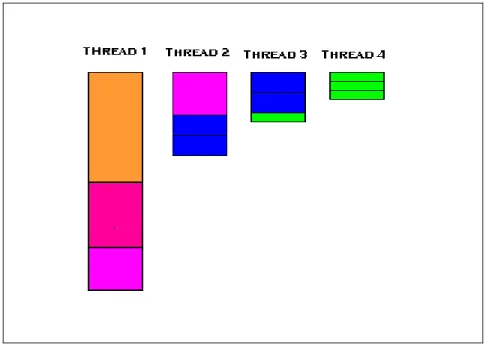
y Threads View: The Threads View gives a more detailed presentation of timing
characteristics of the application (Figure 5). A separate histogram will be present for each thread that was used in the execution. The data will, by default, be summary data for the entire run broken down to the performance of each thread. The master thread will be the only one with sequential time; all other thread histograms will be shorter by this sequential time.
Figure 5: Threads View in Thread Profiler
By starting with the Regions view and first filtering out all but the relevant region(s) of interest, the Threads View can then be used to focus on individual thread
performance within specific regions. This level of detail can give more clues as to the cause of performance problems. For instance, do all threads exhibit roughly the same
amount of performance overhead? Is the performance overhead only exhibited within a single thread? Or is there some other pattern of performance being seen?
In Figure 5, the Threads View has been filtered down to a single parallel region. You can see a “stair step” of load imbalance across the four threads used in the region. This performance relationship indicates a regular pattern of increasing computation over loop iterations. That is, successive loop iterations require more processing time than previous iterations. OpenMP uses static scheduling by default. Since the rise in computation time between iterations is fairly constant, static scheduling with a small chunk size will achieve good load balance and fix the performance bottleneck. If the variation of work for each loop iteration were less predictable, dynamic scheduling of the iterations would be more appropriate.
Usage Guidelines
The Thread Profiler currently supports OpenMP threaded codes running on Microsoft Windows operating systems for 32-bit architectures and Linux operating systems running on 32-bit and 64-bit architectures. The Intel 7.1 compilers or higher are needed to be able to compile for OpenMP threading and to have the OpenMP profiling library available.
References
In this manual, see also:
2.3: Avoiding and Identifying False Sharing Among Threads with the VTune Performance Analyzer
3.2: Granularity and Parallel Performance 3.3: Load Balance and Parallel Performance
3.8: Exploiting Data Parallelism in Ordered Data Streams
3.9: Manipulate Loop Parameters to Optimize OpenMP Performance 4.1: Managing Lock Contention, Large and
Small Critical Sections
5.2: Use Thread-Local Storage to Reduce Synchronization
See also:
• The Thread Profiler web site
• “Getting Started with the Intel Threading Tools,” distributed with Intel Threading Tools.
• The Intel Software College provides extensive training material on Intel software development products. The online course “Using the Intel Threading Tools” is recommended with respect to the present topic.
3. Application
Threading
This chapter covers general topics in application threading, particularly with respect to parallel performance. The topics occasionally refer to API-specific issues but much of the advice applies to any parallel programming method.
The chapter begins with a discussion of data vs. functional decomposition. The opening topic gives advice on choosing the most appropriate threading method for either parallel model. This is followed by topics on granularity and load balance. These are critical issues in parallel programming because they directly affect the efficiency and scalability of a multithreaded application.
Tailoring thread behavior to a particular runtime environment is often overlooked in multithreaded programs. On a single-user system, for example, allowing idle threads to spin may be more efficient than putting them to sleep. On shared systems, however, forcing idle threads to yield the CPU may be more efficient. The issues involved in threading for high turnaround vs. high throughput are discussed.
Many algorithms contain optimizations that benefit serial performance but inadvertently introduce dependencies that inhibit parallelism. It is often possible to remove such dependencies through simple transformations. Techniques for exposing parallelism by avoiding or removing artificial dependencies are discussed.
The next two topics describe how to choose an appropriate number of threads and how to minimize overhead due to thread creation. Creating too many threads hurt performance for many reasons, including increased system overhead, decreased granularity, increased lock contention, etc. Therefore, it is a good idea to control the number of threads through runtime heuristics and thread pools. Heuristics allow the programmer to create threads based on workload requirements that may not be known until runtime. Thread pools to limit the overhead of thread creation is described. The advice in this topic is primarily for applications threaded with Pthreads or the Win32 thread API. Thread pools are already used in the Intel OpenMP implementation.
The chapter closes with techniques for handling order-dependent output and loop optimizations designed to boost OpenMP performance.
3.1
Choosing an Appropriate Threading Method:
OpenMP Versus Explicit Threading
Category
Application Threading
Scope
General multithreading
Keywords
OpenMP, POSIX threads, Pthreads, Win32 threads, data parallelism, functional decomposition
Abstract
Of the two most common approaches to multithreading, compiler-based and library-based methods, neither is appropriate to all situations. Compiler-based threading methods like
OpenMP are best suited to data parallelism. Methods based on threading libraries, primarily the Win32 and POSIX thread API’s, are best suited to functional
decomposition.
Background
Programmers have used threads for many years to express the natural concurrency of their applications. For example, threads allow an application to continue processing while still receiving GUI input. Thus, the application is not frozen from the user’s perspective. On a symmetric multiprocessor and/or CPU’s with Hyper-Threading Technology, threads can significantly improve performance through parallel computing.
Broadly speaking, two threading methods are available (i.e., library-based and compiler-directed), each suited to a particular type of multithreaded programming. Library-based threading methods (the Win32 multithreading API on Windows and the Pthreads library on Linux) require the programmer to manually map concurrent tasks to threads. There is no explicit parent-child relationship between the threads – all threads are peers. This makes the threading model very general. The libraries also give the programmer control over low-level aspects of thread creation, management, and synchronization. This
flexibility is the key advantage of library-based threading methods but it comes at a price. Threading an existing serial application with a library-based method is an invasive
process requiring significant code modifications. Concurrent tasks must be encapsulated in functions that can be mapped to threads. POSIX and Win32 threads only accept one argument so it is often necessary to modify function prototypes and data structures. OpenMP, a compiler-based threading method, provides a high-level interface to the underlying thread libraries. With OpenMP, the programmer uses pragmas (or directives in the case of Fortran) to describe parallelism to the compiler. This removes much of the complexity of explicit threading because the compiler handles the details. OpenMP is less invasive too. Significant source code modifications are not usually necessary. A
non-OpenMP compiler simply ignores the pragmas, leaving the underlying serial code intact. However, much of the fine control over threads is lost. Among other things, OpenMP does not give the programmer a way to set thread priorities or perform event-based or inter-process synchronization. Also, OpenMP is a fork-join threading model with an explicit master-worker relationship among threads. This narrows the range of problems for which OpenMP is suited.
A typical word processor has many opportunities for concurrency. While the user is typing, several background tasks occur simultaneously without interrupting keyboard input. For example, the application periodically saves changes, checks spelling and grammar, and prints documents. This is a good example of functional decomposition, in which different tasks are mapped to threads for concurrent execution. The number of tasks determines the degree of concurrency. The generality and fine control of library-based methods makes them better suited to expressing this type of concurrency. For example, the thread handling keyboard input would be given higher priority than threads handling other, less critical tasks like printing.
OpenMP is designed to express data parallelism, in which threads perform the same task on different data. A web server is a good example of a data parallel application. The same task (servicing HTTP requests) is performed repeatedly on different data (web pages). In a data parallel problem, the amount of data determines the degree of parallelism. The spell checker in a word processor is a good example. The words of the document can be divided among threads, with each thread performing its comparisons independently. The amount of parallel work increases with the number of words in the document.
Advice
In general, OpenMP is best suited to expressing data parallelism while explicit threading methods (i.e., the Pthreads library and the Win32 threading API) are best suited to functional decomposition. Do not try to shoehorn explicit threading methods into a data parallel problem or vice versa, as the following examples illustrate. The following program calculates by numerical integration. The parallelism can be expressed with a single OpenMP pragma. (As mentioned previously, a non-OpenMP compiler will simply ignore the pragma, leaving the underlying serial code intact.)
#include <stdio.h> #define INTERVALS 100000 int main () { int i; float h, x, pi = 0.0; h = 1.0 / INTERVALS;
#pragma omp parallel for private(x) reduction(+:pi) for (i = 0; i < INTERVALS; i++)
{
x = h * (float(i) – 0.5); pi += 4.0 / (1.0 + x * x);
}
pi *= h;
printf (“Pi = %f\n”, pi); }
It is possible to express data parallelism with explicit threading methods like Pthreads or the Win32 threading API but it is not convenient:
#include <stdio.h> #include <pthreads.h>
#define INTERVALS 100000 #define THREADS 4
float global_sum = 0.0;
pthread_mutex_t global_lock = PTHREAD_MUTEX_INITIALIZER; void *pi_calc (void *num);
int main () {
pthread_t tid[THREADS]; int i, t_num[THREADS];
for (i = 0; i < THREADS; i++) {
t_num[i] = i;
pthread_create (&tid[i], NULL, pi_calc, &t_num[i]); }
for (i = 0; i < THREADS; i++) pthread_join (tid[i], NULL);
printf (“Pi = %f\n”, global_sum); }
void *pi_calc (void *num) {
int i, myid, start, end; float h, x, my_sum = 0.0;
myid = *(int *)num; h = 1.0 / INTERVALS;
start = (INTERVALS / THREADS) * myid; end = start + (INTERVALS / THREADS);
for (i = start; i < end; i++) {
my_sum += 4.0 / (1.0 + x * x); } pthread_mutex_lock (&global_lock); global_sum += my_sum; pthread_mutex_unlock (&global_lock); }
The size and complexity of the program is increased significantly and the original serial code is barely recognizable. Notice how the computation must be encapsulated in a function so that it can be mapped to threads. Within this function, the work must be manually divided among the threads.
Explicit threading methods are designed to express functional decomposition, where work is divided by task rather than data. With explicit threading methods, the
programmer manually maps concurrent tasks to threads. Consider the standard producer-consumer problem described in most concurrent programming textbooks. Coding a producer-consumer is straightforward with explicit threading API’s because the programmer can dynamically create and destroy threads. Also, synchronization is not limited to just data access. Threads can be made to wait for events. The lack of event-based synchronization makes even this simple problem difficult to code efficiently in OpenMP. The OpenMP sections pragma provides some ability to code functional
decomposition but the inherent fork-join threading model limits flexibility and scalability. Specifically, the number of parallel sections is fixed at compile-time so the number of producer and/or consumer threads cannot change dynamically at runtime as processor resources change. OpenMP also lacks the ability to assign priorities to threads.
Usage Guidelines
Portability should also be considered when choosing between OpenMP, Pthreads, or Win32 threads. OpenMP-compliant compilers are available for most operating systems, including Windows and Linux. Thread libraries, on the other hand, are not portable. Obviously, the Win32 API is only available on Microsoft operating systems. Even then there are slight differences in supported features between different versions of Windows. The same can be said of Pthreads on Linux and various other flavors of Unix.
Scalability should be taken into account when threading an application for parallel performance. Does parallelism increase with the number of independent tasks, the amount of data to be processed, or both? Consider an application with only two compute-intensive, independent tasks. On a multiprocessor system with four CPU’s, for example, mapping the tasks to Win32 or POSIX threads will only use half of the system. If the two tasks are data parallel, adding OpenMP to each task might be a better solution. However, if one task is data parallel and the other is not, an OpenMP-only solution will not give full system utilization (see Amdahl’s Law). A good solution for this example might be to map both independent tasks to a Win32 or POSIX thread then use OpenMP to express data parallelism within each task.
References
In this manual, see also:
3.2: Granularity and Parallel Performance 3.3: Load Balance and Parallel Performance
3.6: Use Workload Heuristics to Determine Appropriate Number of Threads at Runtime
3.8: Exploiting Data Parallelism in Ordered Data Streams See also:
• OpenMP C and C++ Application Program Interface (version 2.0), OpenMP
Architecture Review Board, March 2002.
• OpenMP Fortran Application Program Interface (version 2.0), OpenMP Architecture
Review Board, November 2000.
• “Multithreading: Taking Advantage of Intel Architecture-based Multiprocessor Workstations,” Intel White Paper, 1999.
• “Performance improvements on Intel architecture-based multiprocessor workstations: Multithreaded applications using OpenMP,” Intel White Paper, 2000.
• “Threading Methodology: Principles and Practices,” Intel Technical Report, 2002. • M. Ben-Ari, Principles of Concurrent Programming, Prentice-Hall International,
1982.
• David R. Butenhof, Programming with POSIX Threads, Addison-Wesley, 1997.
• Johnson M. Hart, Win32 System Programming (2nd Edition), Addison-Wesley, 2001.
• Jim Beveridge and Robert Wiener, Multithreading Applications in Win32, Addison-Wesley, 1997.