Edith Cowan University
Edith Cowan University
Research Online
Research Online
ECU Publications Post 2013
2017
Overview of Australian Aboriginal and Torres Strait Islander health
Overview of Australian Aboriginal and Torres Strait Islander health
status 2016
status 2016
Anomie
Edith Cowan University, anomie@ecu.edu.au
Michael Adams
Edith Cowan University, m.adams@ecu.edu.au
Trish Amaranti
Edith Cowan University, p.amaranti@ecu.edu.au
Jane Burns
Edith Cowan University, j.burns@ecu.edu.au
Samantha Burrow
Edith Cowan University, s.burrow@ecu.edu.au
See next page for additional authors
Follow this and additional works at:
https://ro.ecu.edu.au/ecuworkspost2013
Part of the
Public Health Commons
Australian Indigenous HealthInfoNet (2017). Overview of Australian Aboriginal and Torres Strait Islander health status 2016. Retrieved from: http://www.healthinfonet.ecu.edu.au/health-facts/overviews
Available here.
This Report is posted at Research Online. https://ro.ecu.edu.au/ecuworkspost2013/5406
Authors
Authors
Anomie, Michael Adams, Trish Amaranti, Jane Burns, Samantha Burrow, Neil Drew, Michelle Elwell, Jesse
John Fleay, Caitlin Gray, Millie Harford-Mills, Joanne Hoareau, Renee Lynch, Andrea Macrae, Juliette
Mundy, Christine Potter, Miranda Poynton, Kathy Ride, Avinna Trzesinski, Library Services, Graham Barker,
and Lawrence Rutherford
Core funding is
provided by the
Australian Department
Overview of Aboriginal and
Torres Strait Islander health status 2016
Core funding is provided by the Australian Government
The Australian Indigenous Health
InfoNet
The Australian Indigenous Health
InfoNet
’s mission is to contribute to improvements in Aboriginal and Torres
Strait Islander health by making relevant, high quality knowledge and information easily accessible to policy
makers, health service providers, program managers, clinicians and other health professionals (including
Aboriginal and Torres Strait Islander health workers and practitioners) and researchers. The Health
InfoNet
also
provides easy-to-read and summarised material for students and the general community.
The Health
InfoNet
achieves its mission by undertaking research into various aspects of Aboriginal and Torres
Strait Islander health and disseminating the results (and other relevant knowledge and information) mainly via
its Internet site (www.healthinfonet.ecu.edu.au). The research involves analysis and synthesis of data and other
information obtained from academic, professional, government and other sources. The Health
InfoNet
’s work
in knowledge exchange aims to facilitate the transfer of pure and applied research into policy and practice to
address the needs of a wide range of users.
Recognition statement
The Australian Indigenous Health
InfoNet
recognises and acknowledges the sovereignty of Aboriginal and
Torres Strait Islander peoples as the original custodians of the country. Aboriginal and Torres Strait cultures
are persistent and enduring, continuing unbroken from the past to the present, characterised by resilience
and a strong sense of purpose and identity despite the undeniably negative impacts of colonisation and
dispossession. Aboriginal and Torres Strait Islander people throughout the country represent a diverse range
of people, communities and groups each with unique identity, cultural practices and spirituality. We recognise
that the current health status of Aboriginal and Torres Strait Islander people has been significantly impacted
by past and present practices and policies. It is not our intention to homogenise in summary health data and
where possible we endeavour to disaggregate analyses to recognise geographical, social and cultural diversity.
We acknowledge and pay our deepest respects to Elders past and present throughout the country. In
particular, we pay our respects to the Whadjuk Noongar people of Western Australia on whose country our
offices are located.
Contact details
Director:
Professor Neil Drew
Address:
Australian Indigenous Health
InfoNet
Edith Cowan University
2 Bradford Street
Mount Lawley
Western Australia 6050
Telephone:
(08) 9370 6336
Facsimile:
(08) 9370 6022
Email:
healthinfonet@ecu.edu.au
Web:
www.healthinfonet.ecu.edu.au
© Australian Indigenous HealthInfoNet 2017
Overview of Aboriginal and
Torres Strait Islander health status, 2016
Publication team
Production Editor
Jane BurnsProduction coordinator
Christine PotterContributing authors 2016
Anomie Michael Adams Trish Amaranti Jane Burns Samantha Burrow Neil Drew Michelle Elwell Jesse John FleayCaitlin Gray Millie Harford-Mills Joanne Hoareau Renee Lynch Andrea MacRae Juliette Mundy Christine Potter Miranda Poynton Kathy Ride Avinna Trzesinski Library services Graham Barker Lawrence Rutherford
2017
Australian Indigenous HealthInfoNet
Perth, Western Australia
Suggested citation:
Australian Indigenous HealthInfoNet (2017) Overview of Aboriginal and Torres Strait Islander health status, 2016. Perth, WA: Australian Indigenous HealthInfoNet
Contents
Preface ����������������������������������������������������������������������������������������������������������������������������������������������������������������������������������������������������������������� iv
Acknowledgements ���������������������������������������������������������������������������������������������������������������������������������������������������������������������������������������������� iv
Tell us what you think! ������������������������������������������������������������������������������������������������������������������������������������������������������������������������������������������� iv
Key facts �������������������������������������������������������������������������������������������������������������������������������������������������������������������������������������������������������������� vi
Population ������������������������������������������������������������������������������������������������������������������������������������������������������������������������������������������������������� vi
Births and pregnancy outcomes �������������������������������������������������������������������������������������������������������������������������������������������������������������������������� vi
Mortality ���������������������������������������������������������������������������������������������������������������������������������������������������������������������������������������������������������� vi
Hospitalisation ������������������������������������������������������������������������������������������������������������������������������������������������������������������������������������������������� vi
Selected health conditions ��������������������������������������������������������������������������������������������������������������������������������������������������������������������������������� vii
Factors contributing to Aboriginal and Torres Strait Islander health ������������������������������������������������������������������������������������������������������������������������� ix
Introduction ���������������������������������������������������������������������������������������������������������������������������������������������������������������������������������������������������������� 1
Sources of information ����������������������������������������������������������������������������������������������������������������������������������������������������������������������������������������� 1
The context of Aboriginal and Torres Strait Islander health �������������������������������������������������������������������������������������������������������������������������������������� 2
The historical context of Aboriginal and Torres Strait Islander health ������������������������������������������������������������������������������������������������������������������������ 2
Indicators of Aboriginal and Torres Strait Islander social disadvantage ��������������������������������������������������������������������������������������������������������������������� 3
Healing: featured section ������������������������������������������������������������������������������������������������������������������������������������������������������������������������������������� 4
Aboriginal and Torres Strait Islander population ���������������������������������������������������������������������������������������������������������������������������������������������������� 4
Births and pregnancy outcomes ���������������������������������������������������������������������������������������������������������������������������������������������������������������������������� 6
Age of mothers ���������������������������������������������������������������������������������������������������������������������������������������������������������������������������������������������������� 7
Total fertility rates ����������������������������������������������������������������������������������������������������������������������������������������������������������������������������������������������� 7
Antenatal care ���������������������������������������������������������������������������������������������������������������������������������������������������������������������������������������������������� 7
Birthweight ������������������������������������������������������������������������������������������������������������������������������������������������������������������������������������������������������� 8
Mortality �������������������������������������������������������������������������������������������������������������������������������������������������������������������������������������������������������������� 8
Age-standardised death rates ������������������������������������������������������������������������������������������������������������������������������������������������������������������������������ 9
Expectation of life ���������������������������������������������������������������������������������������������������������������������������������������������������������������������������������������������� 10 Age at death ����������������������������������������������������������������������������������������������������������������������������������������������������������������������������������������������������� 11 Infant mortality ������������������������������������������������������������������������������������������������������������������������������������������������������������������������������������������������ 11 Causes of death ������������������������������������������������������������������������������������������������������������������������������������������������������������������������������������������������� 12 Maternal mortality �������������������������������������������������������������������������������������������������������������������������������������������������������������������������������������������� 13 Avoidable mortality ������������������������������������������������������������������������������������������������������������������������������������������������������������������������������������������ 13 Hospitalisation ����������������������������������������������������������������������������������������������������������������������������������������������������������������������������������������������������� 13 Separation rates ������������������������������������������������������������������������������������������������������������������������������������������������������������������������������������������������ 14
Age-specific separation rates ������������������������������������������������������������������������������������������������������������������������������������������������������������������������������ 15
Causes of hospitalisation ������������������������������������������������������������������������������������������������������������������������������������������������������������������������������������ 15
Potentially preventable hospitalisations ��������������������������������������������������������������������������������������������������������������������������������������������������������������� 16
Selected health conditions ����������������������������������������������������������������������������������������������������������������������������������������������������������������������������������� 16
Cardiovascular disease �������������������������������������������������������������������������������������������������������������������������������������������������������������������������������������� 16
Cancer ������������������������������������������������������������������������������������������������������������������������������������������������������������������������������������������������������������� 19
Diabetes ���������������������������������������������������������������������������������������������������������������������������������������������������������������������������������������������������������� 22
Social and emotional wellbeing (including mental health) ������������������������������������������������������������������������������������������������������������������������������������ 24
Kidney health (renal disease) ������������������������������������������������������������������������������������������������������������������������������������������������������������������������������ 27
Injury, including family violence ������������������������������������������������������������������������������������������������������������������������������������������������������������������������� 29
Respiratory disease �������������������������������������������������������������������������������������������������������������������������������������������������������������������������������������������� 31
Eye health ������������������������������������������������������������������������������������������������������������������������������������������������������������������������������������������������������� 32
Ear health and hearing ������������������������������������������������������������������������������������������������������������������������������������������������������������������������������������� 34
Oral health ������������������������������������������������������������������������������������������������������������������������������������������������������������������������������������������������������ 36
Disability ���������������������������������������������������������������������������������������������������������������������������������������������������������������������������������������������������������� 37
Communicable diseases ������������������������������������������������������������������������������������������������������������������������������������������������������������������������������������ 39
Tuberculosis ����������������������������������������������������������������������������������������������������������������������������������������������������������������������������������������������� 39
Hepatitis ���������������������������������������������������������������������������������������������������������������������������������������������������������������������������������������������������� 40
Pneumococcal disease ���������������������������������������������������������������������������������������������������������������������������������������������������������������������������������� 41
Meningococcal disease �������������������������������������������������������������������������������������������������������������������������������������������������������������������������������� 42
Sexually transmitted infections �������������������������������������������������������������������������������������������������������������������������������������������������������������������� 43
HIV/AIDS ���������������������������������������������������������������������������������������������������������������������������������������������������������������������������������������������������� 45
Skin diseases, infections and infestations ������������������������������������������������������������������������������������������������������������������������������������������������������� 45
Factors contributing to Aboriginal and Torres Strait Islander health ������������������������������������������������������������������������������������������������������������������������ 46
Selected health risk and protective factors ����������������������������������������������������������������������������������������������������������������������������������������������������������� 46
Environmental health ����������������������������������������������������������������������������������������������������������������������������������������������������������������������������������� 47 Nutrition ���������������������������������������������������������������������������������������������������������������������������������������������������������������������������������������������������� 48 Breastfeeding ��������������������������������������������������������������������������������������������������������������������������������������������������������������������������������������������� 50 Physical activity ������������������������������������������������������������������������������������������������������������������������������������������������������������������������������������������ 50 Bodyweight ������������������������������������������������������������������������������������������������������������������������������������������������������������������������������������������������� 51 Immunisation ��������������������������������������������������������������������������������������������������������������������������������������������������������������������������������������������� 52 Tobacco use ������������������������������������������������������������������������������������������������������������������������������������������������������������������������������������������������ 53 Alcohol use ������������������������������������������������������������������������������������������������������������������������������������������������������������������������������������������������� 54
Illicit substance use �������������������������������������������������������������������������������������������������������������������������������������������������������������������������������������� 55
Volatile substance use ���������������������������������������������������������������������������������������������������������������������������������������������������������������������������������� 57
Concluding comments ���������������������������������������������������������������������������������������������������������������������������������������������������������������������������������������� 58
Appendix 1 �������������������������������������������������������������������������������������������������������������������������������������������������������������������������������������������������������� 60
Limitations of the sources of Aboriginal and Torres Strait Islander health information ���������������������������������������������������������������������������������������������� 60
Glossary ������������������������������������������������������������������������������������������������������������������������������������������������������������������������������������������������������������� 62
Abbreviations ����������������������������������������������������������������������������������������������������������������������������������������������������������������������������������������������������� 65
Tell us what you think!
We value your opinion, please let us know if you have any suggestions for improving this Overview or future editions. (See www.healthinfonet.ecu.edu.au/contact)
Preface
The main purpose of the Overview is to provide a comprehensive summary of the most recent indicators of the health and current health status of Australia’s Aboriginal and Torres Strait Islander people. It has been prepared by Australian Indigenous HealthInfoNet staff as part of our contribution to supporting those who work in the Aboriginal and Torres Strait Islander health sector. The Overview is a key
element of the HealthInfoNet commitment to authentic and engaged knowledge development and exchange.
The initial sections of this Overview provide information about the context of Aboriginal and Torres Strait Islander health, population, and various measures of population health status. Most of the subsequent sections about specific health conditions comprise an introduction about the condition and evidence of the current burden of the condition among Aboriginal and Torres Strait Islander people. Information is provided for state and territories and for demographics such as sex and age when it is available and appropriate. While it provides a comprehensive review of key indicators across a range of health topics, it is beyond the scope of this Overview to provide detailed information on other aspects, such as the availability and use of services (including barriers to their use) and strategies and policies related to specific health topics. Interested readers should refer to the topic-specific reviews that are available on the HealthInfoNet’s website (www.healthinfonet.ecu.edu.au/health-facts/reviews-home). Additional, more in depth, information about the topics summarised in this Overview is included in the corresponding sections of the HealthInfoNet’s website (www.healthinfonet.ecu. edu.au). For more information on accessing and using the HealthInfoNet resource please view our instructional videos accessible from the web resource and also located on You Tube at www.youtube.com/channel/UCftVbk_1fVQz2i_9TyQ1E2Q.
In this edition, we have included a featured section on Healing as 2017 will be the 20th anniversary of the Bringing Them Home report. It is timely and important to highlight the contribution of healing workers and organisations to supporting people, families and communities impacted by the Stolen Generations. We have also, for the first time, included a section on environmental health. Environmental health has important impacts on health outcomes and is linked to the social determinants of health with indicators such as housing, infrastructure, sewerage and water supply.
The key to successful knowledge exchange and transfer is authentic partnership in the development of materials so we welcome your comments and feedback about the Overview of Aboriginal and Torres Strait Islander health status 2016.
Neil Drew, Director on behalf of the HealthInfoNet team
Acknowledgements
Particular thanks are extended to:
• staff of the Australian Indigenous HealthInfoNet for their assistance, support and encouragement in the preparation of this
Overview.
• previous staff members of the Australian Indigenous HealthInfoNet who have contributed to earlier versions of the Overview. • the Australian and New Zealand Dialysis and Transplant Registry (ANZDATA) for the provision of the notification data on end-stage
renal disease (ESRD).
• The Department of Health and other funding partners for their ongoing support of the work of the HealthInfoNet. • Members of the HealthInfoNet Advisory Board and HealthInfoNet consultants.
Bibdjool
Donna Lei Rioli - a Western Australian Indigenous artist - was commissioned by the Health
lnfoNet
to create a logo
incorporating a gecko, chosen as it is one of a few animals that are found across the great diversity of Australia.
Donna is a Tiwi/Nyoongar woman who is dedicated to the heritage and culture of the Tiwi people on her father’s side,
Maurice Rioli, and the Nyoongar people on her mother’s side, Robyn Collard. Donna enjoys painting because it enables
her to express her Tiwi and Nyoongar heritage and she combines the two in a unique way.
Donna interpreted the brief with great awareness and conveyed an integrated work that focuses symbolically on
the pathway through life. This is very relevant to the work and focus of the Australian Indigenous Health
lnfoNet
in
contributing to improving the health and wellbeing of Aboriginal and Torres Strait Islander Australians.
Key facts
Population
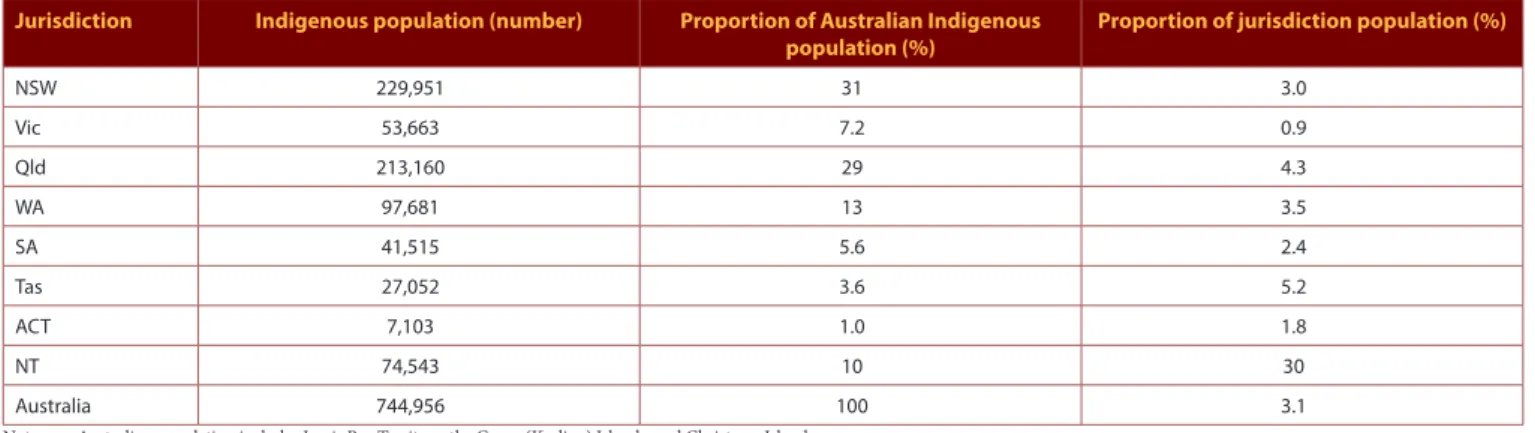
• At 30 June 2016, the estimated Australian Aboriginal and Torres Strait Islander population was 744,956.
• In 2016, it was estimated that NSW had the highest number of Aboriginal and Torres Strait Islander people (229,951 people, 31% of the total Aboriginal and Torres Strait Islander population).
• In 2016, it was estimated that the NT had the highest proportion of Aboriginal and Torres Strait Islander people in its population, with 30% of the NT population identifying as Aboriginal and/or Torres Strait Islander.
• In 2016, around 35% of Aboriginal and Torres Strait Islander people lived in a capital city.
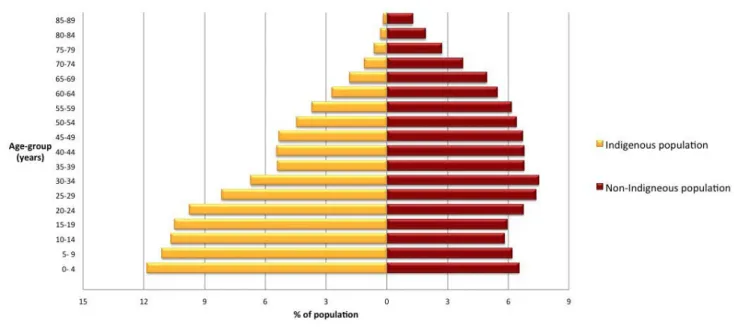
• The Aboriginal and Torres Strait Islander population is much younger than the non-Indigenous population.
Births and pregnancy outcomes
• In 2015, there were 18,537 births registered in Australia with one or both parents identified as Aboriginal and/or Torres Strait Islander (6.1% of all births registered).
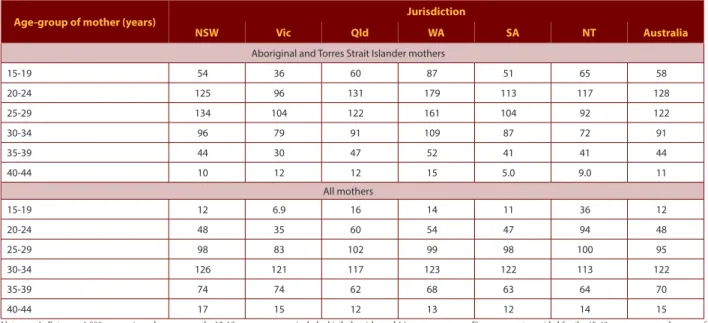
• In 2015, Aboriginal and Torres Strait Islander mothers were younger than non-Indigenous mothers; the median age was 25.1 years for Aboriginal and Torres Strait Islander mothers and 31 years for all mothers.
• In 2015, total fertility rates were 2,271 births per 1,000 for Aboriginal and Torres Strait Islander women and 1,807 per 1,000 for all women.
• In 2014, the average birthweight of babies born to Aboriginal and Torres Strait Islander mothers was 3,215 grams compared with 3,355 grams for babies born to non-Indigenous mothers.
• In 2014, the proportion of low birthweight (LBW) babies born to Aboriginal and Torres Strait Islander women was twice that of non-Indigenous women (12% compared with 6.2%).
• For 2004 to 2014 there was a slight decrease in the proportion of LBW babies born to Aboriginal and Torres Strait Islander mothers.
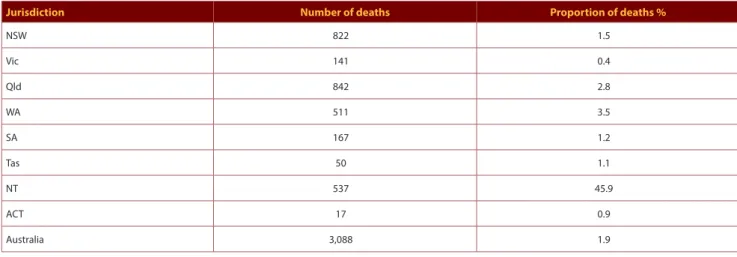
Mortality
• For 2015, the age-standardised death rate for Aboriginal and Torres Strait Islander people living in NSW, Qld, WA, SA and the NT was 1.7 times the rate for non-Indigenous people.
• Between 1998 and 2013, there was a 16% reduction in the death rates for Aboriginal and Torres Strait Islander people in NSW, Qld, WA, SA and the NT.
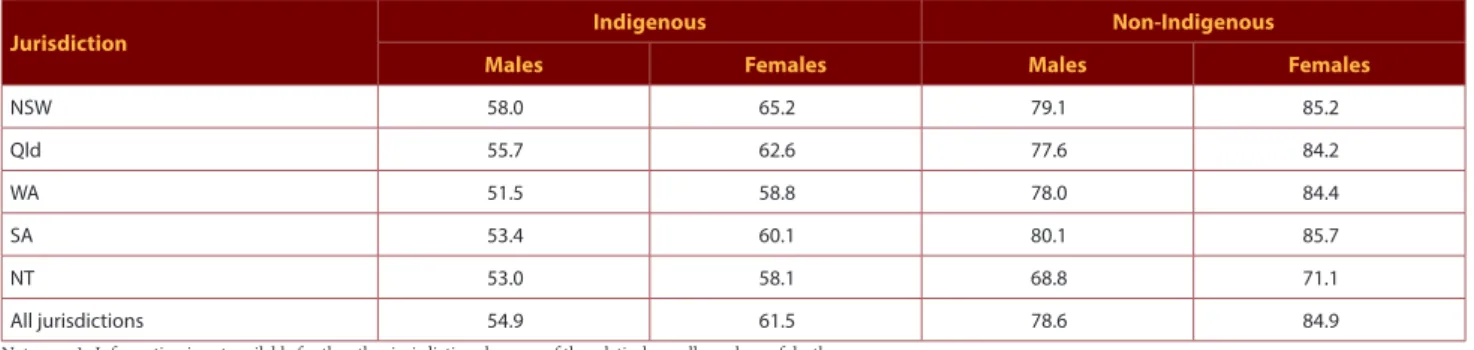
• For Aboriginal and Torres Strait Islander people born 2010-2012, life expectancy was estimated to be 69.1 years for males and 73.7 years for females, around 10-11 years less than the estimates for non-Indigenous males and females.
• For 2013-2015, age-specific death rates were higher for Aboriginal and Torres Strait Islander people living in NSW, Qld, WA, SA and the NT than for non-Indigenous people across all age-groups, and were much higher in the young and middle-adult years. • For 2013-2015, the infant mortality rate was higher for Aboriginal and Torres Strait Islander infants than for non-Indigenous infants
living in NSW, Qld, WA, SA and the NT; the rate for Aboriginal and Torres Strait Islander infants was highest in the NT. • For 1998 to 2014, there were significant declines in infant mortality rates for Aboriginal and Torres Strait Islander infants. • In 2013, the leading causes of death among Aboriginal and Torres Strait Islander people living in NSW, Qld, WA, SA and the NT
were cardiovascular disease, neoplasms (mainly cancers) and injury.
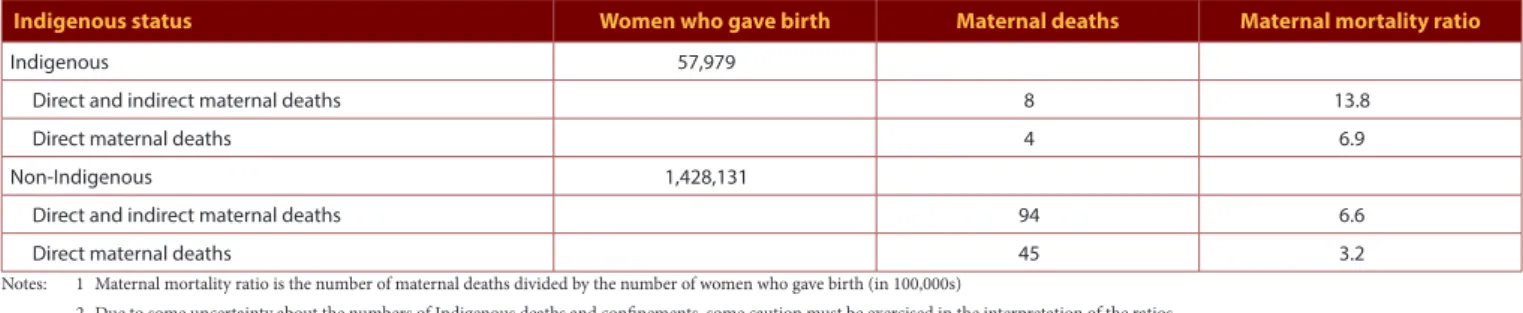
• For 2008-2012, for direct maternal deaths, the rate ratio was 2.2 times higher for Aboriginal and Torres Strait Islander women than for non-Indigenous women.
Hospitalisation
• In 2014-15, 4.4% of all hospital separations were for Aboriginal and Torres Strait Islander people.
• In 2014-15, the age-adjusted separation rate for Aboriginal and Torres Strait Islander people was 2.4 times higher than for non-Indigenous people.
status and contact with health services’ (mostly for care involving dialysis), responsible for 50% of all Aboriginal and Torres Strait Islander separations.
• In 2014-15, the rate of overall potentially preventable hospitalisations was around three times higher for Aboriginal and Torres Strait Islander people than for non-Indigenous people.
Selected health conditions
Cardiovascular disease
• In 2012-2013, 13% of Aboriginal and Torres Strait Islander people reported having a long-term heart or related condition; after age-adjustment, these conditions were around 1.2 times more common for Aboriginal and Torres Strait Islander people than for non-Indigenous people.
• In 2011, CVD was the third largest contributor (12%) to total disease burden among Aboriginal and Torres Strait Islander people. • In 2014-15, hospitalisation rates for circulatory disease were almost twice as high for Aboriginal and Torres Strait Islander people
than for non-Indigenous people.
• In 2015, ischaemic heart disease was the leading cause of death of Aboriginal and Torres Strait Islander people living in NSW, Qld, WA, SA and the NT; the age-adjusted death rate due to ischaemic heart disease for Aboriginal and Torres Strait Islander people was twice the rate for non-Indigenous people.
• For 1998 to 2014, the gap in CVD mortality rates between Aboriginal and Torres Strait Islander and non-Indigenous people narrowed.
Cancer
• For 2006-2010, age-adjusted cancer incidence rates were slightly lower for Aboriginal and Torres Strait Islander people living in NSW, Qld, WA and the NT than for non-Indigenous people.
• For 2006-2010, the most common cancers diagnosed among Aboriginal and Torres Strait Islander people living in NSW, Qld, WA
and the NT were lung and breast (females) cancers.
• In 2011, cancer and other neoplasms (cancerous and non-cancerous tumours) were responsible for 9.4% of the total burden of disease among Aboriginal and Torres Strait Islander people.
• In 2014-15, age-adjusted hospitalisation rates for cancer were lower for Aboriginal and Torres Strait Islander people living in NSW, Qld, WA and the NT than for non-Indigenous people.
• For 2009-2013, the age-adjusted death rate for cancer for Aboriginal and Torres Strait Islander people living in NSW, Qld, WA, SA and the NT was 1.3 times higher than for non-Indigenous people.
Diabetes
• In 2012-2013, 13% of Aboriginal and Torres Strait Islander people reported having diabetes; after age-adjustment, Aboriginal and Torres Strait Islander people were more than three times more likely to report having some form of diabetes than non-Indigenous people.
• In 2015, Aboriginal and Torres Strait Islander people were more likely to have diabetes recorded as the principal cause of hospital admission compared with non-Indigenous people.
• In 2015, Aboriginal and Torres Strait Islander people living in NSW, Qld, SA, WA and the NT died from diabetes at five times the rate of non-Indigenous people.
Social and emotional wellbeing
• In 2012-2013, after age-adjustment, Aboriginal and Torres Strait Islander people were 2.7 times as likely as non-Indigenous people to feel high or very high levels of psychological distress.
• In 2014-2015, 68% of Aboriginal and Torres Strait Islander people aged 15 years and over experienced at least one significant stressor in the previous 12 months.
• In 2012-2013, 91% of Aboriginal and Torres Strait Islander people reported on feelings of calmness and peacefulness, happiness, fullness of life and energy either some, most, or all of the time.
• In 2014-2015, more than half of Aboriginal and Torres Strait Islander people aged 15 years and over reported an overall life satisfaction rating of at least 8 out of 10.
• In 2014-15, there were 16,941 hospital separations with a principal diagnosis of ICD ‘Mental and behavioural disorders’ identified as Aboriginal and/or Torres Strait Islander.
• In 2015, the death rate for ICD ‘Intentional self-harm’ (suicide) for Aboriginal and Torres Strait Islander people was twice the rate reported for non-Indigenous people.
Kidney health
• For 2010-2014, after age-adjustment, the notification rate of end-stage renal disease was 6.6 times higher for Aboriginal and Torres Strait Islander people than for non-Indigenous people.
• In 2011, kidney and urinary diseases accounted for 2.5% of the total burden of disease among Aboriginal and Torres Strait Islander people.
• In 2014-15, ‘care involving dialysis’ was the most common reason for hospitalisation among Aboriginal and Torres Strait Islander people.
• For 2010-2014, the age-adjusted death rate from kidney disease was 2.7 times higher for Aboriginal and Torres Strait Islander people living in NSW, Qld, WA, SA and NT than for non-Indigenous people.
Injury, including family violence
• In 2014-15, after age-adjustment, Aboriginal and Torres Strait Islander people were hospitalised for injury at almost twice the rate for non-Indigenous people.
• In 2014-15, 19% of injury-related hospitalisations among Aboriginal and Torres Strait Islander people were for assaults, compared with 2% among non-Indigenous people.
• In 2015, age-adjusted death rates from intentional self-harm were twice as high for Aboriginal and Torres Strait Islander people living in NSW, Qld, WA, SA and the NT than for non-Indigenous people, land transport accidents nearly three times higher and injury from assault over eight times higher.
Respiratory disease
• In 2012-2013, 31% of Aboriginal and Torres Strait Islander people reported having a respiratory condition. After age-adjustment, the level of respiratory disease was 1.2 times higher for Aboriginal and Torres Strait Islander than for non-Indigenous people. • In 2012-2013, 18% of Aboriginal and Torres Strait Islander people reported having asthma.
• In 2011, respiratory diseases were responsible for 7.9% of the total burden of disease among Aboriginal and Torres Strait Islander people.
• In 2014-15, age-adjusted hospitalisation rates for Aboriginal and Torres Strait Islander people were 5.0 times higher for chronic obstructive pulmonary disease, 3.1 times higher for influenza and pneumonia, 2.1 times higher for whooping cough and 1.8 times higher for asthma and acute upper respiratory infections, than for non-Indigenous people.
• In 2015, chronic lower respiratory disease was the leading cause of death from respiratory disease and the third highest cause of death overall for Aboriginal and Torres Strait Islander people living in NSW, Qld, WA, SA and the NT.
• For 1998 to 2012, age-adjusted death rates for respiratory disease in NSW, Qld, WA, SA and NT declined by 26% for Aboriginal and Torres Strait Islander people.
Eye health
• In 2015-2016, after age-adjustment, vision impairment and blindness among Indigenous adults were both three times higher
than in non-Indigenous adults.
• In 2012-2013, eye and sight problems were reported by 33% of Aboriginal and Torres Strait Islander people.
• In 2012-2013, myopia and hyperopia for Aboriginal and Torres Strait Islander people were reported at 0.8 and 1.1 times the proportions for non-Indigenous people.
• In 2015, the estimated prevalence of active trachoma among Aboriginal and Torres Strait Islander children aged 5-9 years living in at-risk communities in the WA, SA and the NT was 4.6%.
• In the period 2011-12 to 2012-13, after age-adjustment, Aboriginal and Torres Strait Islanders were less likely to be hospitalised for diseases of the eye and adnexa than non-Indigenous people.
Ear health and hearing
• In 2012-2013, ear disease/hearing problems were reported by 12% of Aboriginal and Torres Strait Islander people.
• In 2014-15, the hospitalisation rate for ear disease for Aboriginal and Torres Strait Islander children aged 4-14 years was 1.4 times higher than the rate for non-Indigenous children.
Oral health
• In 2014-15, the proportion of Aboriginal and Torres Strait Islander children aged 4-14 years with reported tooth or gum problems was 34%, a decrease from 39% in 2008.
• In 2012-13, around 49% of adults reported no tooth loss; around 47% had lost one or more teeth; and around 5% reported complete tooth loss.
• In 2014-15, age-adjusted national potentially preventable hospitalisation rates for dental conditions were 1.3 times higher for Aboriginal and Torres Strait Islander people than for non-Indigenous people.
Disability
• In 2012, the overall rate of disability among Aboriginal and Torres Strait Islander Australians was 23%; after age-adjustment, the rate of disability for Aboriginal and Torres Strait Islander was 1.7 times the rate for non-Indigenous people.
• In 2014-15, 6% of disability service users were Aboriginal and Torres Strait Islander people, with most aged under 50 years (84%).
Communicable diseases
• For 2009-2013, after age-adjustment, the notification rate for tuberculosis was 11.3 times higher for Aboriginal and Torres Strait Islander people than for Australian born non-Indigenous people.
• In 2015, the age-adjusted notification rate for hepatitis B was three times higher for Aboriginal and Torres Strait Islander people than for non-Indigenous people.
• For 2011-2015, there was a 22% decline in the hepatitis B notification rates for Aboriginal and Torres Strait Islander people. • In 2015, the age-adjusted notification rate for hepatitis C was almost five times higher for Aboriginal and Torres Strait Islander
people than for non-Indigenous people.
• For 2012-2014, the average notification rate for Haemophilus influenzae type b among Aboriginal and Torres Strait Islander people was 5.3 times the rate in the total population.
• For 2011-2014, the rate of invasive pneumococcal disease for Aboriginal and Torres Strait Islander people decreased.
• In 2007-2010, the age-adjusted notification rate of meningococcal disease was 2.7 times higher for Aboriginal and Torres Strait Islander people than for non-Indigenous people; the rate for Aboriginal and Torres Strait Islander children aged 0-4 years was 3.8 times higher than for non-Indigenous children.
• In 2015, Aboriginal and Torres Strait Islander people had higher crude notification rates for gonorrhoea, syphilis and chlamydia than non-Indigenous people.
• In 2015, age-adjusted notification rates of human immunodeficiency virus (HIV) diagnosis were 1.3 times higher for Aboriginal and Torres Strait Islander people than non-Indigenous people.
Factors contributing to Aboriginal and Torres Strait Islander health
Nutrition and breastfeeding
• In 2012-2013, 54% of Aboriginal and Torres Strait Islander people reported eating an adequate amount of fruit per day but only 8% of Aboriginal and Torres Strait Islander people reported eating an adequate amount of vegetables per day.
• In 2012-2013, on average, Aboriginal and Torres Strait Islander people consumed 41% of their total daily energy in the form of discretionary foods.
• In 2012-2013, 83% of Aboriginal and Torres Strait Islander people reported consuming dairy foods daily. • In 2012-2013, 54% of Aboriginal and Torres Strait Islander people reported consuming sugar daily.
• In 2012-2013, Aboriginal and Torres Strait Islander people living in remote areas were more likely to eat bush food compared with non-Indigenous people.
• In 2011, the joint effect of all dietary risks combined (13 identified) contributed 9.7% to the burden of disease for Aboriginal and Torres Strait Islander people.
• In 2012-2013, 83% of Aboriginal and Torres Strait Islander children aged 0-3 years had been breastfed, compared with 93% of non-Indigenous children.
Physical activity
• In 2012-2013, 47% of Aboriginal and Torres Strait Islander adults in non-remote areas met the target of 30 minutes of moderate intensity physical activity on most days.
• In 2012-2013, after age-adjustment, 61% of Aboriginal and Torres Strait Islander people in non-remote areas reported that they were physically inactive, a similar level to non-Indigenous people.
Bodyweight
• In 2012-2013, 69% of Aboriginal and Torres Strait Islander adults were classified as overweight or obese; after age-adjustment, the level of obesity/overweight was 1.2 times higher for Aboriginal and Torres Strait Islander people than for non-Indigenous people. • In 2012-2013, around 30% of Aboriginal and Torres Strait Islander children aged 2-14 years were overweight or obese.
Immunisation
• In 2016, 95% of Aboriginal and Torres Strait Islander children aged five years were fully immunised against the recommended vaccine-preventable diseases.
Tobacco use
• In 2014-2015, 39% of Aboriginal and Torres Strait Islander people aged 15 years and over reported they were current smokers; after age-adjustment, this proportion was 2.8 times higher than the proportion among non-Indigenous people.
• In 2014-2015, 36% of Aboriginal and Torres Strait Islander people reported they had never smoked.
• In 2014, 45% of Aboriginal and Torres Strait Islander mothers reported smoking during pregnancy, compared with 13% of non-Indigenous mothers.
• For 2009 to 2014, the proportion of Aboriginal and Torres Strait Islander mothers who smoked during pregnancy decreased.
Alcohol use
• In 2011, alcohol use was responsible for 8.3% of the total burden of disease among Aboriginal and Torres Strait Islander people. • In 2012-2013, 23% of Aboriginal and Torres Strait Islander adults abstained from alcohol; this level was 1.6 times higher than
among the non-Indigenous population.
• In 2012-2013, after age-adjustment, lifetime drinking risk was similar for both the Aboriginal and Torres Strait Islander and non-Indigenous populations.
• For 2010 to 2013, there was a significant decline for risky drinking in the proportion (from 32% to 23%) of Aboriginal and Torres Strait Islander people aged 14 years and older.
• For 2011-12 to 2012-13, after age-adjustment, for a principal diagnosis related to alcohol use, Aboriginal and Torres Strait Islander males were hospitalised at 4.5 times and females at 3.6 times the rates of non-Indigenous males and females.
• In 2008-2012, the age-adjusted death rates for alcohol-related deaths for Aboriginal and Torres Strait Islander people was 4.9 times higher than for non-Indigenous people.
Illicit drug use
• In 2011, illicit substance use was responsible for 3.7% of the total burden of disease for Aboriginal and Torres Strait Islander people.
• In 2014-2015, there were 69% and in 2012-2013 there were 52% of Aboriginal and Torres Strait Islander people aged 15 years and older who reported that they had never used illicit substances.
• In 2014-2015, 30% of Aboriginal and Torres Strait Islander people aged 15 years and over reported that they had used an illicit substance in the previous 12 months.
• In 2014-2015, hospitalisation for mental/behavioural disorders from use of amphetamines had the highest rate of separations due to drug use and was more than three times higher for Aboriginal and Torres Strait Islander people than non-Indigenous people.