Turkish Economic Review
www.kspjournals.org
Volume 4 March 2017 Issue 1
The Effect of Corruption on Foreign Direct Investment:
A Panel Data Study
By
Manamba EPAPHRA
a†& John MASSAWE
abAbstract. Foreign direct investment (FDI) has become an important factor of development in low income countries. At the same time, corruption continues to be one of the greatest obstacles to economic and social development in these countries. However, in East Africa, the study of the nature of corruption as well as its relationship with FDI is scanty. In addition, the existing literature provides controversial results. Motivated by these issues, this paper examines the effects of corruption on FDI inflows by incorporating an econometric method based on panel data from 5 East African countries over the 1996-2015 period. The paper contributes to the existing literature by modeling the relationship between corruption and FDI inflows using two measures of corruption, namely corruption perception index (CPI) and control of corruption (CC). Equally important, both economic factors such as GDP per capita, GDP growth, inflation and degree of openness, and quality of institutions or governance indicators such as voice and accountability, political stability and absence of violence, government effectiveness and rule of law are considered in the analysis. Data were obtained from Transparency International, World Bank Development Indicators, Worldwide Governance Indicators and United Nations Conference on Trade and Development. Analytically the paper uses fixed effects (FE) as the preferable model. The results show that the corruption level in the host country has an adverse effect on FDI inflows when eliminating GDP per capita in the regression. Nonetheless, the results show that the GDP per capita as a proxy for market size and country’s quality of institutions are more important than the level of corruption in encouraging FDI inflows into the country. The key implication of these results is that an increase in the real GDP per capita, improvement in the quality of institutions as well as control of corruption may be an important strategy for increase in FDI inflows.
Keywords. Corruption, Foreign direct investment, Quality of institutions. JEL. C23, F21, F23, E02, O16.
1. Introduction
y and large, it is widely accepted that the relationship between domestic private investments and economic growth is positive and significant (see for example Epaphra & Massawe, 2016). For this reason, there is a great need to promote domestic saving so as to encourage domestic private investment that can finally increase growth. Nevertheless, a failure of the country to use its domestic saving to achieve growth through investment, can then allow the foreign saving to serve the purpose. The foreign saving to be used can be in form of loan, equity investment, foreign direct investment (FDI) and portfolio direct investment. Understandably, during the 1990-2000 period, it was witnessed a remarkable and consistent decrease in development assistance to developing countries forcing them to an alternative source of financing such as FDI. More importantly, in 1998, FDI aa†
Department of Accounting and Finance, Institute of Accountancy Arusha, Tanzania. . +255 754 399 775
b
Institute of Accountancy Arusha, Arusha, Tanzania. . +255 755 187 212
emerged as the largest source of capital for developing countries, rising from US$ 174 billion in 1992 to US$ 664 billion in 1998 (Missama, 2010; Kiiza, 2007). Accordingly, FDI has been a major emphasis to both developing and transitional economies in securing economy-wide efficiency to a host country mainly through the transfer of technology and new knowledge, and increasing an access to the foreign market. It also improves standard of living through creation of employment and improving the standards and quality of goods, and transfer of new knowledge to a nation. In summary, FDI plays a crucial role in the economy by serving three development gap: investment gap, when domestic savings are not enough to meet investment needs of the country; foreign exchange gap by bringing the foreign currency during investment and through international trade; and tax revenue gap, through corporate tax in various economic activities.
It is however, important to note the limitations of FDI to less developed countries. For example, FDI may lead to repatriation of the profits and unfair advantages in competing with the domestic companies which might cause small and medium companies to collapse (Dabour, 2000). In fact, FDI may subsequently, lead to the monopolistic structure of the market (Dabour, 2000). Notwithstanding these limitations, the importance of FDI to the economy of a host country cannot be overemphasized. Politicians and policy makers have been creating the favourable business environment such as infrastructural development, financial services and social services aiming at increasing investment in their economies. Besides, theories and empirical studies have discussed the main determinants of FDI. In brief, political risk factors such as instability and corruption, weak security, nature of labour, infrastructure and lack of transparency in regulatory policy are among of the important determinants of FDI in the host economy (see for example
Lambsdorff, 2003; Dabour, 2000). Also, factors such as structure of the domestic market, tax policy and inflation rate may affect foreign investors.
The issue of corruption is relevant to the context of abundance of natural resources which is likely to foster rent seeking behaviour (Leite & Weidmann, 1999). Corruption takes place in the economy where government institution has the great authority and can exercise discretion without respect to interpretation and application of regulation (CETA, 2011). Similarly, Lambsdorff (2007); Goel & Nelson (1998); Leite & Weidmann (1999) and Krueger (1974) suggest that government restrictions on economic activity tend to generate rent seeking behaviour, which in turn adversely affects the economy.
Many studies show that corruption reduces the investment profits by acting as an additional cost to the investment. For example, Bray (2006) and Control Risks and Simmons & Simmons (2006) argue that companies fail to win contract or to gain new business because their competitor pays bribe. Also, Chêne (2014) and Sanyal & Samanta (2008) suggest that USA firms are less likely to invest in countries where corruption is widely spread. Overall, corruption discourages FDI in the host country and it has been considered to be a major cost to international business (Bray, 2006). Under this circumstance, FDI flows to corrupt countries from countries that criminalise corruption are less than FDI inflows from the countries with higher levels of corruption.
Whilst the discussion in the preceding paragraphs is supported with both theoretical and empirical studies, corruption is a complex idea with different definitions. For instance, Transparency International describes corruption as the abuse of the entrusted power for the private gain which can either be a financial or non-financial gain. It may occur when private agents offer bribes to circumvent public policies and process for competitive advantage or profit. Under these circumstances, corruption can also have some positive effects on FDI. This counter argument is supported by Wei (1997) and Ohlsson (2007). According to Wei (1997), East Asia attracts more foreign investors regardless of its highest level of corruption. However, East Asia has a large market and has been growing faster than the world average. This is fairly direct reasoning, with a large market there are high incentives for foreign companies to try to conquer the local market. Besides,
by paying bribes a global multinational enterprise (MNE) can reduce the time for bureaucratic paper work. It can also skip inspections, reduce taxes, or even receive government funding (Ohlsson, 2007). Furthermore, in some cases governments’ bureaucrats receive a bribe and allow MNE to charge an over price for public services, so this increases the return on the FDI (Ohlsson, 2007). In addition, while relying on static efficiency arguments, Leite & Weidmann (1999) view bribing as a type of coarsen bargaining process and so, it can play a positive role in the development process.
Notwithstanding the possible advantages of corruption to some MNEs the uncertainty and the risk of dealing with corrupt government may be higher. In fact, Kaufmann & Wei (1999) show that within a country, firms which pay more bribe spend more time on average, negotiating with the government officials. Thus, corruption remains a growing problem. Of central concern therefore is to examine the adverse effect of corruption on FDI in the host country while controlling other factors such as market size. This is important because corruption heightens the uncertainty (Habib & Zurawicki, 2002). In general, the empirical findings of this paper are very significant for policy makers and decision making process because most of the developing countries have recently shifted their emphasis in terms of acquiring foreign currency. For the purpose of this paper, unless specifically mentioned, corruption means the abuse of entrusted power for private gain.
2. Descriptive Analysis of Foreign Direct Investment and
Corruption
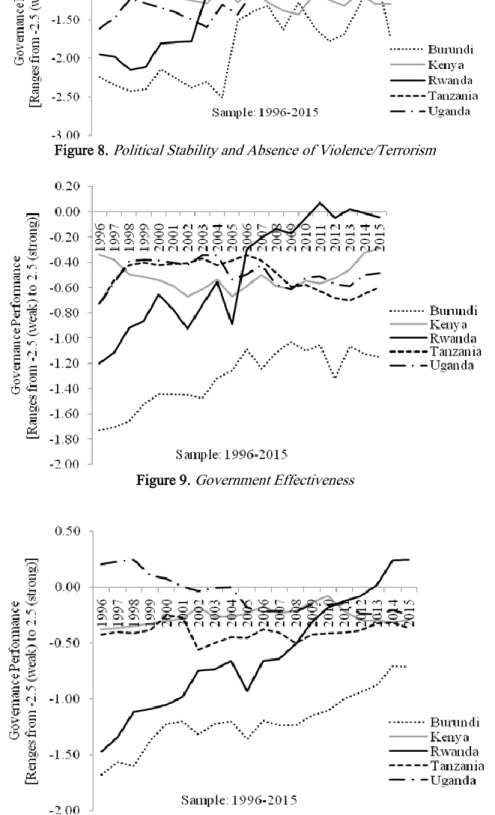
Table 1 reports the global distribution of FDI during the 1990-2015 period. In that period grobal FDI increased by 38 percent (UNCTAD, 2016). That increase was contributed chiefly by changes in legal or ownership structures of MNEs, including tax inversions which involve large movements in the balance of payment with little changes in operations (UNCTAD, 2016). In 2015, FDI inflow growth rate in developing economies was 9.5 percent; however, in Asia, FDI inflows grew by 15.6 percent making it the largest FDI recipient region in the World. Markedly, FDI inflows in Asia increased from US$467.94bil in 2014 to US$540.72bil in 2015 (UNCTAD, 2016). The strong performance of the economy and high population growth in the region are, unsurprisingly, the chief reasons for the large FDI inflows in Asia. An increase in GDP and population has been an incentive for the foreign firms to make market seeking investment. Undoubtedly, the long run relationship between FDI inflows and market size seems to be positive.
Table 1. Growth of Foreign Direct Investment, 1990-2015
Wo rld De ve lo pe d Co un tri es Eu ro pe No rth Am erica De ve lo pi ng Eco no m ies Afric a No rth Afric a Wes t Afric a Ce ntral Afric a Eas t Afric a As ia 1990-00 20.8 22.8 23.6 27.8 19.8 14.3 16.2 -1.1 -26.1 38.1 19.7 2001-10 5.1 2.6 8.5 11.5 12.5 22.0 23.3 22.1 46.5 16.8 13.4 2011 12.8 16.8 10.7 19.0 7.2 9.7 -52.1 57.9 -5.3 5.7 3.5 2012 -3.6 -3.7 1.1 -14.1 -1.7 15.4 108.8 -11.0 21.5 14.5 -4.0 2013 -5.5 -13.6 -33.1 22.3 0.6 -5.4 -24.1 -14.1 -12.0 24 5.3 2014 -10.5 -23.3 -5.4 -41.7 5.4 11.8 -2.8 -16.4 15.5 16.8 8.5 2015 38.0 84.4 64.6 159.5 9.5 -7.2 8.8 -18.3 -35.9 -1.5 15.6
Source: Authors computations using Data from UNCTAD (2016)
There are also, however, further points to be considered in East Africa, West Africa, Central Africa and Africa in general. It can be seen from Table 1 that, Africa FDI flows in 2015 decreased by 7.2 percent. In West Africa and Central Africa the decline in FDI inflows was even worse. The UNCTAD (2016) suggests that the low commodity prices and a depreciation of the local currencies were the chief factors. These low commodity prices depressed FDI inflows in natural
resources based economies. Likewise, depreciation of national currencies put a downward pressure to MNEs on reinvesting earnings. Nonetheless, Economist (2011) shows that generally growth of FDI in Africa rises because the African countries have initiated economic and political reforms; and opened their economies to international trade. In the same way, FDI inflow to Sub-Saharan Africa (SSA) is expected to rise because the region is among the fastest growing regions in the world. However, the decisions to invest abroad depend on a complex set of factors but the least corrupt countries may attract more FDI because they provide a more favorable climate for investors (Castro, 2013).
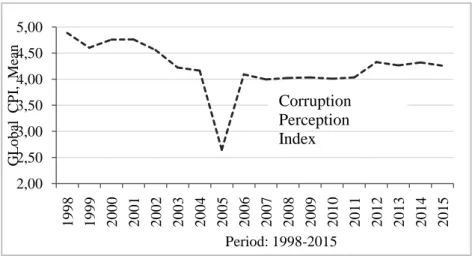
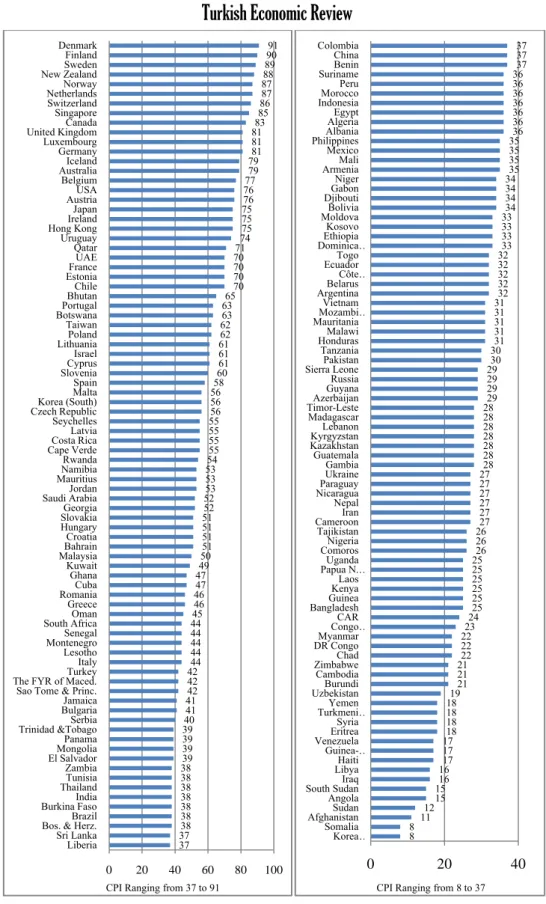
It is important to note that there is no even a single country anywhere in the world, which is corrupt free (Transparency International, 2015). This also suggests that corruption is a global threat. Corruption is principally a governance issue, a failure of institutions and a lack of capacity to manage society by means of a framework of social, judicial, political and economic checks and balances. Figure 1 and Figure 2, respectively show the global mean CPI over the 1998-2015 period and the CPI for selected countries as reported by Transparency International (2015). In fact, as it has been presented above, there is no one single country that gets a perfect score and that more than two-thirds scored below 50, on a scale from 0 (highly corrupt) to 100 (very clean) (Figure 2). According to Transparency International (2015), corruption undermines justice and economic development, and destroys public trust in government and leaders. Furthermore, Figure 1 reports the global average score of 4.3 on scale from 0 (highly corrupt) to 10 (very clean) during the 1998-2015 period. Notably, European Union and Western Europe had an average score of 6.7 whereas Asian Pacific and Americas had average scores of 4.3 and 4.0, respectively. Other regions such as Middle East and Northern Africa, Eastern Europe and Central Asia, and Sub Saharan Africa had the lowest scores of 3.9, 3.3 and 3.3 respectively. Overall, Denmark and Finland have the highest scores in the world, whereas Northern Korea and Somalia and Afghanistan are among the most corrupt countries in the world.
In 2005, corruption was observed to be a greater problem to the poorest countries. In that year the global score stood at 2.6 out of 10 a clean index. Clearly, in that time there was an inclusion of new least developed countries namely Chad, Bangladesh, Turkmenistan, Myanmar and Haiti into the list. Without question, these countries are among the poorest countries in the world. It is important to note however, that even developed countries are observed to be victims of corruption. This point is supported by the scores of Spain, South Korea, Greece and Italy of 5.8, 5.6, 4.6 and 4.4 out of 10 respectively.
The gentle slope of the global average CPI indicates that the world’s control of corruption has been improving albeit insipidly. This situation raises great interest to economists and policy makers because literature suggests that corruption reduces both investment and economic growth (see for example Arvas & Atta, 2011; Leite & Weidmann, 1999; Murphy et al., 1993; Romer, 1994; and Shleifer & Visny, 1993). Unquestionably, corruption affects decision making associated with investment and composition of investment and consequently it may lead to a reduced both domestic and foreign investments. It may also lead to less efficient but more manipulatable projects and distorted composition of government expenditure away from infrastructure, health and education (Wei, 2005). According to Ravi (2015) corruption affects foreign firms in many ways including increment of cost of doing business in a host country. It may also create uncertainty for corporation such as in a process of obtaining a required license (Ravi, 2015). Similarly, corruption remains a huge challenge for East African economies. In 2015, South Sudan, Burundi, Kenya and Uganda were the most corrupt countries in the East Africa region with scores of 15, 21, 25 and 25 out of 100, respectively (Transparency International, 2015). Other East African countries, namely Tanzania and Rwanda had scores of 30 and 54 respectively (Transparency International, 2015). These data suggest that the Government of Rwanda has undertaken serious measures including immense political will and public support that led to a low
level of corruption relative to other countries in the region. Over the 1996-2010, Rwanda moved from 20.0 percent score in 1996 to 70.8 percent in 2010, emerging the fourth least corrupt country out of 53 countries in Africa after Botswana (79.9 percent), Cape Verde (74.6 percent) and Mauritius (73.2 percent) (See also World Bank Worldwide Governance Indicators, 2011 and the Republic of Rwanda, 2012). Undoubtedly, Rwanda is the least corrupt country in the East African region even by the transparency report. For example, in 2011, Burundi, Kenya, Uganda, Tanzania and Rwanda scores were 1.9, 2.2, 2.4, 3 and 5 respectively (Transparency International, 2015). For detailed description of corruption and the correlation between corruption and FDI inflows, we present the 2015corruption rank/index and the trends of the variables during the 1996-2015 period. Table 2 reports the corruption rank and index across East African countries whereas Figures 3 illustrates the trends of corruption (right scale) and FDI per capita (left scale) for individual East African countries. Furthermore, Figure 4 presents the trends of FDI in US$ millions for the countries in consideration over the 1990-2015 period.
Figure 1. Global Mean Corruption Perception Index, 1998-2015
Source: Authors’ computations using Transparency International Data (2016)
2,00 2,50 3,00 3,50 4,00 4,50 5,00 1998 1999 2000 2001 2002 2003 2004 2005 2006 2007 2008 2009 2010 2011 2012 2013 2014 2015 GL o b al C P I, Me an Period: 1998-2015 Corruption Perception Index
Figure 2. CPI, 2015: Selected Countries.
Note: The Corruption Perceptions Index ranks countries and territories based on how corrupt their public sector is perceived to be. A country or territory’s score indicates the perceived level of public sector corruption on a scale
of 0 (highly corrupt) to 100 (very clean). A country or territory's rank indicates its position relative to the other countries and territories in the index (Transparency International, 2015)
The most compelling evidence is that South Sudan and Burundi are the highly corrupt countries in the region. In 2015, these countries, respectively, ranked 163rd
37 3738 38 38 38 38 38 3839 39 39 3940 41 4142 42 4244 44 44 44 4445 46 4647 4749 5051 51 51 5152 5253 53 5354 55 55 55 5556 56 5658 6061 61 6162 6263 6365 70 70 70 7071 7475 75 7576 7677 79 7981 81 8183 8586 87 8788 8990 91 0 20 40 60 80 100 Liberia Sri Lanka Bos. & Herz.Brazil Burkina FasoIndia ThailandTunisia Zambia El SalvadorMongolia Panama Trinidad &TobagoSerbia BulgariaJamaica Sao Tome & Princ. The FYR of Maced.Turkey Italy Lesotho MontenegroSenegal South AfricaOman Greece RomaniaCuba Ghana Kuwait MalaysiaBahrain Croatia Hungary SlovakiaGeorgia Saudi ArabiaJordan MauritiusNamibia Rwanda Cape VerdeCosta Rica Latvia Seychelles Czech RepublicKorea (South) Malta Spain SloveniaCyprus Israel LithuaniaPoland Taiwan BotswanaPortugal BhutanChile EstoniaFrance UAE Qatar Uruguay Hong KongIreland Japan AustriaUSA Belgium AustraliaIceland Germany Luxembourg United KingdomCanada Singapore Switzerland NetherlandsNorway New ZealandSweden Finland Denmark
CPI Ranging from 37 to 91
8 8 11 1215 1516 1617 17 1718 18 18 1819 21 21 2122 22 2223 2425 25 25 25 25 2526 26 2627 27 27 27 27 2728 28 28 28 28 28 2829 29 29 2930 3031 31 31 31 3132 32 32 32 3233 33 33 3334 34 34 3435 35 35 3536 36 36 36 36 36 3637 37 37 0 20 40 Korea … Somalia AfghanistanSudan Angola South SudanIraq LibyaHaiti Guinea-… VenezuelaEritrea Syria Turkmeni…Yemen UzbekistanBurundi Cambodia ZimbabweChad DR CongoMyanmar Congo …CAR BangladeshGuinea KenyaLaos Papua N. …Uganda ComorosNigeria Tajikistan CameroonIran Nepal NicaraguaParaguay Ukraine Gambia Guatemala KazakhstanKyrgyzstan Lebanon Madagascar Timor-LesteAzerbaijan GuyanaRussia Sierra LeonePakistan Tanzania HondurasMalawi MauritaniaMozambi… Vietnam ArgentinaBelarus Côte … EcuadorTogo Dominica…Ethiopia Kosovo MoldovaBolivia DjiboutiGabon Niger ArmeniaMali Mexico PhilippinesAlbania AlgeriaEgypt IndonesiaMorocco Peru SurinameBenin China Colombia
and 150th
out of 167 countries in the Transparency International Corruption Perception Index1
(Table 2). In fact, they scored 15 and 21 respectively. These scores, on a scale of 10 to 100, mean that South Sudan and Burundi are ranked among the world’s most corrupt countries. Understandably, the problem of corruption in Burundi might have been heightened by uncertainty generated by the prolonged civil conflict of 1990s.
Nonetheless, it should not be considered that the other East African countries except Rwanda are less corrupt. Indeed, in 2015 Kenya and Uganda scored 25 out of 100 and ranked 139th
out 167 countries whereas Tanzania scored 30 and ranked 117th
out of 167 countries. These scores and ranks suggest that corruption in East Africa is pervasive and entrenched. Apparently, Kenya and Uganda are also ranked among the world’s most corrupt countries. In these countries, allegations of irregularities in public tenders are frequent (US Department of State, 2015).
In practice, corruption hampers both domestic and foreign business activities (US Department of State, 2015). For example, contracts are awarded to foreign firms that allegedly do not comply with public procurement laws. Consequently, the East-African relationship with foreign investments has been turbulent and the region loses its overall appeal to foreign investors due to political unrest and corruption (US Department of State, 2015).
1 The index measures the overall extent of corruption, in terms of frequency and the size of the bribes, in both the
public and the private sector. The score indicates the perceived level of private and public sector corruption on a scale of 0-100, where 0 means that the country is perceived as highly corrupt and 100 means it is perceived as clean.
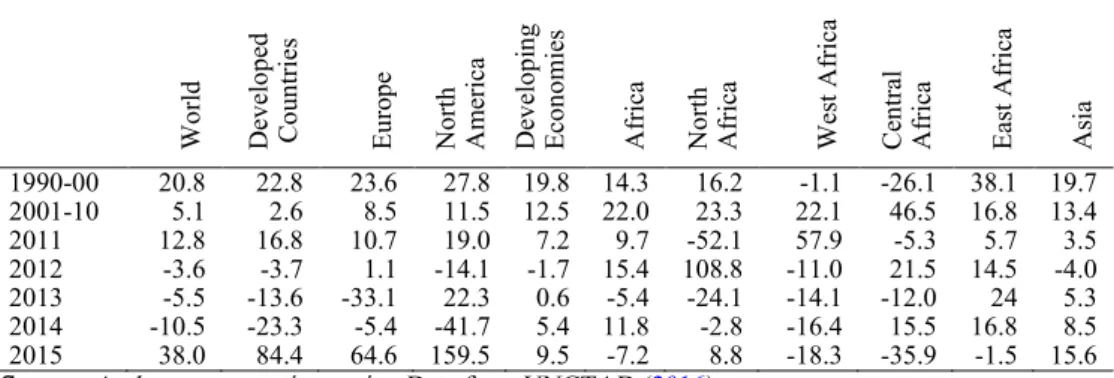
T ab le 2. E ast Af rica C or ru ptio n an d E asy o f Do in g B us in ess : Ran k an d In dex , 2 01 5 S ou th S ud an 16 3 ou t o f 16 7 [CP I 15 ] - - US$ 79 0 S ou rc es: Tran sp are nc y In ter na tio na l (2 01 6) an d US De pa rtme nt of S tate ( 20 15 ) Ug an da 13 9 ou t o f 16 7 [CP I 25 ] 15 0 of 1 89 co un tr ies 11 1 ou t o f 14 1[S co re 2 7. 7] US$ 70 0 Rwa nd a 44 o ut o f 16 7 [CP I 54] 46 o f 18 9 co un tr ies 94 o ut o f 14 1[S co re 3 0. 1] US$ 73 0 Tan za nia 11 7 ou t o f 16 7 [CP I 30 ] 13 1 of 1 89 co un tr ies 11 7 ou t o f 14 1[S co re 2 7] US$ 92 0 Ke ny a 13 9 ou t o f 16 7 [CP I 25 ] 13 6 of 1 89 co un tr ies 92 o ut o f 14 1[S co re 3 0. 2] US$ 1, 34 0 Bu ru nd i 15 0 ou t o f 16 7 [CP I 21 ] 15 2 of 1 89 co un tr ies 13 6 ou t o f 14 1[S co re 2 1] US$ 26 0 Y ea r 20 15 20 15 20 15 20 15 M ea su re TI Co rru pti on P erc ep ti on s in de x Wo rld Ba nk ’s D oin g B usin ess Re po rt Eas e of Do in g B usin ess Glo ba l In no va ti on I nd ex Wo rld Ba nk GN I pe r ca pit a*
Notably, foreign investors are usually attracted by a relatively stable environment (Agarwal & Ramaswami, 1992) in which corruption tends to be comparatively low. Furthermore, the quality of country political institutions, its democracy, good governance, and law and order are often considered as the main drivers of FDI (FitzGerald, 2001; Blomstrom & Kokko, 2001; Abbott & De Vita, 2001). Indeed, Busse & Hefeker (2007) argue that political stability, socio-economic condition, law and order, democratic accountability and the issue of bureaucracy are, inter alia, responsible for attraction of foreign entities.
To be able to succinctly describe the ease of doing business in East Africa, we use the World Bank’s 2015 Ease of Doing Business report (Table 2). As can be seen in the Table, Rwanda ranks high in the World Bank's Ease of Doing Business Index, and at the same time scores high CPI of 54 out of 100 suggesting that Rwanda is among the World’s less corrupt countries. Notwithstanding the business-friendly reputation in Rwanda, FDI inflows in this country lag well behind Tanzania, Uganda and Kenya (Figure 4). Low level of FDI in Rwanda is chiefly contributed to high transport costs, a small domestic market, limited access to affordable financing, inadequate infrastructure, ambiguous tax rules, and an under-skilled workforce ill-suited to the needs of foreign investors (US Department of State, 2015).
Tanzania and Kenya generally have favorable attitude toward FDI and have had considerable success in attracting it. Explicitly, Tanzania attracts the highest share of FDI in the East Africa region (Figure 4). The economy of Tanzania attracts FDI inflows mainly in sectors such mining, manufacturing and the recent development of the Southern Agricultural Growth Corridor of Tanzania (SAGCOT). Also, natural gas off the southern coast of the country has chiefly influenced foreign investment. Different from many other countries in the region, the investment climate in Kenya is characterized by stable monetary and fiscal conditions. Moreover, Kenya has a strong telecommunications infrastructure, a robust financial sector, and solid aviation connections both within Africa and to Europe and Asia (US Department of State, 2015). Surprisingly, Tanzania and Kenya rank 131st
and 136th
of 189 countries, respectively, in the World Bank's Ease of Doing Business Index whereas Rwanda ranks 46th
, third best in Africa behind Mauritius and South Africa.
Uganda and Burundi rank 150th
and 152nd
of 189 countries, respectively, in the World Bank Doing Business 2015 report. Using East African countries’ data, one may conclude that there is certainly, correlation between overall easy of doing business, corruption and FDI inflows. For example, Burundi is one of the most corrupt countries in the region and ranking low in easy of doing business, as a result, the country attracts very low level of FDI inflows in the region (Figure 4). An increase in corruption tends to discourage the FDI inflows in the country. This is because investors become too uncertain about the costs that will be involved in the future. Moreover, this may be accompanied with the macroeconomic instability in the country such as inflation and weak currency rate.
Admittedly, corruption is an essential means for assessing the business environment of a country. However, the relationship between corruption and FDI is more complex. Given that there are many determinants of FDI and corruption, it is hard to determine how each factor determines a country in relation to FDI and corruption. An empirical analysis of corruption and FDI in this case is of great significance. In this paper, CC and CPI are used independently as corruption indicators. Specifically, the effect of these factors on FDI is used to identify the corruption effects on FDI in the panel data setting. CPI is constructed as a joint measure of different corruption channels and is recognized in terms of validity and reliability (Lancaster & Montinola, 2001). It is interesting to analyze possible effect of corruption on FDI inflows, because as shown in Figures 5 and 6, there is a clear strong correlation between CPI and FDI on one hand and control of corruption and FDI on the other, for the countries included in the analysis.
Figure 3. FDI and CPI Rate: East African Countries
Source: Authors computations using UNCTAD and TI data 1996-2015
Figure 4. FDI Inflows in East African Countries
Source: Authors computations using UNCTAD Data, 1990-2015
These scatter plots provide a rough indication of importance of CPI rank and control of corruption on FDI inflows of the countries in consideration. Also, they
-500 0 500 1000 1500 2000 2500 1990 1991 1992 1993 1994 1995 1996 1997 1998 1999 2000 2001 2002 2003 2004 2005 2006 2007 2008 2009 2010 2011 2012 2013 2014 2015 F D I In fl ow s (U S $ in M il li on s) Sample: 1990-2015 Tanzania Uganda Rwanda Kenya Burundi
suggest that CPI and control of corruption are indeed driving forces for FDI in East Africa.
Figure 5. Correlation between CPI and FDI in 5 East Africa, 1996-2015 Source: Authors’ computations
Figure 6. Correlation between CC and FDI in 5 East Africa, 1996-2015 Source: Authors’ computations
3. Literature Review
A number of theories explain the motives behind FDI. For example a behavioural theory of firms developed by Aharoni (1966) describes the external and internal forces that initiate FDI. In particular, according to Aharoni (1966), initiating forces that originate from the external environment include proposals from foreign governments, distributors of the company’s products and clients, or a fear of losing market, or strong market competition from abroad in the home market. The initiating forces that stem from within the organization include drive of a predetermined internationalization strategy and drive of an influential decision maker such as strong interest of a high-ranking executive inside the organization for a particular FDI. In addition to external and internal forces, auxiliary forces such as creation of a new market for products, utilization of old machinery and capitalization of know-how may enhance the impact of initiating forces.
The three fundamental factors in the initial investment decision are uncertainty, information and commitment. An equally significant aspect of the behaviour theory is that its framework is based on the assumption that FDI location decision-making processes and final choice are contingent upon interactions between the
FDI/POP = 7.448 CPI - 8.519 R² = 0.246 -5,0 0,0 5,0 10,0 15,0 20,0 25,0 30,0 35,0 40,0 45,0 1,5 2,5 3,5 4,5 5,5 FDI p er ca p ita (FDI /P OP )
Corruption Perception Index (CPI)
FDI/POP = 6.886 CPI + 15.58 R² = 0.070 -5,0 0,0 5,0 10,0 15,0 20,0 25,0 30,0 35,0 40,0 45,0 -2,00 -1,50 -1,00 -0,50 0,00 0,50 1,00 FDI p er ca p ita (FDI /P OP ) Control of Corrruption (CC)
environmental, firm and decision maker context under which the decision is made. Each of these theoretical positions makes an important contribution to our understanding that foreign investment decision is complex social process that is influenced by social relationships both within and outside the firm. Despite its importance it seems to have, particularly in the initial investment decision making, certainly, the behaviour theory does not go unchallenged. For example, the analysis of the theory does not lead to testable empirical hypotheses. In addition, the sample size used for analysis is too small (see also Shin, 1998).
Another significant theory of FDI is the international product life cycle theory (IPLC). IPLC describes the role attributed to MNEs in the interaction between technology, international production and trade (Posner, 1961; Hufbauer, 1966;
Vernon, 1966; Hirsch, 1967 and Wells, 1983) and it takes into account the role of innovation and the diffusion of knowledge (Hermannsdottir, 2008 and Hennart, 1982). The main argument is that development of technology generates changes in the products’ factors intensity, which in turn leads to changes in the comparative advantages of countries. According to this model, companies go through stages from export to FDI (Melin, 1992; Sakarya, et al., 2007) where products typically pass through the phase of introduction, growth and maturity (Almor, et al., 2006). Table 3 summarizes the three stages of IPLC model.
Table 3. Three Stages of International Product Life Cycle Model
Stage 1: Introduction Stage 2: Growth Stage 3: Maturity
Production activities are located in the developed country where the product was developed
Export activities increase and finally the
production activities are located in proximity to consumers in other developed countries
Production activities are located in less developed countries where costs are low
The product is exported into other industrial markets
The firm exports its product from the less developed country back to the original
innovating country
Source: Hermannsdottir (2008)
In the introduction stage the product is newly produced by the innovating firm in its home market (Agarwal, 1980) where the product was developed (Almor et al., 2006; Luo et al., 2005; Melin, 1992 and Hermannsdottir, 2008). At this stage, the firm basically exports the new product to foreign markets. Exporting process enables the firm to acquire enough knowledge about the foreign market. As a result, the firm may shift production abroad (Hermannsdottir, 2008; Kwon & Hu, 1995; Melin, 1992; Sikorski & Menkhoff, 2000).
In the growth stage export activities increase and the demand for products rise leading into additional markets (Hermannsdottir, 2008). Accordingly, as both export and demand for products increase, the innovators locate production activities in proximity to consumers in these countries (Hermannsdottir, 2008;
Almor et al., 2006; Galán & González-Benito, 2001; Lou, Zhao & Du, 2005;
Melin, 1992).
The next phase is maturity stage. At this stage major markets are saturated and a definite degree of standardization of the product takes place (Melin, 1992). Also, products are exported to developed countries with the highest level of income. Expansion of demand and growing competition in these markets lead eventually to FDI of the innovator into countries for local production of the product (Shin, 1998). In fact, Dunning (1993) suggests that MNCs would prefer to invest the foreign countries rather than exporting to these countries because of access to resources, access to markets, efficiency gains and acquisition of strategic assets. At this stage, the need for flexibility declines due to an increase in the degree of standardization. Also, a commitment to some set of product standards opens up technical possibilities for achieving economies of scales through mass output
(Hermannsdottir, 2008). By and large, the production will be located in less developed countries where labour costs and other factor costs such as land and material are lower (Vernon 1971; Almor et al., 2006; Lou, Zhao & Du, 2005;
Melin, 1992; Sikorski & Menkhoff, 2000) and that firms will export their products from the less developed countries back to the original innovating country (Sikorski & Menkhoff, 2000 and Hermannsdottir, 2008).
It is however, important to note the limitations of the product cycle theory. Understandably, the theory was modified by Vernon (1971; 1974a; 1974b) to take into account factor costs such as labour, land and material cost. Also, Hirsch (1976) and Agmon & Hirsch (1979), respectively, specify the conditions which influence a firm’s choice to serve a foreign market through export or FDI and elaborate these conditions to differentiate between developed and developing countries (see also Shin, 1998). Despite these modifications, the applicability of the product cycle hypothesis is still restricted to highly innovative industries (Solomon, 1978). In addition, the theory does not cover the new phenomenon of investment by LDC firms in DC market (Shin, 1998).
An equally important theory is Internalisation Theory of FDI coined by Bucklet & Casson (1976). Initially, the theory was launched by Coase in 1937 in a national context and Hymer in 1976 in an international context. The theory is based on the application of the market imperfections approach in an international context. The most compelling augment under the theory is that firms try to maximise profits under the imperfect market condition existing in intermediate products by internalizing the key intermediate products such as knowledge, marketing, human capital and management expertise (Bucklet & Casson, 1976). As Johanson & Mattsson (1987) and Madhok (1997) point out, a high level of transaction cost results in a preference for internalizing the transaction. Significantly, presence of externalities in goods or factor markets provides the firm with incentive to internalise such markets (Rugman, 1980). In fact, the firms decide to internalize process across frontiers leading to FDI, provided that the replacement of the external imperfect markets reduces transaction costs, and that such reduction in cost is greater than the cost of organizing such activities internally. The benefits of internalization include, inter alia, efficient exploitation of market power, avoidance of buyer uncertainty and minimization of government intervention. It is also important to note that internalization is associated with administrative, communication and risk-taking costs. Nonetheless, these costs are expected to be lower the less different the foreign market is from the home market. For this reason, international expansion is likely start in nearby markets (see Johanson & Mattsson, 1987 and Hermannsdottir, 2008). More significantly, internalization process may continue up to the point where the benefit and costs associated with further internalization are equalized at the margin (Shin, 1998).
One of the main limitations of internalization theory, however, is that although the theory clearly shows that MNCs do bypass the market in intermediate products, through direct investment, it is not certain that the motive for internalization is the external market’s efficiency in terms of relatively high costs (Petrochilos, 1989;
Agarwal, 1980; Hennat, 1982). Also, according to Agarwal (1980), the theory cannot explain FDI in the short run, especially by smaller firms operating in one or two foreign countries (see also Shin, 1998). Moreover, although the theory acknowledges the risk of host government intervention, it fails to differentiate the magnitude of this risk across various industries (Nayak & Choudhury, 2014). Notwithstanding these limitations of internalization theory, its popularity remains largely undiminished. In fact, the theory can be effective in explaining Greenfield investments.
In another development, Dunning (1977) put forward the concept of the eclectic paradigm of international production basing on market imperfections2
. The eclectic 2
The model is eclectic because it integrates distinct explanatory approaches from different theories into one single framework (Ekeledo & Sivakumar, 1998; Glückler, 2006).
theory follows the line of the original Hymer (1976)-Kindleberger (1969) approach but it also considers local advantages of the host country (Petrochilos, 1989). The theory comprises of three different theories of direct foreign investments namely ownership-specific advantages (O), location-specific advantages (L) and internalization-specific advantages (I), hence dubbed OLI. Certainly, the firm’s decision to enter a foreign market and the choice of entry form depend on a combination of these three advantages that are necessary conditions for entry into foreign markets (Dunning, 1988) (See Figure 6).
As Figure 6 shows, a firm will engage in FDI if the three conditions are satisfied. First, the firm must possess net ownership advantages over firms of other nationalities, which are exclusive or firm-specific proprietary, such as patents (see also Shin, 1998). These tangible and intangible assets may be transferred within transnational companies at low costs, leading either to higher incomes or reduced costs (Ekeledo & Sivakumar, 1998; Mtigwe, 2006; Hermannsdottir, 2008 and
Denisia, 2010). According to Shin, (1998), firms are able to develop new products, skills in marketing, organization or finance and expertise in differentiating products with the imperfectly competitive market. This monopolistic advantages developed by firms must be sufficient to offset the additional costs of operating in an unfamiliar foreign environment. However, costs arise from factors such as cultural, legal, institutional and linguistic differences and lack of knowledge of local market conditions may prove barrier to FDI by small firms. This suggests that, to successfully enter a foreign market, company’s own specific advantages such as patents and trademarks, technology, economies of large scale and greater access to financial capital must lead to higher marginal profitability or lower marginal cost than other competitors (Dunning, 1973).
Choice of a foreign market and Choice of an entry form Ownership-specific
advantage Location-specific Advantage Internalizing-specific Advantage Tangible and intangible assets Attractiveness of a market Benefits of retaining tangible and intangible assets within the firm Compensates for
liability of foreignness
The fit between the chosen market and
the firm’s strategy Can reduce transaction cost Continual
reinvestment needed
Figure 6. Eclectic theory: Firm’s specific advantages needed when entering foreign markets.
Source: Hermannsdottir (2008)
Second, when the first condition is satisfied, it must be more advantageous for the company possessing these unique assets to use them itself through FDI, rather than sell them or lease the rights to foreign firms (Denisia, 2010 and Shin, 1998). Notably, location advantages of different countries are key factors to determining who will become host countries for the activities of the transnational corporations (Denisia, 2010). Moreover, favourable government incentives or regulations in different locations and the desire to reduce transaction costs are a strong incentive for relocating production to particular offshore locations (Mtigwe, 2006) and can give the firm great advantage over its rivals (Hermannsdottir, 2008).
Third, assuming the first two conditions are fulfilled, it must be profitable for the firm to use its advantages through production outside its home country rather than through exports (Dunning, 1973 and Shin, 1998). In other words, internalization advantages accrue to firm from the internal use of its ownership
advantages rather than renting them out to external parties in the form of licensing agreements or franchising (Mtigwe, 2006). It can be seen from the analysis of OLI framework that as cross-border market internalization benefit is higher the more the firm will want to engage in foreign production rather than offering this right under license, franchise. However, as Denisia (2010) points out, it is important to note that eclectic paradigm parameters are different from company to company and depend on context and reflect the economic, political, social characteristics of the host country. The main limitation of the eclectic theory is that, since the advantages due to ownership, location and internalization may change over time, if country-specific characteristics are important determinants of FDI, it may be invalid to generalize from one country’s experience to another (Petrochilos, 1989).
Given, the high profile debate with regard to FDI, it is quite unsurprising that there many other theories of FDI. These include, inter alia, the Uppsala model (Andersson, 2000; Collinson & Houlden, 2005; Johanson & Wiedersheim-Paul, 1975; 2004), the Oligopolistic theory explaining FDI, (Knickerbocker, 1973), FDI theory based on strength of currency (Aliber, 1970; Caves, 1988; Froot & Stein, 1991 and De Mello, 1997), FDI theories related to international trade (Graham, 1996; and Helpman et al., 2003; Smith, 1776; Ricardo, 1817), the Theory of Exchange Rates on Imperfect Capital Markets (Itagaki, 1981 and Cushman, 1985), Theories of FDI based on perfect competition (MacDougall, 1960; Kemp, 1964;
Simpson, 1962, Frankel, 1965, Pearce & Rowan, 1966, Caves, 1971; Kindleberger, 1969 and Hymer, 1976). By and large, corruption is now recognized as a policy variable that affects almost all aspects of social and economic life, especially in developing countries (Freckleton et al., 2011). According to Mauro (1995) corruption slows down the economic growth of a country and has an adverse effect on the investment level.
Theories aside, there are a number of empirical studies that examine the relationship between corruption and FDI inflows in the host country. To this end, various models and methodologies such as fixed effect and random models of panel data as well as cross sectional data have been applied. However, there is no certain result on the effect of corruption on FDI inflows. In fact, some studies find a positive relationship between corruption and FDI (Leff, 1964; Al-Sadig, 2009;
Bardhan, 1997) while others reveal a negative relationship between the variables (Hines, 1995; Al-Sadig, 2009; Egger & Winner, 2006; Habib & Zurawicki, 2002;
Mathur & Sigh, 2013). Also, there studies that show that corruption can have both positive and negative effects on FDI (see for example, Campos et al., 2010). Corruption may have a positive effect on FDI inflows in the sense that it is considered to be a greasing wheel to the host country with rigid regulations and inefficiency bureaucracy (Bardhan, 1997). In a similar fashion, Udenze (2014) finds an insignificant positive relationship between perceived corruption and FDI inflows for the 22 Sub Saharan African countries, but a significant negative relationship for the low and middle income countries outside Sub-Saharan Africa. This also suggests that the effect of corruption on investment varies significantly across regions. For example, Asiedu & Freeman (2009) find that corruption is the most determinant and has a significant negative effect on the investment in transition countries but with no significant impact for firms in Latin America and sub-Saharan Africa. Besides, Egger & Winner (2006) suggest that corruption has a negative effect on FDI for any of the 59 OECD and non-OECD economies analyzed.
Certainly, there is no shortage of disagreement within the study of corruption and FDI. For example, with cross sectional data of 52 developing countries, Akcay (2001) fails to evidence a negative relationship between corruption and FDI inflows and concludes that the most significant determinants of FDI are market size, openness, labour costs and corporate tax rates. Similarly, King (2003) reveals no significant relationship between corruption and FDI when combined with other determinants of FDI, but finds a significant negative effect of corruption on FDI when corruption is used alone. According to King (2003) corruption indirectly
affects FDI through factors such as infrastructure, privatization, oil and growth. In the same manner, Marthur & Sigh (2011) show a negative relationship between FDI and corruption, however they suggest that a host country market size and GDP growth rate, productivity of labour and the level of trade-to-GDP ratio, are the significant determinants of the ability of the host country to attract FDI. More democratic countries may receive less FDI flows if economic freedom or economic reforms are not guaranteed (Marthur & Sigh, 2011).
Both theoretical and empirical perspectives on the effect of corruption on FDI inflows make an important contribution to our understanding that it is important to control for the other determinants of FDI to improve the accuracy of the estimation of the relationship between perceived corruption and FDI inflows. This argument is also supported by evidence from Yasmin et. al, (2003). According to Yasmin et. al, (2003) factors such as trade openness, GDP growth, inflation rate, GDP per capita, gross capital formation, days to start a business and number of procedures to start a business should be taken into account when analyzing the relationship between corruption and FDI inflows. Moreover, Wei (2000) shows that corruption aside, an increase in tax rate to the multinational enterprises may lead to the decrease of FDI inflows.
Further, evidence for in support of the position that corruption has a negative effect on FDI, however, suggests that a negative relationship may be contributed by the failure to control a quality institution (Al-Sadig, 2009). Also, according to Wei (2001a) and Abed & Dovooddi (2000) when a strong institutional factor is included in the model then there will be an insignificant relationship between FDI and Corruption. This also indicates that the country with a good quality institution can be able to attract more FDI inflows despite its level of corruption. Likewise, the effect of corruption on FDI depends on both the size of the corruption and the nature of the corruption (Ravi, 2015). To support this argument, Ravi (2015) show that corruption in India has a detrimental effect on FDI, whereas in China has the opposite effect because corruption in China is low while in India is very high. A similar explanation is that predictable corruption3
cannot necessarily adversely affect investor’s ability to predict future activities while unpredictable corruption creates insecurity and uncertainty business environment (see for example King, 2003). Indeed, Ngowi (2001) shows that the high risk of doing business which is caused by the lack of political and institutional stability and predictability prevent FDI inflows in Africa. This negative relationship between political instability and FDI inflows is supported by Al-Sadig (2009). These instabilities create uncertainty of the protection of the property right and hence reduce investment and productive activities (Mo, 2001).
Habib & Zurawicki (2002) show that the effect of corruption on FDI negative and consequently, foreigner usually avoid to invest in countries with high level of corruption as they are afraid of operational inefficiencies. In addition, Habib & Zurawicki (2002) reveal that there are positive and significant effects of the population, GDP per capita and economic ties on FDI level.
Despite the controversies about the relationship between corruption and FDI inflows, it should be pointed out that corruption is not the only variable that possibly affects FDI inflows. Undoubtedly, there is a vast literature on the determinants of FDI. Such factors include inter alia, economic growth, population, institutional quality, political stability, degree of openness, democracy or rule of law or regulatory quality and economic stability. This paper contributes to the existing literature on the relationship between CPI and FDI in East African countries. The paper also analyzes a broader set of institutional variables such as rule of law, regulatory quality, voice and accountability, political stability and absence of violence, government effectiveness and control of corruption. This is
3It exists when bribes are paid and goods or services are delivered, and the bribe payer feels assured of
deliverance. For example ccorruption is very predictable where costs of services is easily estimated and clients feels guaranteed.
due to the fact that not all institutional dimensions have the same importance for the decision of where to invest. Moreover, the paper considers economic variables such as inflation and degree of openness as well as demographic factors such urbanization that may affect the decision of foreign investors to undertake investment projects in a particular country.
3. The Model
As it has been discussed, Dunning (1988) developed the eclectic theory that is generally grounded in the ownership, location, and internalization paradigm (OLI). In the OLI framework, the ownership (O) factor addresses the “why” aspect of foreign production; the location (L) factor addresses “where” to locate foreign production; and the internalization (I) factor addresses “how” firms internalize markets (Quazi et al., 2014). Various studies suggest that corruption can influence the L factor by affecting the locational advantage of a host country as well as the internalization (I) factor by raising transaction costs (Quazi et al., 2014; Habib & Zurawicki, 2002; Caetano & Caleiro, 2005). In view of these arguments, this paper applies a panel data analysis to examine the causal relationship between corruption and FDI in East Africa. With a panel data there will be a greater degree of freedom. In line with Al-Sadig (2009) and Quazi et al. (2014), the estimation model is expressed as:
it it i it t i t i t i t i t i t i t i t i t i t i t i t i URPOP OPEN POPG CC RL RQ GE PV VA GDPG GDPPC CPI POP FDI , , 13 , 12 , 11 , 10 , 9 , 8 , 7 , 6 , 5 , 4 , 3 , 2 , 1 0 , log log / log (1)Whereiis the country subscript, t is the time subscript, s are unknown parameters to be estimated, is the usual random disturbance term, andis the unobserved country-specific effects. The dependent variable, GDP per capita and degree of openness are in logarithm form. Table 3 summarizes the definitions and descriptions of the variables.
The dependent variable is total FDI inflows a host country receives at time t divided by the host country’s total population, that is, FDI per capita. Al-Sadig, 2009 also uses the same measure of FDI. This represents the inflows of foreign investment into a country. The key regressors is the corruption level in the host country as measured by CPI in line with Quazi et al. (2014), Wei (2000a), Habib & Zurawicki (2002), Zhao et al. (2003), Voyer & Beamish (2004), Ketkar et al. (2005), and Egger & Winner (2006) and control of corruption in line with Belgibayeva & Plekhanov, (2015) and Daude & Stein, (2004). Since corruption is illegal, it is very hard to find good statistics on the level of corruption (Ohlsson, 2007). In most cases it is done in secret, so only some cases are discovered and therefore, the amount of cases discovered is not a good measure of the actual corruption, because that also depends on other factors, as the judicial system (Ohlsson, 2007). As a result, CPI is widely considered as a proxy measure of corruption level of a country. It is published by the Transparency International. The CPI ranges from 0 to 10, with 10 being no corruption and 0 being countries where business is totally corrupt. This also implies that a lower CPI score reflects more corruption. If the estimated coefficient of the CPI index,2, turned out positive,
would literally mean that the higher corruption index (very clean) attracts more FDI supporting the “grabbing hand” hypothesis (Quazi et al., 2014). In contrast, a negative coefficient will indicate that lower CPI scores (i.e., more corruption) attract more FDI, validating the “helping hand” hypothesis. In fact, according to Bardhan (1997), the negative relationship between FDI and CPI index suggests that corruption acts as a greasing wheel for the rigid regulations and an inefficient bureaucracy country so as to speed up decision making and bureaucratic efficiency. The annual CPI data are obtained from Transparency International. The control of
corruption which is also one of the indicators of governance performance or quality of institutions is as defined and explained in Table 4.
The choice of the control variables is motivated by the previous empirical studies on the determinants of FDI, the eclectic paradigm of Dunning (1988) and the availability of data. For example, domestic demand in host countries can play a crucial role in attracting “market seeking” FDI, where the primary objective of multinational corporations (MNCs) is to serve the domestic market (Quazi et al., 2014). Market size supports the horizontal nature of FDI that seeks to extend and increase their market base. Also, when a product cycle of the firm reaches its peak, it will be starting to look for the foreign markets with the large market and higher purchasing power (Jordaan, 2004) for efficient utilization of resources and exploitation of the economies of scale (Charkrabarti, 2001). In addition, according to Yu & Walsh (2010), a larger FDI flows to the countries with the larger market potentials because of larger potential demand and lower costs associated with economies of scale. In fact, Chakrabarti (2001) suggests that market size of the host country measured by GDP per capita passes the robustness test as a significant determinant of FDI. GDP per capita is a good estimate of the disposable income and of the well being of each person. With a higher living standard, the level of consumption should be more sophisticated, leading to increase in FDI (Ohlsson, 2007; Demirhan & Masca, 2008). In this case, GDP per capita is expected to have a positive impact on FDI. However, the result of relationship between FDI and GDP per capita as a proxy of market size is not straight forward. For example, Anywanu (2011) finds a negative relationship between the two variables suggesting that this could be due to balancing of the market size effect with the cost of production effect, which should work in the opposite direction. In line with previous empirical studies log of GDP per capita is used in this paper as proxy variable for market size or potential (Al-Sadig, 2009; Quazi et al., 2014; Schneider & Frey, 1985; Loree & Guisinger, 1995; Jaspersen et al., 2000; Wei, 2000a and Quazi et al., 2014).
To control for the host country’s market size and market potential, other variables such as the growth rate of GDP (GDPG), and the growth rate of population (POPG) are used (see for example Al-Sadig, 2009). The argument about the growth rate of GDP is that a region that has experienced impressive economic growth in the past is likely to attract more foreign investors (Yin et al., 2014). In the same line, Demirhan & Masca (2008) and Charkrabarti (2001) argue that only rapidly growing economy provides relative better opportunities for making profits than the ones growing slowly. Rapid growth creates a large domestic demand and business opportunities for foreign firms. Similarly, if a country’s population is growing very fast, this may serve as a catalyst for FDI inflows (Al-Sadig, 2009). An increase in population may increase the demand for different products in the country or may result into a decrease in production costs via reduced wages (Li et al., 2004). A cheaper labour at the host country than at the home tends to attract efficiency seeking FDI. Foreign investors aim to take advantage of the host country’s cheaper factor inputs (Yin et al., 1998). Accordingly, the relationship between FDI and these variables is expected to be positive.
Likewise, economically open countries generally pursue economic policies that are conducive to foreign trade and investment (Quazi et al., 2014). The fact that foreign investors typically have favorable impressions of such countries with greater degree of openness, the openness of the economy (OPEN) which is measured by the sum of exports and imports as a percentage of GDP is expected to have a positive effect on FDI (see for example Demirhan & Masca, 2008;
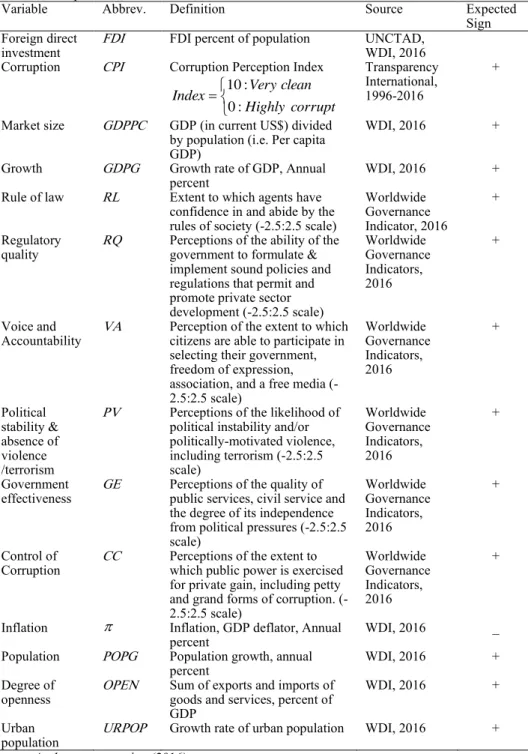
Table 4. Descriptions of Variables
Variable Abbrev. Definition Source Expected
Sign Foreign direct
investment FDI FDI percent of population UNCTAD, WDI, 2016
Corruption CPI Corruption Perception Index
corrupt Highly clean Very Index : 0 : 10 Transparency International, 1996-2016 +
Market size GDPPC GDP (in current US$) divided
by population (i.e. Per capita GDP)
WDI, 2016 +
Growth GDPG Growth rate of GDP, Annual
percent WDI, 2016 +
Rule of law RL Extent to which agents have
confidence in and abide by the rules of society (-2.5:2.5 scale)
Worldwide Governance Indicator, 2016
+ Regulatory
quality RQ Perceptions of the ability of the government to formulate &
implement sound policies and regulations that permit and promote private sector development (-2.5:2.5 scale) Worldwide Governance Indicators, 2016 + Voice and Accountability VA
Perception of the extent to which citizens are able to participate in selecting their government, freedom of expression, association, and a free media (-2.5:2.5 scale) Worldwide Governance Indicators, 2016 + Political stability & absence of violence /terrorism
PV Perceptions of the likelihood of
political instability and/or politically-motivated violence, including terrorism (-2.5:2.5 scale) Worldwide Governance Indicators, 2016 + Government
effectiveness GE Perceptions of the quality of public services, civil service and
the degree of its independence from political pressures (-2.5:2.5 scale) Worldwide Governance Indicators, 2016 + Control of
Corruption CC Perceptions of the extent to which public power is exercised
for private gain, including petty and grand forms of corruption. (-2.5:2.5 scale) Worldwide Governance Indicators, 2016 +
Inflation Inflation, GDP deflator, Annual
percent WDI, 2016 _
Population POPG Population growth, annual
percent
WDI, 2016 +
Degree of
openness OPEN
Sum of exports and imports of goods and services, percent of GDP
WDI, 2016 +
Urban
population URPOP
Growth rate of urban population WDI, 2016 +
Source: Authors construction (2016)
Economic stability is controlled by the inflation rate () in the host countries (Al-Sadig, 2009 and Demirhan & Masca, 2008). A stable macroeconomic environment indicates less investment risk which in turn promotes FDI (Anywanu, 2011). Thus, the expected relationship between FDI and inflation is negative. Also, a high degree of urbanization tends to encourage FDI inflows since it may imply a high quality of infrastructure and concentrated consumers (Al-Sadig, 2009). Indeed, concentrated consumers and concentrated services such as banking and communications, technological assets etc are always found in the cities. These externalities allow domestic enterprises and multinational firms to achieve efficiencies in production and service deliveries and economies of scale (Yin et al., 2014). This paper uses the growth rate of urban population (URPOP) as a proxy for urbanization and it is expected to have a positive correlation with FDI.
Equally important, there has been growing interest in the role of institutions or legal framework and/or political structure in attracting FDI. According to Kaufmann et al., (1999a), the institutional variables include rule of law, regulatory quality, voice and accountability, political stability and absence of violence, government effectiveness and control of corruption. These indicators which are clustering into different dimensions allow us to examine whether some dimensions of governance matter for FDI location, while others do not. Kaufmann et al., (1999a) standardize them so that they all have mean zero and a standard deviation of one; in all cases larger values indicate better institutions.
Indeed, like the other variables, the rule of law (RL) is the variable of most interest to this paper. The rule of law measures the extent to which agents have confidence in and abide by the rules of society, and in particular the quality of contract enforcement, property rights, the police, and the courts, as well as the likelihood of crime and violence (Kaufmann, et al., 2007). A central focus of the rule of law and FDI analysis rests on the significance of property rights and contract enforcement on investors’ decision to invest in a country. This is important because individuals and firms are incentivized to invest when these rights are secured. Thus, as articulated in much of the literature (for example
Haggard & Tiede, 2011 and Hogan, 2015), all things being equal, a stronger rule of law will in principle encourage FDI by ensuring a transparent, stable and predictable environment in which host governments credibly commit to the enforcement of contracts and the protection of property rights and rights of the person.
Regulation Quality (RQ) as an indicator of the quality institutions measures regulatory barriers to functioning markets. It reflects perceptions of the ability of the government to formulate and implement sound policies and regulations that permit and promote private sector development. The empirical study by Busse & Groizard (2006) discusses the impact of quality of government regulation of business on FDI. Specifically, Busse & Groizard (2006) show that, economies with high standards of regulation, have relatively less benefited from the multinational companies. These results are supported by Baklouti & Boujelbene (2014) who finds a negative relationship between the variables.
Similarly, stable social and political environment strongly affects FDI and so this paper uses political stability and absence of violence/terrorism indicator to control for political stability (RISK). Political stability and absence of violence/terrorism measures the perceptions of the likelihood that the government will be destabilized or overthrown by unconstitutional or violent means, including politically-motivated violence and terrorism. Thus, by its very nature, the FDI decision requires some assessment of the political future of the host country. This is due to the fact that it is a forward-looking activity based on investors' expectations regarding future returns and the confidence that they can place on these returns (Brada, et al., 2004). Thus, domestic instability or civil war or conflict with neighboring countries may reduce the profitability of operating in the host country because domestic sales are impaired, or production is disrupted, or the facility is damaged or destroyed (Brada, et al., 2004). Also, political instability is likely to affect the value of the host country's currency, thus reducing the value of the assets invested in the host country as well as of the future profits generated by the investment (Brada, et al., 2004). Indeed, a number of studies examine the significance of political risk for investment decision (Citron & Nickelsburg, 1987;
Cherian & Perotti, 2001; Fielding, 2003; Alesina & Perotti, 1996; Bennett & Green, 1972; Schneider & Frey, 1985; Singh & Jun, 1995; Globerman & Shapiro, 2002 and Cho, 2003) and find that an increase in the intensity of political instability significantly decreases investment. Moreover, Diamonte et al. (1996) show that political risk is a more important determinant of asset returns in emerging markets than in developed markets whereas Bussiere & Mulder (1999) conclude that including political variables in economic models significantly improves the ability of such models to explain economic crises (see also Brada, et
al., 2004). By and large, this variable combines indicators that measure the risk of a destabilization or removal from power of the government in a violent or unconstitutional way.
Government effectiveness (GE) as an indicator of the effectiveness of policy, reflects perceptions of the quality of public services, the quality of the civil service and the degree of its independence from political pressures, the quality of policy formulation and implementation, and the credibility of the government's commitment to such policies. It measures the competence of the state bureaucracy and the quality of public services. This variable is expected to have a positive effect on FDI. This augment is supported by (Bénassy-Quéré et al., 2007 and
Baklouti & Boujelbene, 2014). The indicators clustered in government effectiveness and in regulatory quality are related to the ability of the government to formulate and implement policies.
Voice and accountability focuses on different indicators related to the political process, civil rights, and institutions that facilitate citizens’ control of government actions, such as media independence while the control of corruption measures the extent to which public power is exercised for private grain, including both petty and grand forms of corruption. Both indices range from -2.5 to 2.5, with higher values corresponding to better quality of institutions. In general, many empirical studies show that the quality of institutions has positive effects on FDI (see for example, Daude & Stein, 2004). According to Belgibayeva & Plekhanov (2015), with full control of corruption, paying a bribe is prohibitively costly. This also suggests that FDI inflows increase with the control of corruption.
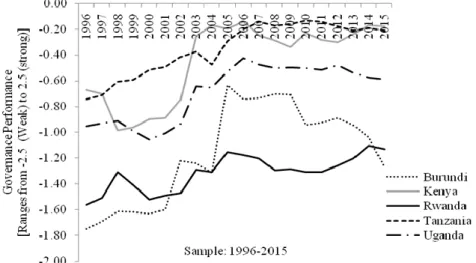
The graphical descriptions of the quality of institutions measures namely voice and accountability, political stability and absence of violence/terrorism, government effectiveness, and regulatory quality, rule of law and control of corruption for the East African countries are presented in Figures 7-12. These indicators are very important as they seem to associate with FDI inflows.
Figure 8. Political Stability and Absence of Violence/Terrorism
Figure 9. Government Effectiveness
Figure 11. Rule of Law
Figure 12. Control of Corruption
Among the five countries, Rwanda seems to have a remarkable improvement in political stability and absence of violence/terrorism, government effectiveness, regulatory quality, rule of law and control of corruption while Burundi tends to lag behind in terms of the quality of its institutions. The fact that some explanatory variables such as indicators of quality of institutions seem to have correlation, these variables are included in the models as reported in Table 5 to avoided the problems of multicollinearity and endogeneity.
![Table 2. East Africa Corruption and Easy of Doing Business: Rank and Index, 2015 South Sudan 163 out of 167 [CPI 15] - - US$790 Sources: Transparency International (2016) and US Department of State (2015)](https://thumb-us.123doks.com/thumbv2/123dok_us/1943813.2787122/8.892.337.552.132.1079/table-africa-corruption-business-sources-transparency-international-department.webp)