OATAO is an open access repository that collects the work of Toulouse
researchers and makes it freely available over the web where possible
Any correspondence concerning this service should be sent
to the repository administrator:
tech-oatao@listes-diff.inp-toulouse.fr
This is an author’s version published in:
https://oatao.univ-toulouse.fr/
2
6278
To cite this version:
Mokadem, Riad
and Hameurlain, Abdelkader
A data replication strategy
with tenant performance and provider economic profit guarantees in cloud data
centers.
(2020) Journal of Systems and Software, 159. 110447. ISSN 0164-1212.
Official URL:
https://doi.org/10.1016/j.jss.2019.110447
A data replication strategy with tenant performance and provider
economic profit guarantees in Cloud data centers
Riad Mokadem
•
, Abdelkader Hameurlain
lnsrirur de Recherche en lnfonnarique de Toulouse (/RIT Laborarory ), Paul Sabatier Universiry, Toulouse 31860, France
ABSTRACT Keywords: Cloud systems Databases Data replication Cost mode! Economie profit Performance
Meeting tenant performance requirements through data replication while ensuring an economic profit is very challenging for cloud providers. For this purpose, we propose a data Replication Strategy that satisfies Performance tenant objective and provider profit in Cloud data centers (RSPC). Before the exe cution of e.ach tenant query Q. data replication is considered only if: (i) the estimated Response Time of Q (RTQ) exceeds a critical RT threshold (per-query replication), or (ii) more often, if RTQ exceeds another (lower) RT threshold for a given number of times (replication per set of queries). Then, a new replica is really created only if a suitable replica placement is heuristically found so that the RT requirement is satisfied again while ensuring an economic profit for the provider. Both the provider's revenues and expenditures are also estimated while penalties and replication costs are taken into account. Further more, the replica factor is dynamically adjusted in order to reduce the resource consumption. Compared to four other strategies, RSPC best satisfies the RT requirement under high loads, complex queries and strict RT thresholds. Moreover, penalty and data transfer costs are significantly reduced, which impacts the provider profit.
1. Introduction
1.1. Motivation
Data replication is a well known technique that consists in stor
ing multiple copies of data, called replicas, at multiple nodes. It
aims to increase data availability, reduce bandwidth consumption
and achieve fault-tolerance. Data replication has been commonly
used in traditional systems such as P2P (Spaho et al.. 2015) and
data grid systems (Tos et al.. 2015
)
. In such systems, a replica
tion strategy needs to determine
what
to replicate?
When
to cre
ate/remove replicas?
Where
to place them? and How
many
replicas
to create?
(
Ranganathan and Foster, 2001). However, most of the
proposed replication strategies in the above systems are difficult
to adapt to clouds since they aim to obtain better system perfor
mance without taking into account the
economic cost
of replica
tion. In fact, creating as many replicas as possible in cloud systems
cannot be economically feasible since it can result in wasteful re
source utilization and reduced provider profit. Hence, data repli
cation strategies in cloud systems should also achieve goals such
as:
• Corresponding author.
E-mail addresses: mokadem@iritJr (R. Mokadem), hameurlain@iritJr (A Hameurlain).
(i) Providing a reliable Quality of Service (QoS) by satisfying a Ser
vice Level Agreement (SlA), a legal contract between a cloud
provider and its tenants, i.e., customers (
Buyya et al., 2009
).
Mainly, an SlA contains one or several tenant Service Level Ob
jectives (SLO), i.e., requirements, to be satisfied by the provider.
(ii) A dynamic adjustment of resources that the provider rents to
its tenants, according to the 'pay as you go' pricing model
(
Armbrust et al.. 2010
)
.
Performance guarantees, e.g., response time (RT), are often not
offered by cloud providers as a part of the SlA because of the het
erogeneous workloads in cloud systems, e.g., Google Cloud SQL
1only provides downtime and error guarantees without an RT guar
antee. Thus, satisfying performance can often conflict with the
goal of obtaining a maximum economic benefit at minimal oper
ating costs (Lang et al., 2014). However, data replication strategies
in such systems should consider the 'tenant performance/provider
profitability' trade-off, especially when they are proposed for OLAP
(Online Analytical Processing) applications as we do here. In other
terms, the consistency management is not the focus of this work.
Most of the proposed replication strategies in the literature
focus on ensuring a specific tenant objective, e.g., availability
(Wei et al., 2010), reliability (Li et al., 2017), low latency (Ma and Yang, 2017), data durability (Liu et al., 2018), security (Ali et al., 2018) and energy efficiency (Boru et al., 2015) when other strate-gies balance among different objectives, e.g., availability and load balancing (Long et al., 2014). On the other hand, there are a num-ber of strategies (Liu et al., 2018;Bonvin et al., 2011;Xiong et al., 2011; Mansouri et al., 2017;Edwin et al., 2017; Mansouri and Ja-vidi, 2018) and replication frameworks (Pu et al., 2015) that aim to satisfy the tenant’s objectives while reducing the cost of repli-cation, e. g., data storage and/or data transfer costs, between Data Centers (DCs). Some of them (Gill and Singh, 2016;Lin et al., 2013) are mentioned cost-aware although the considered cost of replica-tion is not necessarily an economic cost. It is regarded as an as-signed budget value for DCs inGill and Singh (2016) and mod-elled in terms of time in Lin et al. (2013). In this context, only some strategies (Wu et al., 2013;Zeng et al., 2016;Tos et al., 2017;
Casas et al., 2017;Liu and Shen, 2017;Mansouri and Buyya, 2019) model the replication cost and the provider profit as monetary costs while satisfying a tenant RT SLO. Furthermore, they often only consider a per-query replication that immediately responds to any query load or popularity change, but may generate higher RTs and increase overhead costs.
1.2. Proposal
We propose a data Replication Strategy that satisfies both Per-formance and minimum availability tenant objectives while en-suring an economic profit for the provider in Cloud data centers (RSPC). We consider a set of Virtual Machines (VMs) scattered over heterogeneous DCs, themselves distributed over different regions. Each VM has its own allocated storage volume and computational resources. Throughout this paper, a node refers to a VM.
Ensuring a given minimum availability SLO (SLOAV) consists in initially creating, across regions, a minimum number of replicas for each data set, e.g., a database (DB) relation or an HDFS data block (Cheng et al., 2012), then maintaining them (Wei et al., 2010). Dealing with the performance guarantee, we focus on the RT met-ric. In this context, most of data replication strategies in the lit-erature, e.g., (Mansouri et al., 2017), are based on data locality in order to reduce data access time, i.e., a replica is deployed at the user’s node or at the node very near to it (Ranganathan and Fos-ter, 2001). In order to reduce the bandwidth consumption, RSPC benefits from the Network Bandwidth (NB) locality (Park et al., 2004), i.e., a replica of a required remote data dr is placed at a
node having a larger NB toward the node requiringdr.
Before the execution of each tenant query Q requiring dis-tributed data over a set of nodes within a region, the RT ofQ(RTQ)
is estimated in order to check whether the RT objective (SLORT) is satisfied or not. The RSPC replica management deals with the fol-lowing issues:
A. A new replica is created only if: (a) SLORT is not satisfied. Then, (b) the provider must have an economic profit when a replica placement node that satisfies SLORTis found.
a. SLORT is not satisfied when RTQ exceeds a given
criti-cal RT threshold (RT_SLO_PQ), i.e., replication per- query, or (more often) when RTQ exceeds another (lower) RT
threshold (RT_SLO_PSQ)for a given number of times, i.e., replication per set of queries. Hence, the creation of a new replica is avoided whenever RTQ exceeds a
non-critical threshold. TheRTQestimation is based on a
pro-posed cost model that takes into account the parallel ex-ecution of DB queries. It considers several factors, e.g., NB, query complexity, user’s access patterns and query arrival rate that impact query performance while concur-rent queries are processed.
b. In order to check whether the replication is profitable for the provider, its revenues and expenditures are also esti-mated before the execution ofQ in a multi-tenant con-text. Within the proposed economic cost model, penalties resulting from an SLA breach are also factored as well as the replication cost. A penalty management algorithm is also proposed to reduce these penalties.
B. A replica placement heuristic is also proposed. It aims to find, within a reduced search space, a suitable placement NodeP for receiving a new replica in order to satisfy SLORT again, i.e., RTQ < RT_SLO_PSQ, in a profitable way. In
or-der to determine what and where to replicate, the proposed heuristic starts by identifying the resource bottleneck that causes the SLORTunsatisfaction:
a. Q orQp⊆Qcould require a remotedrthrough a low NB,
which generates a data transfer bottleneck. Hence,NodeP should have a better NB to the node requiringdr,or,
b. An overloaded node (requiring a local datadl) could
ex-ecute Q/Qp that could not satisfy SLORT. Hence, Q/Qp
should be executed on a less loadedNodePthat also re-ceives a replica ofdl.
C. A dynamic adjustment of the replica factor, i.e., number of replicas, is also considered. Adding a new replica occurs in order to satisfy SLORT, which avoids penalties. On the other hand, unnecessary replicas are compressed and sub-sequently removed when SLORTis satisfied over time or ac-cording to the changes in the user’s access patterns. This reduces the consumption of resources, which increases the provider’s profits.
For evaluation purposes, we based on TPC-H queries and com-pared RSPC to four other strategies with regard to several metrics, including the average RT and the average replica factor for both uniform and skewed data distributions, the impact of the num-ber of VMs, the query arrival rate and the query complexity on performance, the number of SLA violations and resource expendi-tures of the provider. RSPC not only provides acceptable RTs that satisfy SLORTbut, takes into account the provider economic profit, especially under high workloads, strict RT thresholds and complex queries. It responds better to changes in the user’s access patterns. Replication overhead costs are also reduced since most of replica-tions are performed per set of queries. Moreover, RSPC generates fewer expenses, e.g., penalties and data transfer costs.
Overall, the contributions of this paper are: (i) we propose a replica creation per query or (more often) per set of queries in or-der to simultaneously satisfy SLOAVand SLORTin a profitable way, (ii) the NB hierarchy based heuristic aims to quickly find an ac-ceptable replica placement, (iii) the replica factor is dynamically adjusted, and (iv) the replication cost as well as penalties are fac-tored into the proposed economic cost model. The rest of this pa-per is organized as follows: Section 2 gives some cloud charac-teristics and the considered architecture. Section 3 presents the RSPC replica management (replica creation, replica placement and replica factor adjustment). Section 4 deals with a query RT esti-mation. Section 5 describes the proposed economic cost model.
Section 6 shows the experimental results.Section 7 analyzes the related work. Finally,Section 8concludes the paper and gives some future work.
2. Background and architecture overview 2.1. General context
Several tenants may simultaneously place their queries in the cloud. Thus, adopting a virtualization technology, through the cation of VMs on a physical machine, reduces the amount of
re-Fig. 1. An example of a distributed data center architecture.
sources required to execute each tenant query. In this context, scal-ing out, that we consider in this paper through data replication, re-sults in less provisioning of resources than scaling up, i.e., adding resources within a physical machine (Hwang et al., 2016). Hence, an elastic resource management is critical to minimize operating cost while ensuring tenant SLOs, e.g., SLORT. These resources, e.g., replicas, are allocated so that a provider and its tenants agree on an SLA (Hameurlain and Mokadem, 2017), e.g., RT of tenant’s queries should be less than a threshold defined in the SLA. Mainly, an SLA includes: (a) one or several SLOs, (b) a validity period, (c) a billing period (BP) during which the provider rents services to its tenants, (d) an agreed monetary amount paid by the tenant to the provider for the processing of its queries during a BP, and (e) an agreed monetary penalty amount paid by the provider to its ten-ant in case of breach of the SLA (Da Silva et al., 2012).
2.2. Architecture overview
Some companies consider the transferring of all data to a single DC/cluster when executing a tenant query. This generates a sig-nificant data transfer. Given that users as well as data are scat-tered across the globe, cloud systems should be deployed across multiple DCs covering large geographical areas.2,3 Some recent
solutions, e.g., (Cooper et al., 2008; Ardekani and Terry, 2014;
Tos et al., 2016), model a two level hierarchy, i.e., a region is com-posed of a single DC, while optimizing the cross-region data trans-fer consumption. However, links between DCs are heterogeneous (Gupta et al., 2014). Then, a NB hierarchical model is more real-istic. In this paper, we consider within a region, several DCs that communicate through an intermediate NB. This leads to a system topology with three levels: regions, DCs and nodes that host data.
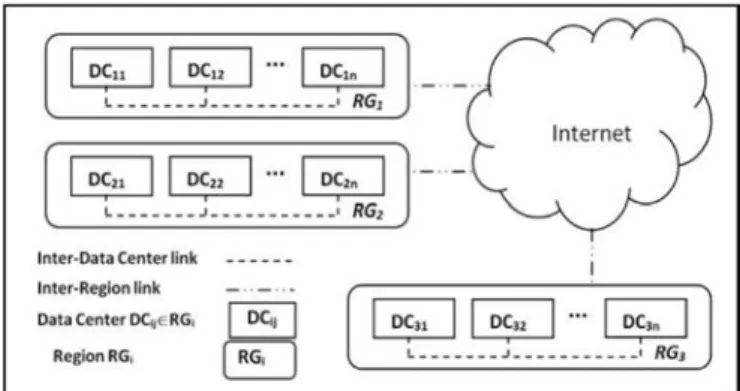
LetRG={RG1,…, RGi,…, RGq}with(1≤i≤q)be a set ofq
geo-graphical regions connected via the Internet without a direct link between them (Fig. 1).Thus, the NB capacity between geographical regions is not abundant and expensive. Each region contains het-erogeneous DCs. We useDC={DCi1,…, DCij,…, DCin}with(1≤j≤n)
to denote a set of n DCs within a region RGi. The NB between
these DCs is more abundant and cheaper compared to the first level. Finally, within each DCij, we use N={Nij1,…, Nijk,…, Nijm}
with(1≤k≤m)to denote a set ofmheterogeneous nodes, i.e., VMs (Fig. 2). They are connected by a high NB that is even cheaper than the NB between DCs within a region.
As a real scenario, we consider a cloud system composed of dis-tributed DCs over three countries (RG1, RG2 andRG3) as shown in
Fig. 1. DCs withinRGiare located in different cities. Then, eachDCij
2Microsoft DCs. http://www.microsoft.com/en-us/server-cloud/cloud-os/
global-datacenters.aspx.
3Google DC Locations. http://www.google.com/about/datacenters/inside/
locations/.
Fig. 2.An example of a data center DCij.
contains a number of VMs with a storage disk volume and com-putational resources for each VMijk, i.e., Nijk. This corresponds to a shared-nothing architecture (Ozsu and Valduriez, 2011). When a tenant query is received inRGi, the manager ofRGicoordinates its
execution across nodes∈RGi and keeps track of important infor-mation such as the number of replicas and their locations. Then, a replica manager within each DC is responsible for creating/deleting replicas. It updates the RGi manager whenever a replica is cre-ated/deleted.
3. The proposed replication strategy
The proposed RSPC strategy aims to satisfy tenant’s SLOAV and SLORTin a profitable way. Below, we present the RSPC replica man-agement, including: replica creation (When to replicate?), replica placement (What and where to replicate?) and replica factor ad-justment (How many replicas to create?) while ensuring an eco-nomic profit for the provider.
3.1. Replica creation
RSPC replica creation is considered only in the following sce-narios:
(i) Initially, when satisfying a minimum availability objective SLOAV, and
(ii) When the RT objective (SLORT) is not satisfied. This is checked by estimating the RT of a tenant query Q(RTQ)
be-fore its execution. Then, a replication may be necessary to satisfy SLORT again. The replication decision relies on: (a) a cost model that estimates RTQ and (b) an economic cost
model that estimates the provider profit (Q_Profit) when ex-ecuting Q while considering a replica creation.
3.1.1. Replication for satisfying SLOAV
Authors inWei et al. (2010)affirm that too many replicas may not increase availability. Thus, ensuring a given SLOAV corresponds to maintaining a minimum number of replicas for each data set d, e.g., triplication is considered in HDFS (Cheng et al., 2012). As shown inAlgorithm 1 (line 2), RSPC replicates initially each data set, e.g., a DB relation, (Repl_Fact_Min)times.Repl_Fact_Min corre-sponds to the minimum number of replicas that satisfies SLOAV. Thus, the number of replicas ofd(Repl_Fact_d) should always be superior toRepl_Fact_Min.
In order to satisfy SLOAV, each data setd ∈Nijk within DCij ∈
RGi is replicated initially on: (a) a node Nijk’ ∈DCij (k’ = k), with
Nijk’ the least busy node∈DCij, (b) a node∈DCij’ ∈RGi (withj’= j) with DCij’, a neighbour DC ofDCij, and (c) a node across each
regionRGi’(i’=i).
3.1.2. Replication for satisfying SLORT
Suppose that a cloud provider receives thousands of (read-only) tenant queries. Suppose also that a given tenant query is executed
Algorithm 1
RSPC Replica Creation.
Input:RTQ, RT_SLO_PSQ, RT_SLO_PQ, NSetQ, Repl_Fact_Min, Repl_Fact_d. Initially, NQ=0.
Output:Replica creation on NodeP.
1. Begin
// Initial SLOAVsatisfaction
2. While(∃d/ Repl_Fact_d<Repl_Fact_Min)then{d replica creation} // SLORTsatisfaction
3. Before each query Q execution
4. {If(RTQ<RT_SLO_PSQ) then No Replica creation; 5. Else {if(RTQ<RT_SLO_PQ)then
6. if (NQ<NSetQ)thenNo replica creation; NQ++;
7. else —>replication per set of queries if(NodeP is found / (RTQ<RT_SLO_PSQ & Q_Profit>0) 8. then {New replica creation on NodeP; NQ=0} 9. Else// RTQ>RT_SLO_PQ—>per-query replication 10. if(NodeP is found / (RTQ<RT_SLO_PSQ & Q_Profit>0) 11. then {New replica creation on NodeP; NQ=0} 12.}}
13. Q execution
14. End
on an overloaded node or requires a remote access to distributed data sets. This may increase the RT of such a query.
The proposed RSPC strategy estimates whether SLORT is satis-fied or not before the execution of each tenant query Q. For this aim, RTQ is estimated. It corresponds to the estimated elapsed
time from the initiation to the completion of Q (Ozsu and Val-duriez, 2011). RT estimation is investigated in a further section. The estimatedRTQvalue determines whether:
(i) There is no replication, i.e., no replication is required. It means that SLORTis satisfied. It occurs ifRTQ<RT_SLO_PSQ
(line 4 inAlgorithm 1).RT_SLO_PSQis an agreed RT thresh-old defined in the SLA. Its value is previously negotiated be-tween the provider and each tenant. It depends on the needs of applications or on the tenant’s willingness to pay more for a strict RT threshold (requiring more resources to the provider) or a little less for a relaxed RT threshold (requiring less resources to the provider), or
(ii) A replication may be triggered. In this case, two replication types are possible: per-query replication or replication per set of queries:
Per-query replication. If the estimated RTQ is superior to
RT_SLO_PQ, a data replication is immediately considered (line 9 in
Algorithm 1).RT_SLO_PQis a critical (maximum) query RT thresh-old defined in the SLA, withRT_SLO_PQ>RT_SLO_PSQ. It is previ-ously established by the provider in order to limit the penalties paid to the tenant. This replication is called ‘per-query’ since a replication is considered when the estimated RT of a single query exceedsRT_SLO_PQ.
Replication per set of queries.Managing data replication in a per-query way may increase RTs, especially with a high query ar-rival rate. In order to reduce the replication overhead generated by repetitive replications, RSPC most often deals with a replication per set of queries. In this case, a data replication is considered if the estimatedRTQ belongs to [RT_SLO_PSQ, RT_SLO_PQ] for a given
number of times, i.e., a number of past queries were also in this in-terval. By this way, we avoid creating a new replica each timeRTQ
exceeds a non-critical threshold (RT_SLO_PSQ). Hence, the replica-tion per set of queries is triggered more often than the per-query replication.
In Algorithm 1, SLORT is still satisfied if no more than NSetQ queries have an estimated RT ∈[RT_SLO_PSQ, RT_SLO_PQ] (line 6). A replication per set of queries is considered ifRTQ ∈[RT_SLO_PSQ,
RT_SLO_PQ] for the NSetQth time (line 7). NQcorresponds to the
number of queries for which the RT was estimated in this interval.
3.1.3. Ensuring the provider profit
Even if a replication is considered (per-query or per set of queries), a replica is really created only if a node that could re-ceive a new replica is found so that SLORT is satisfied again, i.e., RTQ<RT_SLO_PSQ. Furthermore, this replication must be profitable
for the provider (lines 7 and 10 inAlgorithm 1). For this aim, the economic benefit of the provider (Q_Profit) is also estimated before deciding to replicate (before the execution ofQ). This leads to the estimation of the provider’s revenues (Q_Revenues) and expenses (Q_Expenses)as shown in Formula(1).
Q_Pro f it= Q+Re
v
enues− Q_Expenses (1) Ensuring profitability for the provider when executing Q means that its revenues amount must be superior to its expenses amount when several tenants are served. Estimation of these costs is inves-tigated in a further section.To summarize, a replica creation occurs: (i) initially, when satisfying SLOAV, or, (ii) before the execution of each query Q,
a replica creation is considered if SLORT is not satisfied. It oc-curs if: (RTQ>RT_SLO_PQ), i.e., replication per-query, or, if (RTQ
∈ [RT_SLO_PSQ, RT_SLO_PQ] when the estimated RTs of NSetQ-1 past queries were also in this interval), i.e., replication per set of queries. However, a new replica is really created only if a replica placementNodeP is found so that(RTQ <RT_SLO_PSQ) is satisfied
again andQ_Profit>0.Table 1summarizes the parameter notations used in this paper.
3.2. Replica placement heuristic
Without an efficient replica placement, replicas may be dis-tributed in an unbalanced way. In consequence, some nodes may contain more replicas than they can support, which generates an overload. Replica placement among nodes has been proven to be NP-hard (Kumar et al., 2014).
Let’s assumeQEP:<Q, NEP>a given Query Execution Plan that is provided for each tenant query Q withQ: {Q0, Q1,…, Qp,… Qn-1} a set of n operators, e.g., joins, and a Node Execution Plan NEP: {Nijk, Nijk’,…, Nij’k} with (j = j’ & k = k’) a set of nodes within
a same region RGi. NEP includes both nodes that execute Q and
nodes that store all data sets, e.g., relations, required by Q and their existing replicas. Suppose that QEP does not satisfy SLORT. Thus, a replica placement NodeP should be selected to receive a new replica in order to satisfy SLORT in a profitable way.For this aim,NodePshould have low load, enough storage space and suffi-cient NB to serve the new replica.
Table 1
Summary of parameter notations. Parameter abbreviation Meaning
Nijkor VMijk Virtual machine∈DCij∈RGi DCij A data centerDCij∈RGi
RGi A regionRGi
SLOAV Minimum availability objective SLORT Response time (RT) objective
RTQ The estimated RT ofQ
RT_SLO_PQ Critical RT threshold (per-query repl. is considered each timeRTQ>RT_SLO_PQ)
RT_SLO_PSQ Lower (non-critical) RT threshold (repl. per set of queries is considered ifRTQ∈[RT_SLO_PSQ, RT_SLO_PQ] for theNSetQthtime) Qp An operator⊆a tenant queryQ
NodeP The selected placement node for a new replica
NBijk.NodeP Available network bandwidth (NB) betweenNijkand NodeP Loadijk Estimated load inNijk
Repl_Fact_d Replica factor for data setd
Repl_Fact_Min Minimum replica factor for satisfyingSLOAV QEP A given query execution plan forQ
NEP Nodes∈RGiexecutingQ& storing data sets required byQand their existing replicas
BP Billing period
Q_Profit Estimated monetary profit for the execution ofQ Q_Revenues Estimated monetary revenues for the execution ofQ Q_Expenses Estimated monetary expenses for the execution ofQ RTEQ The RT effectively measured when the provider executesQ
Ti A tenantTi
Ti_Amount The provider’s revenue received fromTifor executing a number#Qof queries
Pen_RT A penalty (monetary amount) paid by the provider toTifollowing an SLA breach
Identifying the best placement node requires visiting all nodes, which can lead to an overload. Instead, we propose a replica place-ment heuristic that provides an appropriate, i.e., an acceptable but not the best, replica placementNodeP. It is selected within the re-gion RGi that contains NEP. We are not looking outside RGi as in
Tos et al. (2017). As a result, the search space is significantly re-duced. LetSdrbe the size of a remotedr∈NodeRrequired byQp⊆
Q, Sdl the size of a local data set dl required by Qp executed on
NodeO, S(NodeP)the available storage capacity onNodeP, Loadijkthe
load estimation on Nijk provided by a workload manager within
DCij, NBNodeR.ijk the NB from Nijk to NodeR and Q_Profit the
esti-mated provider profit when a new replica creation is considered. RSPC replica placement starts by identifying the bottleneck resource that generates the unsatisfaction of SLORT. Two possi-ble scenarios can cause a bottleneck: (i) a bandwidth bottleneck is generated by a transfer of required remote data dr (∈NodeR)
through a low NB when processingQp.Then, satisfying SLORT con-sists in findingNodePwith a better NB to the node that requiresdr
whenNodePreceives a replica ofdror, (ii) a node that executesQp
is overloaded despite only local data dl are required on this node. Then, Qp should be executed on a less loaded nodeNodeP, which
will also receive a new replica of dl. Below, identifying NodeP is
detailed for each scenario.
3.2.1. Scenario 1: SLORTnot satisfied because of a remote data
transfer bottleneck
This situation occurs whenQpneeds drthat is received from a
remote NodeR with a low NB (line 2 inHeuristic 1). We start by identifying NodeT ∈NEP inDCij, which has the least NB to
repa-triate dr from NodeR (line 3), i.e., NBNodeT.NodeR=Minijk(NBijk.NodeR)
withNijk ∈NEP. Then,NodeP should be identified in order to
re-ceive a new replica of dr. The NB is checked between each Nijk
∈DCij (Nijk= NodeR) andNodeT. The node having the best NB to NodeTis selected to be NodeP, i.e.,NBNodeT.NodeP=Maxijk(NBNodeT.ijk)
(line 4). It should have enough storage to store a replica of dr. Then, if (i) RTQ < RT_SLO_PSQ (line 5) and (ii) the provider
esti-mates that it has a profit while considering this replication (line 12), dr is replicated onNodeP (line 13) and Q is executed on the
updated NEP (now,NEP also containsNodeP). Otherwise, the pro-cess is repeated with other remote data required by other nodes∈ NEP(line 6).
3.2.2. Scenario 2: SLORTnot satisfied because of an overloaded node
This situation occurs when SLORTis not satisfied because some nodes are overloaded (line 7 inHeuristic 1). We start by identifying the most loaded (busy) nodeNodeO∈NEPthat holds a local data setdl when executingQp (line 8), i.e.,LoadNodeO =Maxijk(Loadijk).
Suppose that NodeO ∈DCij. The next step consists in identifying the less loaded node∈DCij (line 9), i.e.,LoadNodeP=Minijk(Loadijk), so that it could receive a replica ofdl, i.e.,S(NodeP)>Sdl. It could
also executeQpso thatRTQ<RT_SLO_PSQ(line 10). If SLORTis not
yet satisfied, the process is repeated with other nodes∈NEP and so on (line 11). On the other hand, ifNodePis found so that SLORT
is satisfied and the provider has an economic benefit, a replica of dl is created onNodeP (now, NodeP ∈NEP) Finally, Q is executed
onNEP.
In both scenarios, if NodeP is not found or replication is not profitable,Qis executed on the initial NEPand penalties are paid by the provider to its tenant.
3.3. Replica factor adjustment
A static over-provisioning of replicas constitutes a naive solu-tion, which would mostly result in resource over-utilization and lower provider revenues (Bonvin et al., 2011). We have seen that RSPC deals with an incremental replication. As long as it is nec-essary and profitable, replicas are created by one in order to satisfy SLORT. However, creating a new replica consumes addi-tional resources, e.g., NB and storage, which increases the ex-penses of the provider. Then, the provider should avoid unnec-essary replications. As an example, replicas of unpopular data in
Cheng et al. (2012)are erased in order to save storage resource consumption while ensuring fault tolerance. In this paper, we pro-vide a dynamic replica factor adjustment in order to minimize re-source consumption while satisfying SLORT.
Instead of a periodic replica factor adjustment as in
Tos et al. (2017), the replica factor adjustment in RSPC is de-tected through the RT estimation as shown in Heuristic 2. It occurs when SLORT is satisfied over time. It is considered when RTQ is far below RT_SLO_PSQ, i.e., RTQ ≤
β
×RT_SLO_PSQ, withβ
< 1 (its value is established by the provider). In this case, it means that some nodes are under loaded or some replicas are less accessed and therefore unnecessary.Heuristic 1
RSPC replica placement.
Input:Set of Nijk∈NEP∈RGi, Qp⊆Q requires remote dr(∈NodeR) and/or local dl(∈NodeO executing Qp). Initially, we suppose thatSLORTis not satisfied&NEP’=NEP.
Output:NodeP (replica placement node).
1. Begin
2. If(dr=∅)then// Remote data transfer bottleneck
3. {Find NodeT (∈NEP) that requires dr/ NBNodeT.NodeR=Minijk(NBijk.NodeR) 4. Find NodeP∈DCij/ NodeP∈NEP & NBNodeT.NodeP=Maxijk(NBNodeT ijk) 5. if((NodeP=∅) & S(NodeP)>Sdr& (RTQ<RT_SLO_PSQ))then {NEP<– NEP- NodeR+NodeP; goto 12}
6. else {NEP<– NEP- NodeT;
ifNEP=∅then {NEP=NEP’; goto 14} elsegoto 3}} 7. Else//Overloaded NodeO
8. {Find NodeO (∈NEP) that requires dl/ LoadNodeO=Maxijk(Loadijk) 9. Find NodeP∈DCij/ NodeP∈NEP & LoadNodeP=Minijk(Loadijk) 10. if((NodeP=∅) & S(NodeP)>Sdl& (RTQ<RT_SLO_PSQ))then {NEP<– NEP – NodeO+NodeP; goto 12}
11. else {NEP<– NEP - NodeO;ifNEP=∅then {NEP=NEP’; goto 14} elsegoto 8}} 12. If(Q_Profit>0)then// Provider profit check
13.dr(dlrespect.) is replicated from NodeR (NodeO respect.) to NodeP 14.Q execution on NEP
15. End
Heuristic 2
RSPC unnecessary replica removal.
Input: NEP, Qp⊆Q,β, RT_SLO_PSQ, RTQ, d (data set required by Qp), Repl_Fact_Min, Repl_Fact_d. Output: N_Remov the selected node hosting the replica to be removed.
1. Begin
2. If (RTQ≤β×RT_SLO_PSQ) then
3. {Find d∈N_Remov∈NEP / d is the least popular data set
4. If (Repl_Fact_d>Repl_Fact_Min) then
5. {Compress a replica of d∈NEP (can be deleted after T);
6. Repl_Fact_d=Repl_Fact_d - 1}
7. elsegoto 3 & repeat with another data set required by Qp} 8. End
Data popularity constitutes an important parameter considered by many strategies, e.g., the most requested data are replicated in
Ananthanarayanan et al. (2011). A popularity of a data setdis de-termined by analyzing the access to dfrom users during a unit of time (Ranganathan and Foster, 2001). Concerning the selection of unnecessary replicas, RSPC selects the replica of the least pop-ular data set d required byQp. Replicas of unpopular data waste
the storage resource and generate considerable bandwidth costs (Liu et al., 2018).
Suppose that d is stored in N_Remov ∈ NEP (line 3). Then, the least accessed replica (of d) is selected within NEP. In RSPC, we do not remove this replica since it might be accessed again in the near future. We propose to compress this replica as in
Liu et al. (2018)to avoid recreating it later. After that, if it is not accessed during a given period of timeT (set by the provider), it is permanently deleted (line 5). However, deleting a given replica is not systematically done since SLOAVshould also be satisfied, i.e., Repl_Fact_d≥Repl_Fact_Min.
Also, some important data may have higher priority of obtain-ing relatively more replicas. A good solution is to assign a weight for each data and then create a large number of replicas for the weighted data. We defer this issue to future work.
4. Query response time estimation
Although several approaches are possible for storing and pro-cessing data, e.g., in NoSQL systems, the success of commercial relational clouds, e.g., (Amazon Relational Database Service (RDS), 2019), proves that relational DBMSs are still useful in the cloud era. Let’s assume that a cloud receives DB tenant queries. Let’s also assume that a DBMS query optimizer provides our strategy with a near-optimalQEP before the execution of each tenant query Q
within a region RGi. It provides the location of all required
rela-tions and their replicas withinRGi.
RSPC checks whether the given QEP satisfies SLORT based on the estimation of RTQ. For this aim, the costs of all resources
required for the execution of Q are estimated as given in For-mula (2) (Tomov et al., 2004). Thus, the costs of processing Q (CPU_Q_Cost), data access Input/Output (IO_Q_Cost) and data trans-fer between nodes (Transf_Q_Cost) are estimated before the execu-tion ofQ.
RTQ=MAX[
(
CPU_Q_Cost+10_Q_Cost)
,Trans f_Q_Cost] (2)We assume that CPU and I/O resource consumptions do not oc-cur simultaneously on a single node. We also assume that a query execution can start before the transfer of all data, e.g., as soon as a significant amount of data such as a page becomes available lo-cally. We benefit from several studies in distributed DBMS, e.g., (Tomov et al., 2004), dealing with a query RT estimation. In what follows, we estimate the RT of a DB query when considering the above costs. Then, we highlight some important factors that im-pact this estimation.
4.1. RT. estimation of a DB query
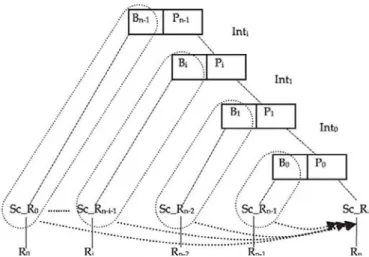
RT estimation of a single query with no dependent operations, i.e., no joins, is relatively simple. In contrast, estimating the RT of a query with multiple dependent operations such as joins is more difficult (Tomov et al., 2004). In what follows, we estimate the RT of a relational multi-join DB query. We consider the join operator in its simple hash version. A hash table is built in memory through the Build operator. Then, the join result is produced through the Probeoperator (Ozsu and Valduriez, 2011) as shown inFig. 3.
Definitions and assumptions.LetQEP:<Q, NEP>withQ:{Q0,
Fig. 3. E.xample of a dependency graph for a righr-deep query rree.
(n
+
1)relations
(R
0, R1, ... ,
Rn), NEPis a set of nodes scattered over
DCs within a region
RG;.
lt contains nodes that execute operators
of
Qand also ail nodes that hold the required relations and their
replicas. For ease of presentation, we assume that each node has
a large enough memory to hold hash tables. We also assume that
the effect of bucket overflow is believed not to affect the processor
performance. Recall that a DBMS catalog stores statistical informa
tion about DB relations that we based on when estimating
RTQ,We
benefit from some studies, e.g., (
Tomov et al., 2004)
, to obtain an
accurate estimate of the selectivity.
Let NT; be the number of tu pies of R;, S; the size of a R; tuple (in
bytes). lreacv'lwrire
the #fast to read/write a data page from/to a disk,
Psize
the number of tuples per page,
lrup
le
the cost of extracting a
tuple from a page in memory,
leuild/Probe
the number of CPU in
structions each tuple needs for relation building/probing, NT
8; the
build relation size (number of tu pies) of the
jChjoin and
NT Pithe
probing relation size of this join. Let also Tcpu be the duration of a
CPU instruction.
Example of a DB query.
We focus on a right-deep query tree
as shown in
Fig. 3
, i.e., Q=(Ro join
(R1 join(R
2 join( ... join
(Rn.1
join Rn) ... ). lt provides the best potential for exploiting parallelism.
Also, the size of a
Buildcan be more accurately predicted since
the cardinality estimates are based on predicates applied to base
relations.
RT estimation.
Ali scans of relations Sc_R; followed by
buildoperators
B;(enclosed by dotted lines in
Fig
.
3
)
are independent.
Hence, hash tables can be built in parallel (independent paral
lelism) in order to produce the different B;. As a result, only the
longest path (Sc_Rn·i-l followed by B;) is taken into account when
estimating the CPU cost of building hash tables. This justifies the
using of
MAXin the first part of Formula
(3)
(
Hsaio et al., 1994
).
Then, we add the required cost for executing
nprobe operators
that constitutes a pipeline chain. Each probe operator
P;consumes
the output of the corresponding B;. lt begins after the end of P;-t
(NTPiis the size of the (i-l)th join operation, except NT
ro=NTn in
Fig
.
3
). The estimated CPU time when executing
njoins is as fol
lows:
CPU _Q_Cost
= [
MAX;'!.o (
(NT;f Psize
x
lread)
+
(NT;
x
lru,xe)
+(NTBi-1
X
IBuild))
+
t
(NTp; X
!Probe)]
xTcrux(l+a+L)
(3)
with o: > 0, a weighting factor, including hardware capabilities, e.g.,
the processing rate, the average 1/0 disk throughput and caching
capabilities on different
Nijk·Let
Lbe the average load factor that
takes into account the load in each
Ny'kconcerned by the execution
of Q, We discuss the load on
Nijkin the next subsection. Dealing
with left-deep and bushy query trees requires only some adjust
ments, e.g., in a left-deep query tree,
NT
8nis equal to the size of
the last join operator (NT
PtJ.1) except the first
Build(equal to NTn),
n
(NixS
·
)
10_Q_Cost =
L
---j;;--2-
x
t
pio
i
=O
Srze
(4)
When executing Q, the required relations are read from the disk
of the nodes hosting these relations. Whether remote or local data
are concerned, 1/0 resources are consumed. The time required for
reading depends on the size of the data read from the disk. Let
us deal with the cost of reading
(n
+ 1)
relations. Let
t
pio
be the
disk service time per page. The estimated 1/0 cost of
Qis given in
Formula
(
4
)
.
The execution of Q also requires data transfer between different
nodes. Then, the NB available between nodes is taken into account.
Let
NBbe the average NB (bytes/s) between the nodes E
NEPin
volved in the execution of Q, Here, each intermediate relation /nt;
(resulting from a Probe P;) is always sent to the node that executes
the next join ( except the last Pn-t that produces the final result).
The NB consumption also depends on the amount of data trans
ferred. Let s,nr be the size (in bytes) of /nt; tuple. The estimated
data transfer cost is shown in Formula
(
5
)
.
[n-1
]
Transf _Q_Cost
= �
(NTPi
x S;) + (NTn x Sn)
/NB
(5)
4.2. Important factors for the RT estimation
Different factors are taken into account when estimating the RT
of Q, We have seen that data size and NB (between nodes within a
region in RSPC) constitute important factors that significantly im
pact the RT estimation. ln what follows, we also consider the work
load on each node that executes Qpç;;
Q,
AR;il<
Loadiik
=
L
(CPU_Qp_Cost)
x (1 + C)
P=l
(6)
Let
Loadijkbe the estimated workload on a given
Nijk·lt takes
into account the arrivai rate
ARon
Nijk (ARy'k)that corresponds
to the number of concurrent
Qpexecuted on
Ny'kby unit of time.
Thus,
Loadijkdepends on the sum of computing costs of ail Qp
ex
ecuted or awaiting execution on
Nijkas shown in Formula (6) with
C > 0, the query complexity factor in
Nijk·lt corresponds to the
number of executed joins on
Nijk•i.e., the number of hash tables
on
Nijk·The average of ail
Loady'k(in ail nodes concerned by the
execution of Q) corresponds to the average load factor
Lintroduced
in Formula (
3
). CPU_Qp_Cost corresponds to the computing cost es
timation of
Qp. lts estimation (in s) depends on the number of instructions
#lnstrequired for processing
Qp
as shown in Formula
(7)
.
CPU_Qp_Cost
=
#lnst
x
Tcru
x (1
+
a)
5. Management of provider economic costs: economic cost model
(7)
A cloud provider aims to generate profits when executing the
tenant's queries while meeting tenant SLO requirements. For this
aim, a replication can be triggered in order to satisfy SLO
Rr and
thus avoid the payment of penalties to its tenants. ln RSPC, a new
replica is created only if the estimated monetary incomes received
by the provider (Q_Revenues) are superior to the estimated mone-tary expenses (Q_Expenses) required for executingQ. In what fol-lows, we propose a provider economic cost model that estimates Q_Revenues and Q_Expenses when executing Q in a multi-tenant context.
5.1. Estimation of the provider’s revenues and expenditures 5.1.1. Provider’s revenues
In order to improve their profits, providers implement a re-source sharing among multiple tenants by consolidating various tenant’s applications on a single system. Thus, multiple tenants are run on a same physical server (Long et al., 2014), e.g., a ten-ant can share a DBMS with another in the context of databases (Sousa et al., 2018). In return, each tenant pays the rent of re-sources to the provider according to the ‘pay as you go’ model, i.e., a tenant only pays what it consumes (Armbrust et al., 2010).
Q_Re
v
enues= n 1(
Ti_Amount)
/#Q +Rent_XaaS (8)In the proposed economic cost model, the provider serves sev-eral tenants and could receive two different amounts as shown in Formula (8):
(i) The service amount (Ti_Amount) received from each
ten-ant Ti served by this provider for the resources allocated,
which increases the economic provider profit. Some commer-cial providers, e.g., Google Cloud, charge a monthly rental of resources (for subscribers) when others charge for a shorter period, e.g., one hour with Amazon, or for a given number of queries. We consider pricing for a given number of queries#Q, e.g., 0.6$ per 1000 queries. Then, it is possible to calculate the expected income per-query (Q_Revenues). Recall that when exe-cuting a tenant query, the provider could create one or more replicas in order to satisfy SLORT. Therefore, a tenant is not billed for the number of replicas created when its query is ex-ecuted.
(ii) The probable average price of a service credit (Rent_XaaS) re-ceived when the provider rents a givenXaaSservice to another provider (Serrano et al., 2016).
Increasing the number of tenants through resource sharing de-creases the per-tenant performance but reduces the provider over-all operating cost (Long et al., 2014). Thus, it is desirable to in-crease the number of tenants in condition that the available re-sources are sufficient to meet the tenants’ objectives, e.g., SLORT. With the same pricing policy for all tenants, the optimal number of tenants to serve is equivalent to the largest number of tenants that the provider can serve while satisfying the SLA.
5.1.2. Provider’s expenditures
The provider has to pay the operating cost of each server ex-ecuting Q or storing/transferring the data required for that exe-cution. Thus, the provider’s expenditures correspond to the total price of all these resources. The estimate of these expenses is per-formed before the execution ofQ. It is given in Formula(9) that deals with the following denotations: Let RTQp be the estimated
RT needed to executeQp⊆Q.Let#VMbe the number of required
nodes that execute operators ofQ. LetCPU_Costbe the CPU cost by million instructions or by unit of time, e.g., one hour in Amazon’s cloud, for using a node allocated to executeQp.
The cost of replication is included to the provider’s expenses. We take into account the cost of estimating both the RT and the provider’s profit (Estim_Cost). Also, NB costs are consumed during the data transfer and storage costs are consumed at the destina-tion at each replica creadestina-tion. As the number of replicas increases
as the provider’s expenditures increase. This is why RSPC considers an elastic resource management through a dynamic replica factor adjustment as described above. It permits to reduce the provider’s expenditures. Let Sdl be the size of each stored data set. Let Sdr be the size of each transferred data set including the new repli-cas created. #D corresponds to the number of required data sets including their replicas. The storage of each of them has a mone-tary costStor_Costijk according to the prices applied in each DCij.
The network costNetw_Costfor the access/transfer to/ofr’remote data is also considered. It corresponds to the average cost of data transfers when executingQ. Obviously, it includes the cost of data transfer when creating a new replica.
Q_E xpenses= #V M p=1
RTQ p×CPU_Cost + #D l=1 Sdl_Costi jk + r r=1(
Sdr×Netw_Cost)
+E stim_Cost+A
v
g_Past_Pen_RT+XaaS_Cost+ln
v
_Cost (9)Penalties paid by the provider to its tenants are also factored into the economic cost model as shown in Formula(9). This cor-responds to the probable amount paid from the provider to Ti
when one/several SLO is/are not satisfied. Despite the provider takes necessary precautions, e.g., replication, in order to avoid the payment of a penalty, there may be some queries that do not sat-isfy SLORT. Indeed, we rely on the average penalty cost per query Avg_Past_Pen_RTpaid by the provider to its tenants in the previous BP. Also, the provider must take into account the price of the in-vestments, e.g., material, software licenses and power/energy costs (Inv_Cost). Finally, when the provider leases a given XaaS service from another provider, its expenses could include the price of the XaaS rental (XaaS_Cost).
5.2. Penalty management
When the provider executesQwith an effective RT greater than RT_SLO_PSQ, i.e., without creating a replica that satisfies SLORT, a violation of the SLA is recognized. It is computed as a penalty amount paid by the provider to its tenant. Here, we only focus on the SLORTviolation.
LetRTEQbe the RT effectively measured when the provider
exe-cutes Q. As shown in the RSPC penalty management (Algorithm 2), whenRTEQ<RT_SLO_PSQ, no penalty is paid (line 2). Otherwise, a
provider pays a penaltyPen_RTto its tenant (line 4).Pen_RTis also defined in the SLA and corresponds to the penalty amount paid each time RTEQ exceeds RT_SLO_PSQ. In order to minimize
penal-ties, we proceed as follows: whenRTEQ∈[RT_SLO_PSQ, RT_SLO_PQ],
the provider accepts to pay Pen_RT (after trying to avoid them through data replication). However, each time(RTEQ>RT_SLO_PQ)
is verified, i.e., per-query replication is triggered, the provider also pays Pen_RT while incrementing the value of V_Nber that corre-sponds to the number of times thatRTEQ exceedsRT_SLO_PQ.
Frequent SLA violations are damaging to the image of the provider. Hence, SLA violations should be reduced as much as possible. We propose to limit the number of critical SLA vio-lations, i.e., V_Nber < Critical_V_Nber, especially when the to-tal volume of data (Data_Vol) significantly increases compared to the DB volume agreed in the SLA (Vol_SLO) as shown in line 6 of Algorithm 2. If these two thresholds, i.e., Critical_V_Nber and Vol_SLO, are reached simultaneously, the provider can renegotiate the value of RT thresholds (on the rise) with its tenant as well as the service amount paid by the tenant.
Reducing the number of SLA violations reduces penalty costs. When analyzing formulas (1) and (9), it is clear that reducing
Algorithm 2
RSPC penalty management.
Input: RTEQ, RT_SLO_PSQ, RT_SLO_PQ, Pen_RT, Data_Vol, Vol_SLO, Critical_V_Nber. Initially, V_Nber=0. Output: Pen_RT paid from the provider to its tenant Ti.
1. Begin
2. if RTEQ<RT_SLO_PSQ then no penalty 3. else
4. {if (RTEQ<RT_SLO_PQ) then {Provider pays Pen_RT to Ti} 5. else {Provider pays Pen_RT to Ti;V_Nber++}
6. if ((V_Nber==Critical_V_Nber) and (Data_Vol>Vol_SLO)) then 7. {Negotiating new RT_SLO_PSQ/new RT_SLO_PQ; V_Nber=0}}
8. End
as much penalty cost as possible without increasing the cost of replication, as we do here, improves the economic profit for the provider.
6. Experimental analysis
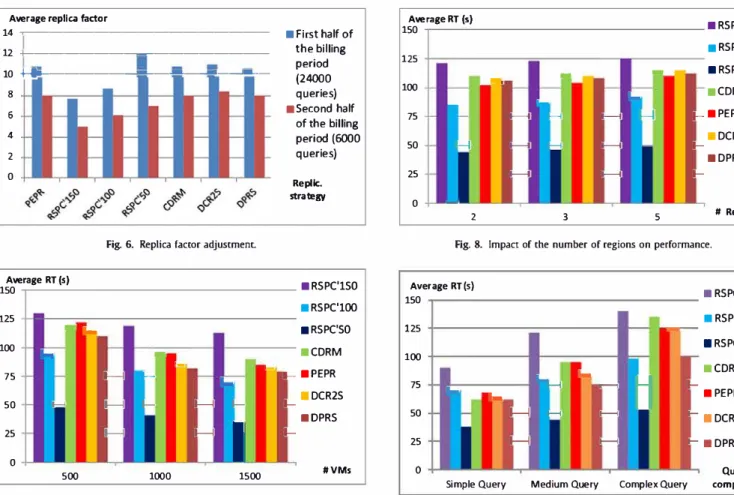
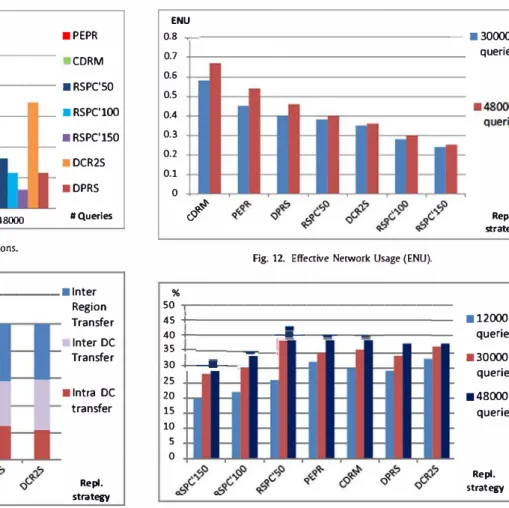
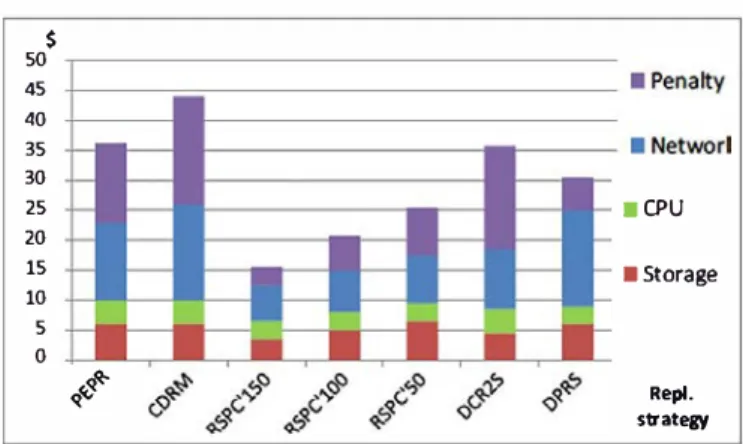
In order to evaluate the cost-effectiveness of RSPC, we compare its performance alongside four replication strategies proposed for cloud systems: (i) the Cost-effective Dynamic Replication Manage-ment strategy (CDRM) (Wei et al., 2010), (ii) the PErformance and Profit oriented data Replication strategy (PEPR) (Tos et al., 2017), (iii) the Dynamic Cost-aware Re-replication and Re-balancing strat-egy (DCR2S) (Gill and Singh, 2016) and (iv) the Dynamic Popular-ity aware Replication Strategy (DPRS) (Mansouri et al., 2017). In CDRM, a replica is placed on the node with the lowest blocking probability in order to reduce data access skew, which improves the load balance. A blocking probability is calculated on each VM. However, CDRM does not consider the economic aspects and SLA satisfaction as a decision criteria. PEPR benefits from the NB hier-archy, like RSPC, to reduce the NB consumption and takes into ac-count the provider profit when a new replica is created. However, it only deals with a per-query replication. DCR2S aims to create a replica for a data set if its popularity exceeds a threshold. Through the concept of knapsack, replicas are re-replicated from higher-cost DCs to lower-cost DCs in order to reduce the cost of replication. Load balancing of resources is neglected and the replication cost is fixed in advance (within a given budget). Finally, DPRS replicates only the top 20% of frequently accessed data on the best locations according to the number of users’ interests, free storage space and site centrality. Although the download time is reduced through the using of parallel downloading, it does not profit from the NB hier-archy.
6.1. Experimental setup and benchmark description
CloudSim (Calheiros et al., 2010), a popular and an open source cloud computing simulation tool, is used to simulate DCs. We sim-ulated a cloud with 3 regions as shown in Fig. 1. Within each region, we simulated 10 DCs. Then, 1000 heterogeneous VMs are implemented in each DC. We have extended CloudSim to support data replication, query placement and some important require-ments: (i) each VM has storage, memory and computing capacity and (ii) hierarchical NB capabilities and latencies are simulated be-tween VMs, DCs and regions. For resource characteristics, we based on Barroso et al. (2018) to realistically represent a typical Cloud environment. Economic concepts are also taken into account: (i) a monetary pricing is defined for each resource in accord with Google Cloud, AWS and Microsoft Azure4 prices, (ii) a tenant is
4Amazon S3 Pricing.https://aws.amazon.com/s3/pricing/. Azure storage pricing.
https://azure.microsoft.com/en-us/pricing/details/storage/. Azure data transfer pric-ing.https://azure.microsoft.com/en-us/pricing/details/data-transfers/. Google Cloud pricinghttps://cloud.google.com/compute/pricing?hl=fr. March 2019
Table 2
Configuration parameters.
Parameter Value
Number of regions (m) 3
Number of DCs within a region (n) 10 Number of VMs within a DC (q) 1000 Average (Avg) size of a relation 700 Mb
Avg. available inter-region BN (delay respect.) 500 Mb/s (150 ms respect.) Avg. available inter-DC BN (delay respect.) 1Gb/s (50 ms respect.) Avg. available intra-DC BN (delay respect.) 8 Gb/s (10 ms respect.) Average size of a relation 800 Mb
Average VM processing capability 1500 MIPS Average storage capacity/ VM 10 Gb Billing Period (BP) duration 10 min
#queries/ BP [3000, 48,000]
RT_SLO_PQ 180s
RT_SLO_PSQ {50, 100, 150}s
Provider revenues/ 1000 queries {1, 0.8, 0.6}$
Average Stor_Cost 0.15$/Tb
Intra-DCNetw_Cost 0.0005$/Gb
Intra regionNetw_Cost 0.002$/Gb
Inter regionNetw_Cost 0.07$/ Gb
Average CPU_Cost 1$/109MI
Penalty/ violation (P_RT) 0.0025$
NSetQ 10
Repl_Fact_Min 4
charged for a given number of queries (here#Q=1000) and (iii) an SLORTviolation is computed as a penalty amount.
We based on the TPC-H data generation program with skew.5
Two data distributions are considered: (i) uniform distribution that provides a naive baseline and (ii) non uniform, here zipf, distribu-tion, Breslau et al. (1999) that is designed to react to data pop-ularity and models unconstrained accesses from an independent population such as Internet users. The zipf factor (z) that con-trols the degree of skew is set to 1. The arrival rate of DB queries follows a Poisson distribution. Our experiments dealt with 3000, 12,000, 30,000 and 48,000 queries during a BP. The broker assigns cloudlets (associated to queries) to randomly selected VMs to ac-cess relations themselves distributed on randomly selected VMs. We considered a subset of TPC-H6 queries {Q4,Q10 and Q8} for
analytical purposes. These queries have different level of complex-ity {1, 3 and 7 joins respectively} when a right-deep query plan is pre-determined for each query. We call them simple, medium and complex queries respectively. We simulated a parallel execu-tion of queries launched simultaneously by several tenants. A read-only DB relation constitutes the granularity of replication. We dealt with a simulation since it allows us to directly control some pa-rameters in order to understand their individual impact on perfor-mance, e.g., query arrival rate and system configuration variations.
Table 2describes the main parameters used in our experiments.
5https://www.microsoft.com/en-us/download/details.aspx?id=52430. March
2019.
Average Replica factor 16 14 12 10 8 6 4 2 0
�
-3000 ->-(a) Average Replica Factor
aRSPC'lSO aRSPC'lOO
-
aRSPC'SO-
-.
•
-
•CDRM-
-
aPEPR >--
-
aDCR2S-
-
-
aDPRS >--
-12000 30000 48000 # Queries(b) Average Response Time
Average RT(s) 1so �--- aRSPC'lSO 3000 12000 30000 48000 •RSPC'lOO aRSPC'SO aCDRM aPEPR aDCR2S aDPRS # Queries
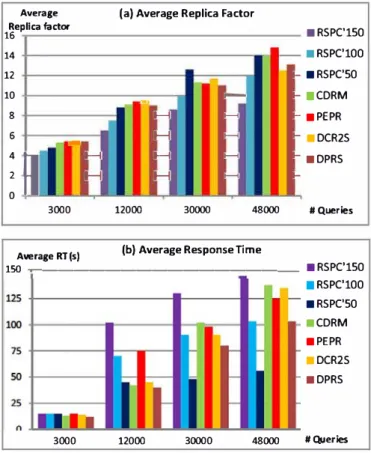
Fig. 4. (a) Replica factor and (b) RT with a uniform distribution.
6.2. Experimental results
We have measured
(
during a BP) the following metrics: (i) the
average replica factor and the average measured query RT with dif
ferent distributions, (ii) the replica factor adjustment, (iii) the im
pact of the query arrivai rate, the system configuration, and the
query complexity on performance, (iv) the number of SlA viola
tions and (v) the provider resource consumption and its expendi
tures.
RSPC experiments dealt with different values of
RT_sw_psQ,
from a more strict one (50 s) to a more relaxed one (150 s) with
an intermediate moderate value (100 s). The provider revenues de
pend on these thresholds as shown in
Table 2
. We denote the
RSPC strategy under these thresholds by RSPC'50, RSPC'150 and
RSPC'l00 respectively. The critical
RT_SLO_PQ
is set to 180 s. These
values are defined based on preliminary experiments.
6.2.1. Average response time and replica factor
Fig.
4
(
a
)
and (b) show the average RT and the average replica
factor obtained with the compared replication strategies when the
data distribution is uniform. We deal with queries that randomly
include simple, medium and complex queries.
When a low number of queries are submitted during a BP, e.g.,
less than 12,000 queries, PEPR presents the most important replica
factor since the replica decision is considered at the per-query
level, i.e., each time RT of a query exceeds the RT threshold (100s
here). The replica factor in CDRM, DCR2S and especially DPRS is
more important compared to RSPC (in its three options). In fact,
RSPC does not replicate data when SLO
Rr is satisfied while CDRM
aims to balance the workload between different nodes by creating
more replicas. DPRS provides the best RT while RSPC'150 provides
the most important RT. When the number of data access increases,
the RT also increases. When 30,000 queries are submitted during
a BP (50 queries/s), RSPC'50 presents the best RT. It creates the
Average RT (s) 150 125 100 75 50 25 0
.
.
-
�·
3000-
--
-l
-12000 30000 48000Fig. S. Average RT for a zipf distribution.