ORIGINAL ARTICLE
Yoichi Kojima · Tomoya Shimoda · Shigehiko Suzuki
Evaluation of the weathering intensity of wood-based panels under
outdoor exposure
Abstract In this study, the deterioration of wood-based panels at eight sites in Japan was investigated using outdoor exposure tests. In particular, the modulus of rupture (MOR) retention and internal bond strength (IB) retention after 5-year exposures were compared among panels and sites. The deterioration of panels located in southern Japan was higher than that of panels in northern Japan. To quantify the regional differences, the deterioration rates were calcu-lated; the values showed clear regional differences. The deterioration rate for areas that receive much rain in the summer was higher than the rates for other sites. To elimi-nate regional differences, we carried out an analysis in terms of the “weathering intensity,” a factor which combines weather conditions (precipitation and temperature). Panels for which deterioration progressed extensively during expo-sure periods showed a strong correlation between strength retention and the weathering intensity. The signifi cance of these parameters is discussed.
Key words Wood-based panel · Outdoor exposure · Weath-ering intensity · Deterioration rate · Weather condition
Introduction
Plywood is a typical wood-based material used in residential construction in Japan. It is superior to other wood-based panels in terms of strength and dimensional stability. On the other hand, mat-formed wood-based panels such as parti-cleboard (PB) and medium-density fi berboard (MDF) have become widely used in residential construction in recent years.
For such use, basic information on long-term durability of wood-based panels is necessary. An estimation of how long a panel can maintain the required performance under
Y. Kojima (*) · T. Shimoda · S. Suzuki
Faculty of Agriculture, Shizuoka University, 836 Ohya, Suruga-ku, Shizuoka 422-8529, Japan
Tel. +81-54-238-4856; Fax +81-54-238-4856 e-mail: aykojim@ipc.shizuoka.ac.jp
actual environmental conditions has been the goal of many studies evaluating the durability of wood-based materials.
To evaluate the durability of such panels, outdoor expo-sure tests at eight sites in Japan using commercial wood-based panels have been conducted by the Research Working Group on Wood-based Panels of the Japan Research Society since 2004. In our previous reports, the results [thickness swelling,1
internal bond strength (IB),2
and bending proper-ties3
] of 5 years of exposure in Shizuoka City were discussed, along with accelerated aging treatment results. Because outdoor exposure tests are considered an accelerated aging test, based on the natural environmental conditions, the deterioration mechanism was thought to be similar to the deterioration that occurs when wood-based panels are actu-ally used in housing construction. Many researchers have conducted outdoor exposure tests using wood-based panels.4–8
In Japan, several studies on outdoor exposure tests using veneer-based samples have been reported.9–11 Ten-year test results on wood-based panels were reported by Sekino and Suzuki.12
Several other studies on the durability of mat-formed panels have also been published.13–16
Outdoor exposure tests have many disadvantages. One of the greatest is that results are limited by the test loca-tion.17
Even when outdoor exposure tests use the same panels at all locations, there are differences in the deteriora-tion of panels among the locadeteriora-tions. Thus, the results of outdoor exposure tests conducted at specifi c sites are not applicable to sites with different weather conditions.
In this study, regional differences in the deterioration of panels are discussed. The deterioration rate of each panel was defi ned to compare test results. The deterioration rates were calculated using relationships between strength reten-tion and the outdoor exposure period. Furthermore, we attempted to eliminate regional differences in the deterio-ration of panels by defi ning the “weathering intensity,” based on weather parameters. The weathering intensity was defi ned as a weather-based force exerted on the panels during outdoor exposure tests. In this report, average daily temperatures and daily precipitation were selected as the weather parameters, and the weathering intensity was cal-culated to eliminate regional differences. The relationships
between the weathering intensity and the deterioration of the panels during 5-year outdoor exposure tests are discussed.
Materials and methods
Sample panels
The four groups of commercial wood-based panels used in this research – particleboard (PB), medium-density fi ber-board (MDF), oriented strandber-board (OSB), and plywood (PW) – are widely used for construction in Japan (Table 1). Each panel group included two panel types of differing specifi cations to give eight panels in all. The PB panels were made from recycled wood with different binders. The MDF panels differed in thickness, binder type, and end-use application. The OSB panels were made from imported products with different wood species. The PW panels also differed in thickness. Because the OSB used in this project was obtained from North America and Europe, these panels are not necessarily representative of the OSB typically used in Japan. Although North America produces very little methyl diphenyl diisocyanate (MDI)-bonded PB or MDF, MDI-bonded PB and MDF were selected because manu-facturers in Japan show a strong preference for PB and MDF with high durability performance. The parallel direc-tion on each panel surface was defi ned by the machine direction for PB and MDF, surface strand alignment for OSB, and surface veneer grain direction for PW. The mechanical properties, i.e., internal bond strength (IB) and modulus of rupture (MOR), of the commercially manufac-tured panels were measured before aging treatment and are summarized in Table 1.
Outdoor exposure tests at eight sites in Japan
For each panel type, 12 test sample boards, each 300 mm × 300 mm, were subjected to the outdoor exposure test at eight sites in Japan (Fig. 1): Asahikawa (43°N, 142°E), Morioka (39°N, 141°E), Noshiro (40°N, 140°E), Tsukuba (36°N, 140°E), Shizuoka (34°N, 138°E), Okayama (South; 34°N, 133°E), Okayama (North; 35°N, 133°E), and Miyako-nojo (31°N, 131°E). Annual average temperatures, annual
precipitation, and climate classifi cations are listed in Table 2. Monthly average temperatures and monthly precipitation for 5 years are shown in Fig. 2. All four edges of the sample boards were coated with a protective agent to prevent excessive edge swelling due to water contact during expo-sure. The boards were set vertically on a test frame that faced south. The outdoor tests began in March 2004 and will run until 2013. In this article, the results of 5 years of expo-sure are discussed. Two test sample boards of each type of panel were removed after 1, 2, 3, 4, and 5 years of exposure, and their IB and bending properties were measured after reconditioning at 20°C and 65% relative humidity (RH) for 2 weeks. Eight bending samples with a dimension of 250 mm × 50 mm and thirteen IB test samples (50 mm × 50 mm) were prepared from the reconditioned samples. The bending and IB tests were performed in accordance with JIS A-590818
and were conducted using a universal testing machine (Model TCM-1000, Shinkoh).
Table 1. Specifi cations of the tested commercial panels and the modulus of rupture (MOR) and internal bond strength (IB) for control samples
Board type Adhesive Thickness (mm) Density (g/cm3) Construction MORa (MPa) IBa (MPa)
PB(PF) PF 12.2 0.76 Three layer 21.6 ± 3.5 0.66 ± 0.08
PB(MDI) MDI 12.1 0.80 29.7 ± 2.4 1.97 ± 0.17
MDF(MUF) MUF 12.2 0.76 Homogeneous 44.9 ± 3.0 0.57 ± 0.07
MDF(MDI) MDI 9.1 0.72 33.8 ± 1.4 1.03 ± 0.11
OSB(aspen) PF 12.4 0.64 Three layer cross-oriented 37.7 ± 8.9 0.38 ± 0.12
OSB(pine) 11.8 0.68 36.0 ± 6.9 0.63 ± 0.20
PW(12) 12.0 0.64 Five ply 49.3 ± 13.4 1.11 ± 0.38
PW(9) 8.8 0.61 Three ply 71.8 ± 13.1 1.42 ± 0.37
a Data are given as means ± standard deviation
PB, particleboard; PF, phenol-formaldehyde; MDI, methyl diphenyl diisocyanate; MDF, medium-density fi berboard; MUF, melamine-urea-formaldehyde; OSB, oriented strandboard; PW, plywood
Okayama
(North)
Noshiro
Asahikawa
Morioka
Tsukuba
Shizuoka
Okayama
(South)
Miyakonojo
Results and discussion
Characteristics of MOR and IB retention in the outdoor exposure tests at eight sites
The MOR and IB for the control samples (untreated) are shown in Table 1. In this article, the strength retentions are defi ned as follows:
MOR retention (%) = (MOR after outdoor exposure / MOR for control samples) × 100
IB retention (%) = (IB after outdoor exposure / IB for control samples) × 100
Figures 3 and 4 show the changes in the strength retentions for 5-year outdoor exposure tests in eight regions. If the strength retention was greater than 100%, we deemed it to be 100% retention.
Figure 3 shows that the MOR retentions of the two par-ticleboards decreased linearly at all exposure sites. The decrease of phenol-formaldehyde (PF)-bonded particle-board [PB(PF)] was higher than that of methylene diphenyl diisocyanate (MDI)-bonded particleboard [PB(MDI)], and MOR retention of PB(PF) was less than 50% after 2-year exposure at four sites. On the other hand, MOR retention of PB(MDI) was less than 50% after 5-year exposure at only two sites [Okayama (South) and Miyakonojo]. MDFs maintained comparatively high MOR retentions at all sites for 5 years. The MOR retentions of oriented strandboard made from aspen [OSB(aspen)] in Shizuoka and Miyako-nojo were less than 50% after only 1-year exposure and were only 10% after 5-year exposure. For OSB(aspen), there were two patterns of decreasing MOR retention: (1) linearly decreasing sites in Northern Japan, i.e., Asahikawa, Morioka, Noshiro, and Tsukuba, and (2) exponentially decreasing sites in Southern Japan, i.e., Shizuoka, Okayama (South), Okayama (North), and Miyakonojo. The MOR retention of oriented strandboard made from pine [OSB(pine)] tended to decrease linearly for all regions. The variation among plywoods was large, so any characteristic tendencies were unclear.
The IB retentions are shown in Fig. 4. The decrease of PB(PF) was higher than that of PB(MDI). For PB(PF), the retentions at Shizuoka and Miyakonojo were less than 50% after 1-year exposure, and all sites located in Southern Japan had 50% retentions or less after 2-year exposure. Moreover, the retentions in Shizuoka, Okayama (North),
-10 -5 0 5 10 15 20 25 30
4 5 6 7 8 9 10 11 12 1 2 3 Month (average: 2004-2008)
M
ont
hl
y
av
er
age t
e
m
p
er
at
ur
e
(°C)
Asahikawa
Morioka
Noshiro
Tsukuba
Shizuoka
Okayama(S)
Okayama(N)
Miyakonojo
(a)
0 50 100 150 200 250 300 350 400 450
4 5 6 7 8 9 10 11 12 1 2 3 Month (average: 2004-2008)
M
o
nt
hl
y
pr
ec
ipi
tat
io
n
(m
m
)
Asahikawa
Morioka
Noshiro
Tsukuba
Shizuoka
Okayama(S)
Okayama(N)
Miyakonojo
(b)
Fig. 2. Climate conditions for the eight sites: a monthly average tem-perature, b monthly precipitation. The numbers on the x-axis represent the months of the year
Table 2. Weather conditions and climate classifi cations for the eight sites
Location Annual average temperaturea (°C) Annual precipitationa (mm) Classifi cation
Asahikawa 6.4 1091 Low temp. / low prec.
Morioka 9.8 1265
Noshiro 11.1 1746 Low temp. / middle prec.
Tsukuba 13.2 1308 Middle temp. / low prec.
Okayama (N) 13.7 1398
Shizuoka 16.1 2327 Middle temp. / high prec.
Okayama (S) 20.3 1160 High temp. / low prec.
Miyakonojo 21.9 2435 High temp. / high prec.
and Miyakonojo were less than 10% after 5-year exposure. MDFs maintained high IB retentions at all sites. For OSB(aspen), similar to the pattern for MOR retentions, decreasing IB retention exhibited two patterns: (1) linearly decreasing sites in Northern Japan, and (2) exponentially decreasing sites in Southern Japan. For OSB(pine), the decrease in retention was high. The retentions of the panels located in Southern Japan were less than 50% after 4-year exposure. For plywoods, because the variation in retention was large, no trend could be identifi ed.
Based on these results, there were large differences in deterioration among the eight panels because of the differ-ent elemdiffer-ents and resins used in each panel type. Moreover, regional differences were evident and were caused by weather conditions (precipitation, temperature). In particu-lar, the deterioration of panels located in areas that receive much rain in the summer, i.e., Shizuoka and Miyakonojo, was larger than that at the other sites.
Calculation of the deterioration rate
The deterioration of the panels varied among exposure sites (Figs. 3, 4); this was caused by the different weather condi-tions (precipitation, temperature). To quantify regional dif-ferences, the deterioration rate (A) was calculated as follows:
y= − ×A log( ) Bt +
where y is the strength retention, t is the number of months of outdoor exposure, and B is the intercept. Using this equation, the coeffi cient A was determined by linear regression analysis, and the results are shown in Fig. 5 (MOR retention) and Fig. 6 (IB retention). Also shown in the fi gures are the average deterioration rates for the eight sites. For all panels, the deterioration rates for Shizuoka, Okayama (South), Okayama (North), and Miyakonojo were high, and the rates for Asahikawa and Noshiro were
0 20 40 60 80 100
M
O
R
r
et
ent
io
n
(%
)
1 2 3 4 5 1 2 3 4 5 1 2 3 4 5 1 2 3 4 5 1 2 3 4 5 1 2 3 4 5 1 2 3 4 5 1 2 3 4 5
PB(PF) PB(MDI) MDF(MUF) MDF(MDI) OSB(aspen) OSB(pine) PW(12) PW(9)
Exposure period (year)
Asahikawa Morioka Noshiro Tsukuba Shizuoka Okayama(S) Okayama(N) Miyakonojo
0 20 40 60 80 100
IB retention (%)
1 2 3 4 5 1 2 3 4 5 1 2 3 4 5 1 2 3 4 5 1 2 3 4 5 1 2 3 4 5 1 2 3 4 5 1 2 3 4 5
PB(PF) PB(MDI) MDF(MUF) MDF(MDI) OSB(aspen) OSB(pine) PW(12) PW(9)
Exposure period (year)
Asahikawa Morioka Noshiro Tsukuba Shizuoka Okayama(S) Okayama(N) Miyakonojo
Fig. 3. Modulus of rupture (MOR) retentions for 5-year outdoor exposure tests at eight sites. PB, particleboard; PF, phenol-formaldehyde; MDI, methyl diphenyl diisocyanate; MDF, medium-density fi berboard; MUF, melamine-urea-formaldehyde; OSB, oriented strandboard; PW, plywood
low (Fig. 5). Additionally, the average deterioration rates were in the order OSB > PB > PW > MDF, and the deterioration rates were different for the eight sites. In particular, the rates for panels located in Southern Japan were higher than those located in Northern Japan. The IB retentions (Fig. 6) showed the same tendency as the MOR retentions. Except for PB(PF) and OSB(aspen), the deterio-ration rates for IB retention were lower than those for MOR retention. This means that the surface of each panel began to deteriorate, but the deterioration did not penetrate the interior of the panels. On the other hand, for PB(PF) and OSB(aspen), the deterioration penetrated into the panels on 5-year exposure; thus, there was no difference between the deterioration of MOR retention and IB retention.
0 10 20 30 40 50 60
PW(9) PW(12) OSB(pine) OSB(aspen) MDF(MDI) MDF(MUF) PB(MDI) PB(PF)
deterioration rate (A)
Asahikawa
Morioka
Noshiro
Tsukuba
Shizuoka
Okayama(S)
Okayama(N)
Miyakonojo Ave.
37.6 Ave.
20.7 Ave. 16.2 Ave. 12.5
Ave. 40.9 Ave.
29.8 Ave.
19.8 Ave. 15.5
MOR retention
Fig. 5. The deterioration rate ofMOR retention. The data shown in Fig. 3 were fi tted to the equation y =−A × log(t) + B and coeffi cient A was determined by linear regression analysis. Ave, average value for eight sites
0 10 20 30 40 50 60
PW(9) PW(12) OSB(pine) OSB(aspen) MDF(MDI) MDF(MUF) PB(MDI) PB(PF)
deterioration rate (A)
Asahikawa
Morioka
Noshiro
Tsukuba
Shizuoka
Okayama(S)
Okayama(N)
Miyakonojo Ave.
41.3 Ave.
20.6 Ave.
1.4 Ave.
2.5 Ave.42.8
Ave. 24.9 Ave.
9.9 Ave.
2.6
IB retention
Fig. 6. The deterioration rate ofIB retention. The data shown in Fig. 4 were fi tted to the equation y =−A × log(t) + B and coeffi cient A was determined by linear regression analysis. Ave, average value for eight sites
Analysis of the weathering intensity
Table 3. Parameter combinations showing the highest correlations for the eight panels
MOR retention IB retention
Pmax(mm) Tmin(°C) R Pmax(mm) Tmin(°C) R
PB(PF) 20.0 17.5 0.858 No limit 17.5 0.930
PB(MDI) 20.0 15.0 0.761 20.0 15.0 0.743
MDF(MUF) 20.0 15.0 0.677 20.0 20.0 0.171
MDF(MDI) 20.0 15.0 0.424 20.0 20.0 0.064
OSB(aspen) No limit 17.5 0.808 No limit 17.5 0.822 OSB(pine) 20.0 15.0 0.812 No limit 17.5 0.762
PW(12) 20.0 15.0 0.346 20.0 17.5 0.301
PW(9) 20.0 17.5 0.307 40.0 25.0 0.327
Pmax, maximum precipitation; Tmin, minimum temperature; R, coeffi cient of correlation
similar at all sites. Thus, by calculating the weathering inten-sity, an estimation of deterioration over the entire globe will be possible. In this report, daily precipitation and daily average temperatures were used to calculate the weathering intensity, as described below.
Daily precipitation (P) and daily average temperature (T) data at each exposure site for 5 years were taken from the website of the Meteorological Agency in Japan.19 P mul-tiplied by T was defi ned as the daily weathering intensity. The weathering intensity of each site (α) was calculated by summing the daily weathering intensity for 1-, 2-, 3-, 4-, and 5-year exposures. When the weathering intensity was calcu-lated, we established two hypotheses:
(1) Even during periods of hard rain, not all rain was absorbed by the panels or contributed to deterioration. Thus, a maximum value of panel absorption of daily precipitation was set, and is referred to as Pmax. That is,
the daily precipitation of P > Pmax was defi ned as P = Pmax,
and the daily precipitation of P < Pmax was defi ned as
P = P. Pmax was set at six levels: 20, 40, 60, 80, and
100 mm, and no limit.
(2) Higher temperatures caused the panels to absorb water more quickly and also accelerated the drying rate. Thus, higher temperatures increased the deterioration due to panel water absorption. Precipitation below a certain temperature did not contribute to the weathering inten-sity. Thus, a minimum temperature was set, and is referred to as Tmin, i.e., the daily precipitation at T < Tmin was
defi ned as P = 0 mm, and the daily precipitation at T > Tmin was defi ned as P = P. Tmin was set at fi ve levels: 15.0,
17.5, 20.0, 22.5, and 25.0°C.
Based on the two hypotheses, the weathering intensity (α) was calculated as:
α =
∑
(P T× )where P and T are the restricted daily precipitation (mm) and the restricted daily average temperature (°C), respec-tively. Using this equation, the weathering intensity (α) was calculated for 30 levels that combined Pmax (6 levels) and
Tmin (5 levels). Then, the logarithm of the weathering
inten-sity (logα) and strength retentions of eight sites were sub-jected to linear regression analysis. The values of the parameters (Pmax and Tmin) with the highest coeffi cients of
correlation are discussed.
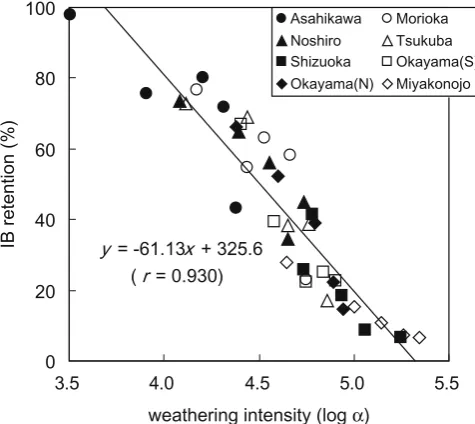
Table 3 shows the parameter combinations with the highest coeffi cients of correlation for the eight panel types for MOR retention and IB retention. For PB(PF), the coef-fi cients of correlation (R) were the highest among all panels for both MOR and IB retentions. Figures 7 and 8 show the relationship between strength retention and the logarithm of the weathering intensity (logα) for PB(PF). The values of Tmin were the same for MOR and IB retentions (Table
3), but the value of Pmax for IB retention was no limit, which
was higher than that for MOR retention (20.0 mm). This means that IB is an indicator of the condition of the interior of the panels, and the deterioration of the interior of the panels requires a large amount of precipitation at one time. On the other hand, because the bending properties relate to the deterioration of the surface of the panels, less pre-cipitation was required to progress surface deterioration. For both kinds of OSB, the deterioration was quite exten-sive at all sites after 5-year exposure. In particular, the dete-rioration of OSB(aspen) was the greatest (Figs. 3, 4) and the correlations for MOR and IB retentions were very high. For PB(PF) and OSB(aspen), the deteriorations were greater than those of the other panels, and the values of the coef-fi cient of correlation between strength retentions and the logarithm of the weathering intensity were high. On the other hand, MDFs and PWs (for which deterioration had not progressed greatly after 5-year exposure) did not show decreased strength retention. Because the correlations between logα and strength retentions were low for MDFs and PWs, it is diffi cult to discuss the signifi cance of these parameters for the weathering intensity. For panels that deteriorated to some degree during the exposure periods, the correlations between the strength retentions and the logarithm of the weathering intensity were high, and the signifi cance of the parameters can be discussed. However, for the panels that did not deteriorate greatly during the exposure periods, the correlations were lower, and the sig-nifi cance of the parameters cannot be discussed.
Conclusions
clearly evident. In particular, the deterioration of panels located in areas that receive much rain in the summer was larger than that at the other sites. Next, we discussed the deterioration rate during outdoor exposure. The deteriora-tion rates of the panels differed among the eight sites. In particular, the deterioration rates for panels located in southern Japan were higher than those located in northern
y = -44.42x + 242.2
0 20 40 60 80 100
3.5 4.0 4.5 5.0 5.5
weathering intensity (log α)
MOR retention (%)
( r = 0.858)
Asahikawa Morioka Noshiro Tsukuba Shizuoka Okayama(S) Okayama(N) Miyakonojo
Fig. 7. Relationship between the MOR retentions and the weathering intensity (logα) for PB(PF). Conditions: Pmax, 20 mm; Tmin, 17.5°C
y = -61.13x + 325.6
0 20 40 60 80 100
3.5 4.0 4.5 5.0 5.5
weathering intensity (log α)
IB retention (%)
(r = 0.930)
Asahikawa Morioka
Noshiro Tsukuba Shizuoka Okayama(S)
Okayama(N) Miyakonojo
Fig. 8. Relationship between the IB retentions and the weathering intensity (logα) for PB(PF). Conditions: Pmax, no limit; Tmin, 17.5°C
Japan. Finally, we calculated the weathering intensity using temperature and precipitation levels to eliminate regional differences. The correlations between the strength reten-tions and the logarithm of the weathering intensity were high for panels that deteriorated to some degree during exposure.
Acknowledgments Outdoor exposure tests were conducted at eight sites in Japan as part of a project organized by the Research Working Group on Wood-based Panels of the Japan Research Society. The authors thank all participants in this project.
References
1. Kojima Y, Norita H, Suzuki S (2009) Evaluating the durability of wood-based panels using thickness swelling results from acceler-ated aging treatments. For Prod J 59:35–41
2. Kojima Y, Suzuki S (2011) Evaluating the durability of wood-based panels using internal bond strength results from accelerated aging treatments. J Wood Sci doi: 10.1007/s10086-010-1131-4
3. Kojima Y, Suzuki S (2011) Evaluation of wood-based panel dura-bility using bending properties after accelerated aging treatments. J Wood Sci doi: 10.1007/s10086-010-1146-x
4. Hann RA, Black JM, Blomquist RF (1962) How durable is particle-board? For Prod J 12:577–584
5. Northcott Pl, Colbeck HGM (1966) Prediction of plywood bond durability. For Prod J 18:403–408
6. Gressel P (1980) Testing and judging the durability of particleboard adhesives: a proposal for the establishment of generally valid testing guidelines (in German). Holz Roh Werkst 38:17–35 7. River BH (1994) Outdoor aging of wood-based panels and
correla-tion with laboratory aging. For Prod J 46:68–74
8. Okkonen EA, River BH (1996) Outdoor aging of wood-based panels and correlation with laboratory aging. Part 2. For Prod J 44:55–65
9. Inoue A (1992) A new method for predicting bond durability I (in Japanese). Mokuzai Gakkaishi 38:923–930
10. Ishihara S (1994) Durability of fi re-retardant lauan plywood after 1-, 2-, 3-, 7- and 15-year outdoor exposures (in Japanese). J Soc Mater Sci Jpn 43:297–303
11. Hayashi T, Miyatake A, Harada M (2002) Outdoor exposure tests of structural laminated veneer lumber. J Wood Sci 48:69–74 12. Sekino N, Suzuki S (2003) Durability of wood-based panels
sub-jected to 10-year outdoor exposure in Japan. Bull Iwate Univ For 34:23–36
13. Ikeda M, Eumi Y, Kimura H, Takase H (1992) Durability of MDF against outdoor exposure (in Japanese). Mokuzai Kogyo 47(12):598–602
14. Suzuki S, Ikeda M, Inoue H, Shibusawa T, Kawai S (1999) Durabil-ity performance of laboratory-made OSB and some wood-based panels subjected to outdoor exposure (in Japanese). Wood Preserv 25(6):263–270
15. Ikeda M, Suzuki S (1999) Evaluation of the durability performance of wood-based panels subjected to outdoor exposure (in Japanese). Bull Shizuoka Univ For 23:25–36
16. Hayashi T, Miyatake A, Kawai S (2000) Effects of outdoor expo-sure on the strength distribution of oriented strand board (OSB) and particleboard (in Japanese). J Soc Mater Sci Jpn 49:384–389 17. Suzuki S, Watai J (2000) Literature review for durability
perfor-mance of wood and wood-based material (in Japanese). Bull Shi-zuoka Univ For 24:63–70.
18. Japanese Industrial Standards (1994) JIS standard specifi cation for particleboard, JIS A-5908. Japanese Standards Association, Tokyo 19. Japan Meteorological Agency website http://www.jma.go.jp/jma/