O R I G I N A L A R T I C L E
Rapid identification of CCA-treated wood using laser-induced
breakdown spectroscopy
Yurie Aono•Keisuke Ando •Nobuaki Hattori
Received: 10 November 2011 / Accepted: 22 February 2012 / Published online: 3 April 2012
ÓThe Japan Wood Research Society 2012
Abstract As chromated copper arsenate (CCA) contains copper, chromium and arsenic, waste CCA-treated wood must be separated from other treated wood because of environmental pollution by chromium and arsenic when it is incinerated and the regulation. Therefore, a method to identify CCA-treated wood was developed using laser-induced breakdown spectroscopy (LIBS). Using the LIBS apparatus assembled in our laboratory, plasma on a wood surface was generated by a 4 ns pulse of 1064 nm (55 mJ/ mm2) emitted from Nd:YAG laser. Fluorescence from the plasma was collected by an ellipsoidal mirror and analyzed by a spectrometer in the range of 190–300 nm. The results showed that the 228.7 nm line from As and 267.6 nm line from Cr were useful for the identification of CCA-treated wood. As the discrimination capacity was confirmed by the elemental composition analysis by X-ray fluorescence, it was concluded that LIBS can specifically identify CCA-treated wood.
Keywords CCACCA-treated woodLaser-induced breakdown spectroscopyIdentification
Introduction
Lumber and wood materials used for houses and exterior purposes have been impregnated with chemicals to reduce decay and avoid damage from termites. Chromated copper arsenate (CCA), which contains chromium, copper and arsenic compounds, was one of the standard preservatives.
CCA-treated was introduced in Japan in 1963 and no longer in use from 1997 by the voluntary action of the wood preservative industry [1]. The reasons were emis-sions of Cr compounds to factory effluent and incinerated ash [2], and As compounds to flue gas [3], though CCA treatment has been effective for the preservation of wood. As the estimated volume of CCA-treated wood waste at demolition sites will reach its peak at 130,000 m3in 2015 and then gradually decreases to almost zero for the next hundred years, a guideline for the disposal of CCA-treated wood was established under the act for the recycling of building materials. However, a method that can rapidly and accurately identify CCA-treated wood at demolition sites has not yet been developed until today.
Several studies about sorting waste CCA-treated wood have been already reported. In those studies, laser-induced breakdown spectroscopy (LIBS) or X-ray fluorescence analysis (XRF) were often used for detection of CCA-treated wood. One is the LIBS which uses a laser to create plasma from atoms in material and can analyze the existence of the atoms in the plasma. The other one is the XRF which observes X-ray fluorescence from materials excited by X-ray. Uhl et al. [4] had analyzed treated wood by LIBS and demonstrated that this technology had a capability to detect heavy metals in wood. Moskal and Hahn [5] also evaluated their online detector system using LIBS for CCA-treated wood detection. However, they observed fluorescence only from Cr and not from As at all. Although Takahashi et al. [6] developed a distinction process of CCA-treated wood, but the detection limit of As was insufficient. Solo-Gabriele et al. [7] compared XRF and LIBS systems, and revealed that both methods had a potential to separate CCA-treated wood from others, though XRF could detect CCA-treated wood better. Judging from the usability at demolition site, LIBS will be most suitable method for this purpose because of Y. AonoK. AndoN. Hattori (&)
Tokyo University of Agriculture and Technology, 3-5-8, Saiwaicho, Fuchu, Tokyo, Japan
transportable possibility, rapid analysis without any pre-treatment and simple operation. However, reliable and practicable identification method by LIBS hasn’t estab-lished yet. Therefore, we applied LIBS to identify CCA-treated wood from other types of CCA-treated wood, such as AAC, BAAC, ACQ, CUAZ, and creosote using a low fluence LIBS system, and herein, we present our results. Spectrum fluctuation, the sampling method, and the accu-racy of identification are also discussed.
Experimental
LIBS equipment
A schematic view of the LIBS analyzer used in this study is illustrated in Fig.1. This setup used an Nd:YAG laser (New Wave Research, Tempest 10) emitting a pulse with a wavelength of 1,064 nm and a pulse duration of 4 ns. The pulse from the laser was focused on the surface of the lumber by a plane convex lens whose focal length was 150 mm to generate a plasma of excited atoms in the layer. The focused spot diameter and fluence were 0.7 mm and 55 mJ/mm2, respectively. The fluorescence from the plasma was collected by an ellipsoidal mirror and led into an optical fiber connected to a tiny spectrometer (Stellar-Net, EPP2000HR) whose resolution and analysis range were 0.15 nm and 190–300 nm, respectively. The spec-trum can be acquired from the spectrometer within 30 ms after laser irradiation.
Samples
CCA, AAC, BAAC, ACQ CUAZ, creosote, unknown, and non-treated wood samples from unused sources and waste products were measured in this study. Waste wood samples were collected from demolished houses. All samples were kept in the same room and air-dried before analysis. The analyzed samples are shown in Table1.
Data acquisition
The LIBS spectrum is usually affected by background light, pulse energy, the distance between the lens and sample, as well as the heterogeneity of the sample. To minimize these effects, baseline correction and normali-zation of the spectra were achieved as follows: as carbon fluorescence at a wavelength of 247.8 nm was always observed when the wood was analyzed, this signal was
Sample Lens
Optical fiber Ellipsoidal
mirror
Laser
Spectrometer Synchronous
circuit
Fig. 1 Schematic of the LIBS analyzer for identifying CCA-treated
wood
Table 1 Summary of the wood samples and their characteristics
Preservative Code Used age (years)
Usage Sample symbol
Chromium, copper, arsenic
CCA – Unused C1
– Unused C2
– Unused C3
[10 Exterior wood C4 Unknown Exterior wood C5
30 Sleeper C6
30 Sleeper C7
13.5 Sill C8
30 Sill C9
30 Sill C10
30 Sill C11
27 Exterior wood C12
30 Plinth C13
16 Sill C14
30 Addition part C15
Ammonium AAC 4.5 Sill A1
4.5 Sill A2
4.5 Sill A3
4 Floor joist A4
Boron, ammonium BAAC 5 Sill B1
5 Sill B2
Copper, ammonium ACQ – Unused Q1
– Unused Q2
4 Floor joist Q3 Copper, azole CUAZ Unknown Unknown Z1 Unknown Unknown Z2
Creosote – 40 Plinth O1
Non-treated – – Unused P1
– Unused P2
Unknown – 53 Sill X1
53 Sill X2
53 Sill X3
53 Sill X4
Unknown Sill X5
40 Sill X6
40 Sill X7
chosen as the standard and its intensity was set at 1000. Such an adjustment was thought to be required for every measurement for an accurate analysis. Clear fluorescence was observed for Cr at 267.6, 276.5, 283.5, 284.2, 284.9, and 286.5 nm and for As at 228.7 and 235.0 nm. Fluo-rescence of Cr at 267.6 nm and that of As at 228.7 nm
were chosen for the identification of these species because the wavelengths provided the most distinct peaks in the range of 190–300 nm. The identification of all atoms was achieved by comparing the observed wavelengths to those reported in the literature [8,9].
Taking into consideration the surface pollution and the variation of fluorescence intensities, the averages of the peak intensities from the third irradiation of three different locations were determined for identification purposes.
Results and discussion
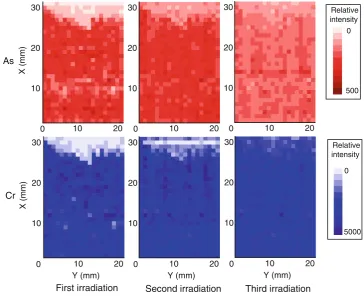
To determine a more optimal sampling method for the identification of CCA-treated wood, the distribution of Cr and As fluorescence intensities by LIBS were investigated in an area of 20930 mm with a resolution of 1 mm. A surface image and the analyzed result for sample C5 are illustrated in Figs.2, 3, respectively. As seen in Fig.2, stains were observed on a part of the sample surface. These stains affected the results of LIBS, although they did not spread into the sample. According to the distribution map of the fluorescence intensity for As at 228.7 nm and for Cr at 267.6 nm in Fig.3, the effect of the stains on the first and second laser irradiation was clearly observed; however, no effect was observed in the intensity map resulting from the third laser irradiation. Therefore, the fluorescence intensity of the third irradiation was used for LIBS analysis.
Relative intensity Relative intensity
0
X (mm)
30
20 10
10 20
0 10 20
30
10 20
0 10 20
20
10 30
0
Y (mm)
10 20
20
10
X (mm)
30
0
Y (mm)
10 20
20
10 30
0 10 20
Y (mm) 30
20
10
0
500
0
5000
As
Cr
First irradiation Second irradiation Third irradiation
Fig. 3 Distribution of As and
Cr fluorescence intensity
Stained area
Analyzed area
10 mm
The average values of fluorescence intensity of As and Cr from the single-shot irradiation of several CCA samples are shown in Fig.4, in which the error bars show±3r. The strongest fluorescence intensity was observed at the first or second irradiation, except in the stain area. As the standard deviation was considerably large, the error bars for CCA-treated and non-CCA-treated wood overlapped each other. Therefore, it was necessary to take an average of multiple measurements from different locations for an accurate identification. Figure5 shows the averaged intensities of the results from three different locations for the same samples reported in Fig.4. As the standard deviation clearly decreased compared with that in Fig.4, the aver-ages of the peak intensities from the third irradiation acquired from three different locations were consequently used for identification.
To test the effectiveness of the method for the identifi-cation of As and Cr, one spectrum from the third laser irradiation at three different locations for each sample was
collected. Spectra from all 37 samples of As near 228.7 nm and of Cr near 267.6 nm are shown in Fig. 6.
Strong fluorescence of As at 228.7 and Cr 267.6 nm was observed only in the spectra of CCA-treated samples. The relative fluorescence intensity of As at 228.7 nm varied from 61 to 193 for CCA-treated wood and from 4 to 16 for non-CCA-treated wood. In addition, the relative intensity of Cr at 267.6 nm varied from 348 to 2400 and from 1 to 19 for CCA-treated and non-CCA-treated wood, respec-tively.
Although the Cr peak in the CCA-treated sample spectra was strong enough to identify samples containing Cr from others, the As peak was not as strong. Therefore, com-parisons using a threshold level were required for better identification. Among the non-CCA-treated wood, the strongest fluorescence was shown by samples O1 and Z2 at 228.7 and 267.6 nm, respectively. Therefore, in this test, 3rof relative fluorescence intensity from each sample was used for As at 228.7 nm and Cr at 267.6 nm threshold. For
600 6000
(b) (a)
400 4000 P1
C5 C7
200 2000
C7 C9 C14
0
Relative fluorescence intensity (a.u.)
0
1 2 3
Irradiation number
1 2 3
Irradiation number
Fig. 4 Averages of As and Cr
single-shot fluorescence intensities foraAs at 228.7 nm andbCr at 267.6 nm.Error barsrepresent±3r
600 (a) 6000 (b)
400 4000 P1
C5
200 2000
C7 C9 C14
0 0
1 2 3
Irradiation number
1 2 3
Irradiation number
Relative fluorescence intensity (a.u.)
Fig. 5 Averages of As and Cr
the discrimination of As and Cr containing samples, the threshold value was set to 27 and 21, respectively. As shown in Fig.7, CCA-treated wood could be clearly identified from other treated wood samples. The result from LIBS identification corresponded with that from X-ray fluorescence analysis. To obtain more reliable results, it is necessary to analyze samples under various conditions such as wet wood, painted wood, and so on.
Although our apparatus demonstrated an ability to accurately identify CCA-treated wood, the use of a lower fluence or smaller spot diameter on the sample surface needs consideration to develop a more economical and compact LIBS apparatus and such a laser typically has a lower pulse energy and smaller beam diameter compared with that of our laser. As plasma fluorescence intensity is related to ablated sample volume, these factors are thought to affect spectral intensity [10].
Conclusion
Laser-induced breakdown spectroscopy analysis was used to rapidly identify CCA-treated wood among wood samples having various treatments and to develop an rapid identifi-cation method using an Nd:YAG laser with the fluence of 55 mJ/mm2. The strongest fluorescence intensities of As and
Cr in the range of 190–300 nm appeared at 228.7 and 267.6 nm, respectively. The fluorescence intensity distri-bution of these peaks and the observed variation suggested that it was necessary to average multiple measurements from different areas to ensure an accurate identification. Conse-quently, it was determined that the average of the fluores-cence intensities from three different areas was sufficient. As peaks from As and Cr were observed only in the spectra from treated samples, LIBS could accurately identify CCA-treated wood from other CCA-treated wood samples, such as AAC, BAAC, ACQ, CUAZ, and creosote, when a threshold cal-culated from the fluorescence intensity of non-treated wood was used. Therefore, the potential of LIBS for the rapid identification of CCA-treated wood has been demonstrated.
Acknowledgments This work was supported by a Grant-in-Aid for
challenging Exploratory Research (23658141).
References
1. Iwasaki K (2008) An overview of the phase out of CCA-treated wood for residential outdoor use in the United States. Wood Preserv 34(1):2–12 (in Japanese)
2. Japan Wood Preservative Association (1985) The report of pro-motion project of safety disposal of waste CCA-treated wood— the committee of safety CCA-treated wood disposal—Japan wood preservative association (2003) (in Japanese)
3. McMahon CK, Bush PB, Woolson EA (1986) How much arsenic is released when CCA treated wood is burned? For Prod J 36: 45–50
4. Uhl A, Loebe K, Kreuchwig L (2001) Fast analysis of wood preservers using laser induced breakdown spectroscopy. Spec-trochim Acta Part B 56:795–806
5. Moskal T, Hahn D (2002) On-line sorting of wood treated with chromated copper arsenate using laser-induced breakdown spectroscopy. Appl Spectrosc 56(10):1337–1344
6. Takahashi T, Tomita K, Wakasugi M (2009) Development of distinction process of CCA treated wood from house demolition using laser induced breakdown spectroscopy method. The Report of Hokkaido Industrial Research Institute, vol 308, pp 33–39 (in Japanese)
250 3500
2676nm
150 200
2500 3000
CCA AAC BAAC ACQ 267 6 nm
100
(a.u.)
1000 1500
2000 ACQ
CUAZ Creosote Non-treated Unknown
0 50
Relative fluorescence intensity 0 500
226 227 228 229 230 231
Wavelength (nm)
266 267 268 269 270 271
Wavelength (nm)
As
228.7 nm Cr .
Fig. 6 LIBS spectra from all 37
samples
10000
1000
CCA AAC BAAC Creosote
10 100
intensity (a.u.)
Non-treated ACQ
1
1 10 100 1000
267.6 nm relative fluorescence
CUAZ Unknown
Threshold
228.7 nm relative fluorescence intensity (a.u.)
7. Solo-Gabriele H, Townsend T, Hahn D, Moskal T, Hosein N, Jambeck J, Jacobi G (2004) Evaluation of XRF and LIBS tech-nologies for on-line sorting of CCA-treated wood waste. Waste Manage (Oxf) 24:413–424
8. National Institute of Standards and Technology (2011) NIST atomic spectra database. http://www.physics.nist.gov/PhysRef Data/ASD/lines_form.html. Accessed 20 September 2011
9. Payling R, Larkins P (2000) Optical emission lines of the ele-ments. Wiley, Chichester