https://doi.org/10.5194/jsss-6-381-2017
© Author(s) 2017. This work is distributed under the Creative Commons Attribution 4.0 License.
Electron capture detector based on a
non-radioactive electron source: operating
parameters vs. analytical performance
Erik Bunert, Ansgar T. Kirk, Jens Oermann, and Stefan Zimmermann
Institute of Electrical Engineering and Measurement Technology, Department of Sensors and Measurement Technology, Leibniz Universität Hannover, 30167 Hannover, Germany
Correspondence:Erik Bunert ([email protected])
Received: 29 September 2017 – Revised: 9 November 2017 – Accepted: 10 November 2017 – Published: 14 December 2017
Abstract. Gas chromatographs with electron capture detectors are widely used for the analysis of electron affine substances such as pesticides or chlorofluorocarbons. With detection limits in the low pptvrange, electron cap-ture detectors are the most sensitive detectors available for such compounds. Based on their operating principle, they require free electrons at atmospheric pressure, which are usually generated by aβ−decay. However, the use of radioactive materials leads to regulatory restrictions regarding purchase, operation, and disposal. Here, we present a novel electron capture detector based on a non-radioactive electron source that shows similar detection limits compared to radioactive detectors but that is not subject to these limitations and offers further advan-tages such as adjustable electron densities and energies. In this work we show first experimental results using 1,1,2-trichloroethane and sevoflurane, and investigate the effect of several operating parameters on the analytical performance of this new non-radioactive electron capture detector (ECD).
1 Introduction
Since their advent more than 55 years ago (Lovelock and Lipsky, 1960), electron capture detectors (ECDs) have be-come the most important gas chromatography (GC) detectors for the detection of electron affine compounds. Apart from the introduction of pulsed operation (Maggs et al., 1971), their basic setup has remained unchanged. Although many attempts have been made to replace the radioactive source used (mainly radioactive Ni-63 foils) to generate thermalized electrons by ionizing the carrier gas (Wentworth et al., 1992), only the pulsed helium discharge has seen some degree of practical use.
However, in other fields, for example ion mobility spec-trometry, radioactive electron sources have been success-fully replaced by non-radioactive electron sources. In recent years, we developed a compact, hermetically sealed non-radioactive electron source (Cochems et al., 2015). It gen-erates free electrons through thermionic emission inside a vacuum cavity at 10−5mbar or below. These electrons are then accelerated and can partially transmit through a 300 nm
thin silicon nitride membrane to atmospheric pressure (in this case 1013 mbar). By varying the acceleration voltage and fil-ament heating current, the electron energy and density can be controlled. In first fundamental investigations our non-radioactive electron source was simply attached to a small reaction chamber with a Faraday plate detector (Bunert et al., 2017b, c). Using this non-radioactive electron source for ECDs avoids all the disadvantages related to radioac-tive ECDs, while allowing comparable limits of detection (LoDs).
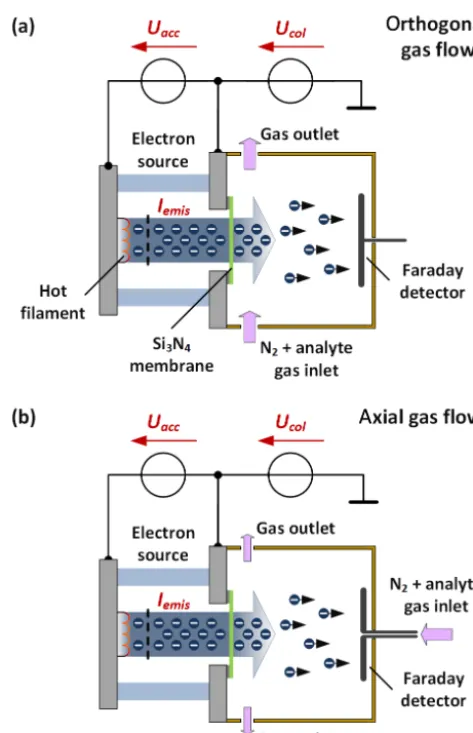
lin-Figure 1.Schematic of our electron capture detector with our non-radioactive electron source with orthogonal (a)and axial(b) gas flow.
ear range of the sensor response compared to the typical non-linear signal amplitude of ECDs in DC (direct current) mode (Maggs et al., 1971).
2 Experiments
For the first experimental investigations, our non-radioactive electron source is attached to a small reaction chamber man-ufactured from polyether ether ketone (PEEK). The electron source consists of a hot filament and a control grid, and is sealed with a 300 nm thin silicon nitride (Si3N4) membrane. The membrane is 1.5 mm×1.5 mm and is transparent for electrons with sufficient electron energy from 8 to 12 keV (Bunert et al., 2017a). On the opposite side of the reaction chamber, a Faraday plate detector is placed. Here, two dif-ferent configurations of the reaction chamber are used. In the first setup with orthogonal gas flow the sample gas (carrier gas with constant analyte concentration) passes between the electron source and the Faraday detector as shown in Fig. 1a.
In the second setup with axial gas flow the sample gas flows from the Faraday detector towards the electron source as shown in Fig. 1b. In all experiments filtered nitrogen with a dew point of−91◦C was used as carrier gas.
To adjust the kinetic electron energy, the acceleration volt-ageUaccbetween the hot filament and the acceleration elec-trode of the electron source can be varied between 8 and 12 kV, which generates high kinetic electrons with ener-gies between 4.5 and 9.6 keV after transmission through the membrane (Bunert et al., 2017a). Adjusting the filament cur-rent in the range of 150 to 180 mA results in electron emis-sion currents of Iemis=10 nA to Iemis=40 nA. These pri-mary electrons with a penetration depth of about 0.5 mm at Uacc=8 kV to 2.2 mm atUacc=12 kV in nitrogen ionize the nitrogen molecules in the reaction region by electron impact ionization and generate secondary electrons. By applying a constant collector voltage (DC mode) ofUcol=3 V between the acceleration electrode of the electron source and the Fara-day detector, the generated electrons can be collected at the Faraday detector, which constitutes a constant detector cur-rent. The collector voltage of 3 V is comparable to the de-scribed values in the literature (Boyes, 2010; E13 Commit-tee, 2011) for radioactive ECDs, depending on the dimen-sions. The detector current is amplified by our modified tran-simpedance amplifier (Cochems et al., 2014) and measured by a Keysight 34461A multimeter.
The following gas flows are given in mlsmin−1(milliliter standard per minute, mass flow at reference conditions 20◦C and 1013 mbar). The sample gas flows with a constant flow rate of 30 mlsmin−1 through the reaction chamber, which is comparable to the values stated in the literature for GCs with radioactive ECDs operating in DC mode (Wagner et al., 1974). Now, the electron-capturing compounds in the carrier gas can react with the free, thermalized electrons, leading to a decreased detector current (Zlatkis and Poole, 1981).
To generate a constant analyte vapor concentration, the an-alyte is filled into a permeation vial heated to 35◦C in a well-controlled permeation oven. This permeation oven is con-stantly purged with a constant flow of 600 mlsmin−1of ni-trogen. An adjustable fraction of this gas is diluted with pure nitrogen to generate different analyte concentrations in nitro-gen giving the sample gas. Adjustable via a mass flow con-troller, a fraction of this diluted sample gas can be led through the ECD as the ECD sample gas flow. For the following char-acterization, we used 1,1,2-trichloroethane (CAS: 79-00-5) and sevoflurane (CAS: 28523-86-6) as analytes, purchased from Sigma Aldrich.
3 Results and discussion
3.1 Gas flow configuration and electron source parameters
ampli-tude using a constant analyte concentration of 50 ppbv 1,1,2-trichloroethane was investigated. Therefore, the decrease in the detector current, which is caused by 1,1,2-trichloroethane capturing free electrons and thus corresponds to the signal amplitude, was recorded. Here, increasing the electron emis-sion current from 10 to 40 nA leads to an increase in signal amplitude by a factor of 3. Unfortunately, higher emission currents cannot be investigated with our current setup, be-cause of the limitations of the used electron source. Further-more, a higher emission current leads to an increased off-set of the detector current, which requires an increased dy-namic range of the used amplifier. Thus, the highest signal amplitude for both setups (axial and orthogonal flow setup) is reached with an emission current of 40 nA.
Using this emission current of 40 nA, the influence of the electron acceleration voltage and thus the kinetic energy of the emitted electrons on the signal amplitude was inves-tigated. An increased acceleration voltage leads to an in-creased penetration depth of the emitted high kinetic elec-trons (Bunert et al., 2017a) and hence to a larger reaction re-gion, which should improve the achievable signal amplitude. However, with lower kinetic energies, the electrons are ther-malized in less time. This is an important factor for the reac-tion with electron-capturing analytes and should also lead to an increased signal amplitude. The results for an acceleration voltage sweep betweenUacc=8 kV andUacc=12 kV show that the signal amplitude increases with increasing electron acceleration energies. Thus, an increasing penetration depth leading to a larger reaction region is preferable. Furthermore, electrons with higher kinetic energy can ionize more nitrogen molecules, which generates more secondary electrons. These results suggest that the maximum signal amplitude can be achieved by the highest acceleration voltage ofUacc=12 kV. However, not the signal amplitude but rather a high signal-to-noise ratio (SNR) is important for lowest LoDs. Therefore, the SNR is better suited for comparing the two flow setups and was measured for different electron emission currents and electron acceleration voltages. To determine the SNR for the parameter sweeps of the electron emission current from 10 to 40 nA and of the acceleration voltage fromUacc=8 kV toUacc=12 kV, the noise of the detector signal was deter-mined for an averaging time of 200 ms without analytes.
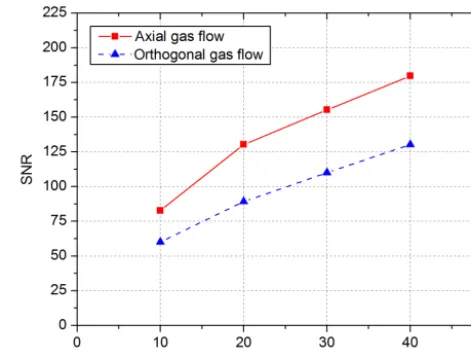
The effect of the emission current on the maximum achievable SNR for a 1,1,2-trichloroethane concentration of 50 ppbv and an acceleration voltage of Uacc=10 kV is shown in Fig. 2. As mentioned above, the signal amplitude increases with increasing emission current, while the noise just slightly increases. Thus, the best SNR is also reached at an emission current ofIemis=40 nA for both flow setups.
However, the SNR of the axial gas flow setup is signifi-cantly higher than the SNR of the orthogonal gas flow setup for all emission currents. For example, at an emission cur-rent of 40 nA, the SNR of the axial setup is 175 and the SNR of the orthogonal setup is 130. This can be explained by an incomplete removal of the generated analyte ions from the
Figure 2. SNR over the electron emission current from 10 to 40 nA with an applied collector voltage of 3 V and 50 ppbv 1,1,2-trichloroethane. The electron source acceleration voltage isUacc= 10 kV.
reaction region within the orthogonal gas stream, since the electrical force on the analyte ions is directed orthogonally to the gas flow and not in the opposite direction. Thus, some charged analyte ions cannot reach the gas outlet, but can drift towards the counter electrode of the detector at the ap-plied collector voltage. In axial configuration the convective force (gas flow velocity in the reaction region of 41 cm s−1at 30 mlsmin−1) exceeds the electrical force (drift velocity of 9 cm s−1atE=4 V cm−1), and analyte ions can leave the re-action region. This increases the statistical noise of the detec-tor current, while the signal amplitude almost remains con-stant. However, the axial gas flow transports the analyte ions in the opposite direction of the electrical field with a slightly higher force than the electrical force by the applied collector voltage. Thus, only the electrons and not the analyte ions are detected by the Faraday detector.
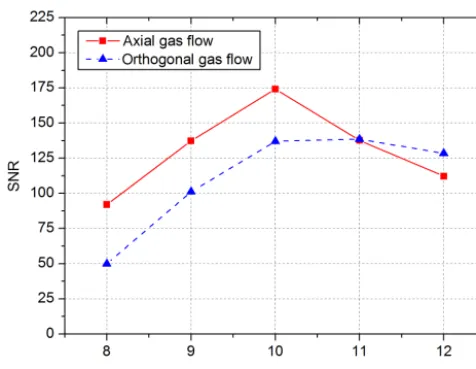
Based on this, an increased acceleration voltage and thus an increased penetration depth of the emitted electrons as well as an increased number of generated secondary elec-trons should increase the noise by the statistical behavior of the ionization process. Therefore, the SNR for acceleration voltages betweenUacc=8 kV andUacc=12 kV was deter-mined for both flow setups. Figure 3 shows the resulting SNR curves at a constant emission current ofIemis=40 nA.
be-Figure 3. SNR over the acceleration voltage from 8 to 12 kV with an applied collector voltage of 3 V and 50 ppbv 1,1,2-trichloroethane. The electron emission current is constantly con-trolled toIemis=40 nA.
Figure 4.Detector signals with pure nitrogen as carrier gas (solid red line) and nitrogen containing 220 ppbv 1,1,2-trichloroethane (dashed blue line) over collector voltage.
cause of the higher SNR and the more effective removal of analyte ions from the reaction region.
3.2 Influence of the collector voltage
Using the optimized electrical parameters mentioned above and the axial gas flow setup, we now investigate the effect of the collector voltageUcolon the signal amplitude. Therefore, the absolute detector current was measured for two repeti-tions of a collector voltage sweep between Ucol=1 V and
Ucol=190 V, the first with pure carrier gas and the second with sample gas containing a constant 1,1,2-trichloroethane
Figure 5.Signal amplitude of the detector response over collector voltage calculated by the difference between the detector signals with pure nitrogen as carrier gas and nitrogen containing 220 ppbv 1,1,2-trichloroethane.
concentration of 220 ppbv. This relatively high concentration is mainly used to generate higher detector signals to better analyze the effect of the collector voltage on the detector sig-nal. As explained above, the analytes capture free electrons, which causes a decrease in the detector current as shown in Fig. 4. Thus, the difference between the two curves related to the analyte concentration corresponds to the signal ampli-tude of this setup; see Fig. 5. The absolute detector currents for both curves saturate at the same value ofIdet,sat=24 nA for higher collector voltages, independent of the analyte con-centration, as all charged particles are captured at this point. In addition, the signal amplitude has a maximum value of 760 pA at a collector voltage ofUcol=90 V.
Again, not the signal amplitude but rather a high SNR is important for lowest LoDs. Therefore, the SNR is calculated by dividing the signal amplitude by the noise of the detector signal for an averaging time of 200 ms. The results in Fig. 6 show an increasing noise with an increasing collector volt-age. Since the signal amplitude also increases, the SNR re-mains above a value of 200 up toUcol=100 V. For higher collector voltages, however, the SNR significantly decreases. Furthermore, the SNR has two maxima of 280 atUcol=5 V andUcol=70 V. In the following measurements a collector voltage ofUcol=5 V is used due to the reduced instrumental effort of a low voltage power supply.
Figure 6.Standard deviationσof the measured noise (black dots) and the resulting signal-to-noise ratio (red triangles) over collector voltage.
molecules are detected, which reduces the signal amplitude. Furthermore, the typical non-linear response of electron cap-ture detectors in DC mode (Maggs et al., 1971; Wagner et al., 1974) with increasing concentrations is visible.
Based on the measured linear signal response at low con-centrations, we determined the limits of detection for 1,1,2-trichloroethane and for sevoflurane at different sample gas flow rates. Here, the LoD is defined as 3 times the stan-dard deviationσof the measured noise. The calculated LoDs are listed in Table 1 for an averaging time of 200 ms. At a sample gas flow rate of 30 mlsmin−1the LoDs of our non-radioactive ECD are 0.005 µg L−1 for 1,1,2-trichloroethane and 0.002 µg L−1for sevoflurane, which is comparable to ra-dioactive ECDs, e.g., 0.006 µg L−1for 1,1,2-trichloroethane (Barani et al., 2006).
In addition, we investigated the effect of the sample gas flow on the LoD. Typical flow rates used in gas chromatogra-phy range between 5 and 30 mlsmin−1(Wagner et al., 1974; Zitko et al., 1971; Kapila and Aue, 1975; Nasreddine et al., 2016). At a sample gas flow rate of 5 mlsmin−1, the LoDs are 0.007 µg L−1 for 1,1,2-trichloroethane and 0.004 µg L−1 for sevoflurane. These detection limits are slightly higher be-cause of the incomplete removal of analyte ions as mentioned above.
3.3 Implementation of the pulsed mode
The typical non-linear response of electron capture detectors in DC mode is clearly visible with increasing concentrations (Maggs et al., 1971; Zlatkis and Poole, 1981); see Fig. 7. Thus, we implemented the well-known pulsed collector volt-age mode in order to improve the linear range of the detector response (Maggs et al., 1971; E13 Committee, 2011; Gobby et al., 1980; Zlatkis and Poole, 1981). In pulsed mode, the electrons are mainly generated under field-free conditions in
Figure 7.Resulting signal amplitudes over the analyte concentra-tion for 1,1,2-trichloroethane(a)and sevoflurane(b)for sample gas flows of 5, 10 and 30 mlsmin−1.
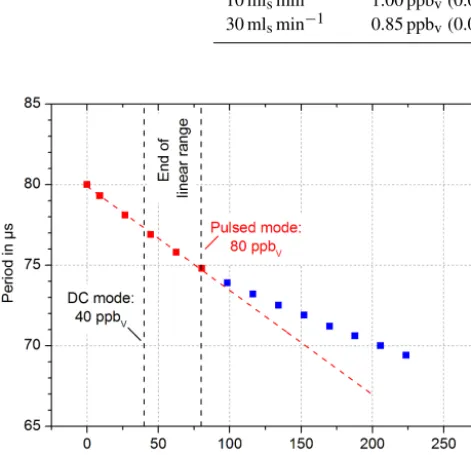
the reaction region, while the analyte molecules react with the electrons and the analyte ions are removed within the gas stream. A short voltage pulse generates a transient electrical field in the reaction region and the remaining electrons are pushed to the Faraday detector. The voltage pulse has to be so short (typically a few µs or less) that the charged analyte molecules with their lower mobility do not reach the detec-tor (E13 Committee, 2011). The amplitude of this voltage pulse is typically significantly higher than in DC mode, but is not exactly described in the literature. Therefore, we set the amplitude to 80 V. Now, the repetition rate is controlled to maintain a constant detector current, independent of the ana-lyte concentration. The required repetition rate is a measure of the analyte concentration. Initial measurements were per-formed with a pulse width of 5 µs, a constant detector current of 7.7 nA, and a constant emission current ofIemis=40 nA. The results for various 1,1,2-trichloroethane concentrations are shown in Fig. 8. The linear range in pulsed mode with this preliminary setup and parameter set is between the LoD of 0.85 and 80 ppbv. This linear range of 102is just an im-provement by a factor of 2 compared to the linear range of the DC mode. Further improvements, such as optimized control electronics for shorter pulse widths, are expected to signifi-cantly increase the achievable linear range up to 104, which is typically reached by commercially available ECDs with a radioactive electron source.
4 Conclusion
ax-Table 1.LoDs for 1,1,2-trichloroethane and sevoflurane for sample gas flows between 5 and 30 mlsmin−1for a measuring time of 200 ms andUcol=5 V.
Sample gas flow LoD for 1,1,2-trichloroethane LoD for sevoflurane
5 mlsmin−1 1.20 ppbv(0.007 µg L−1) 450 pptv(0.004 µg L−1) 10 mlsmin−1 1.00 ppbv(0.006 µg L−1) 340 pptv(0.003 µg L−1) 30 mlsmin−1 0.85 ppbv(0.005 µg L−1) 190 pptv(0.002 µg L−1)
Figure 8.Extended linear range (red) for 1,1,2-trichloroethane by using a pulsed collector voltage ofUcol=80 V and a pulse width of tw,col=5 µs. The pulse frequency is adjusted to keep the detector current constant independent of the analyte concentration, so that the pulse frequency and period correspond to the analyte concentra-tion.
ial setup is superior due to the higher signal-to-noise ratio (SNR). Furthermore, we investigated the effect of different operating parameters on the SNR and thus on the limits of de-tection (LoDs). The SNR increases with increasing electron emission current up to the highest possible emission current ofIemis=40 nA. This is mainly due to the increased number of generated secondary electrons. In addition, the optimum acceleration voltage was determined to beUacc=10 kV for the highest possible SNR. Even higher acceleration voltages lead to an increased noise because of the statistical behavior of the ionization process.
Using the parameters mentioned above together with the axial setup, further measurements were performed to opti-mize the collector voltage and to investigate the effect of the sample gas flow on the signal amplitude. While the noise increases with increasing collector voltage, the signal am-plitude has a maximum value, leading to two SNR max-ima. Due to the lower instrumental effort of a low voltage power supply, the lower collector voltage of Ucol=5 V is used to reach the maximum SNR. In order to investigate the effect of the sample gas flow on the signal amplitude, the
LoDs of 1,1,2-trichloroethane and sevoflurane were deter-mined for different sample gas flows. At a sample gas flow rate of 30 mlsmin−1the LoDs of our non-radioactive ECD are 0.005 µg L−1for 1,1,2-trichloroethane and 0.002 µg L−1 for sevoflurane, which is comparable to radioactive ECDs. At a sample gas flow rate of just 5 mlsmin−1, the LoDs are 0.007 µg L−1for 1,1,2-trichloroethane and 0.004 µg L−1 for sevoflurane. Thus, the non-radioactive ECD fits the flow rates typically used in standard gas chromatography. Because of the non-linear response at high analyte concentrations, a pulsed collector voltage mode known from the literature was implemented, leading to a linear range of 102.
Although our non-radioactive ECD already compares well with radioactive ECDs, future investigations and develop-ments are required to further improve the analytical per-formance. In particular, new control electronics and shorter pulse widths should significantly expand the linear range up to 104as required for GC applications.
Data availability. No data sets were used in this article.
Competing interests. The authors declare that they have no con-flict of interest.
Special issue statement. This article is part of the special issue “Sensor/IRS2 2017”. It is a result of the AMA Conferences, Nurem-berg, Germany, 30 May–1 June 2017.
Edited by: Ulrich Schmid
Reviewed by: two anonymous referees
References
Barani, F., Dell’Amico, N., Griffone, L., Santoro, M., and Tarabella, C.: Determination of Volatile Organic Compounds by Headspace Trap, J. Chromatogr. Sci., 44, 625–630, https://doi.org/10.1093/chromsci/44.10.625, 2006.
Boyes, W.: Instrumentation reference book, Butterworth-Heinemann/Elsevier, Boston, 1 online resource, 2010.
Bunert, E., Kirk, A. T., Oermann, J., and Zimmermann, S.: An Electron Capture Detector Based on a Non-Radioactive Electron Source, P3.3 – AMA Service GmbH, Von-Münchhausen-Str. 49, 31515 Wunstorf, Germany, in: Proceedings of the AMA Con-ferences 2017 with SENSOR and IRS2: SENSOR 2017, 18th International Conference on Sensors and Measurement Technol-ogy, edited by: AMA Service GmbH, SENSOR 2017, Nürnberg, 30 May–1 June 2017, AMA Service GmbH, Wunstorf, 627–631, 2017b.
Bunert, E., Kirk, A. T., Oermann, J., and Zimmermann, S.: Electron Capture Detector with Non-Radioactive Electron Source, in: Pro-ceedings, Eurosensors 2017, Paris, 3–6 September 2017, mdpi, 443, 2017c.
Cochems, P., Kirk, A. T., and Zimmermann, S.: In-circuit-measurement of parasitic elements in high gain high bandwidth low noise transimpedance amplifiers, Rev. Sci. Instrum., 85, 124703, https://doi.org/10.1063/1.4902854, 2014.
Cochems, P., Kirk, A. T., Bunert, E., Runge, M., Goncalves, P., and Zimmermann, S.: Fast pulsed operation of a small non-radioactive electron source with continuous emission current control, Rev. Sci. Instrum., 86, 65102, https://doi.org/10.1063/1.4921707, 2015.
E13 Committee: Practice for Use of Electron-Capture Detectors in Gas Chromatography, ASTM International, West Conshohocken, PA, https://doi.org/10.1520/E0697-96R11, 2011.
Gobby, P. L., Grimsrud, E. P., and Warden, S. W.: Improved model of the pulsed electron capture detector, Anal. Chem., 52, 473– 482, https://doi.org/10.1021/ac50053a023, 1980.
Kapila, S. and Aue, W. A.: Voltage effects in a d.c. electron capture detector, J. Chrom. A, 108, 13–21, https://doi.org/10.1016/S0021-9673(00)97484-3, 1975. Lovelock, J. E. and Lipsky, S. R.: Electron Affinity
Spec-troscopy – A New Method for the Identification of Func-tional Groups in Chemical Compounds Separated by Gas Chromatography 1, J. Am. Chem. Soc., 82, 431–433, https://doi.org/10.1021/ja01487a045, 1960.
Maggs, R. J., Joynes, P. L., Davies, A. J., and Lovelock, J. E.: Elec-tron capture detector. New mode of operation, Anal. Chem., 43, 1966–1971, https://doi.org/10.1021/ac60308a014, 1971. Nasreddine, R., Person, V., Serra, C. A., and Le Calvé, S.:
Devel-opment of a novel portable miniaturized GC for near real-time low level detection of BTEX, Sens. Actuators, B, 224, 159–169, https://doi.org/10.1016/j.snb.2015.09.077, 2016.
Wagner, P. D., Naumann, P. F., and Laravuso, R. B.: Simultaneous measurement of eight foreign gases in blood by gas chromatog-raphy, J. Appl. Physiol., 36, 600–605, 1974.
Wentworth, W. E., D’Sa, E. D., Cai, H., and Stearns, S.: Envi-ronmental Applications of the Pulsed-Discharge Electron-Capture Detector, J. Chromatogr. Sci., 30, 478–485, https://doi.org/10.1093/chromsci/30.12.478, 1992.
Zitko, V., Hutzinger, O., and Safe, S.: Retention times and electron-capture detector responses of some individual chlorobiphenyls, B. Environ. Contam. Tox., 6, 160–163, 1971.