T o s h i r o H a r a d a • T o s h i m i t s u H a t a • S h i g e h i s a I s h i h a r a
Thermal constants of wood during the heating process measured
with the laser flash method
Received: April 13, 1998 / Accepted: June 25, 1998
A b s t r a c t The thermal diffusivity, specific heat, and thermal conductivity of 13 species of wood were measured by means of the laser flash method to investigate the thermal proper- ties of wood during the heating process. The temperature ranged from room temperature to 270°C in air or under vacuum. The thermal diffusivity varied little during the heating process up to 240°C. The values in air were larger than those under vacuum. There was a linear relation be- tween the specific heat and the ambient temperature, and the specific heat under vacuum was larger than that in air at high temperature. The thermal conductivity increased with density and the ambient temperature. To discuss the effects of the atmospheric conditions on the thermal constants of wood, a theoretical model of thermal conductivity was pro- posed and its validity examined, where the wood was as- sumed to be a uniformly distributed material composed of cell walls and air.
K e y w o r d s Thermal diffusivity • Heat capacity • Thermal conductivity. Laser flash method - Heating process
Introduction
The thermal constants are thermal diffusivity a(mX-s-1), specific heat c(J.kg-l.K 1), and thermal conductivity k(W-m-a.K-i). Thermal diffusivity a is defined as
T. Harada ( ~ )
Forestry and Forest Products Research Institute, Ibaraki 305-8687, Japan
Tel. +81-298-73-3211; Fax +81-298-73-3797 e-mail: [email protected]
T. Hata • S. Ishihara
Wood Research Institute, Kyoto University, Uji 611-0011, Japan
Part of this paper was presented at the 47th annual meeting of Japan Wood Research Society at Kochi, April 1997
k
- ( 1 )
pc
where p(kg.m 3) is the density of the solid. The thermal constants of wood are generally measured in the steady state, and measurements at high temperature are difficult. Consequently previous studies mainly targeted the proper- ties at room t e m p e r a t u r e Y
The thermal constants during the heating process are important for analyzing the combustibility and fire endurance of wood. Moreover, these studies are expected to give significant clues for clarifying the mechanism of the property change in the charring process. Previous studies on the relations between the ambient temperature and the thermal constants of wood were mainly performed below 100°C. In this temperature range it has been found that specific heat and thermal conductivity increase in proportion to the temperature, and the thermal diffusivity is assumed to be constant. 1'4 So far, there have been few reports for temperatures above 100°C, although Ouchi 6 measured the thermal conductivity of wood up to 300°C.
426
of w o o d during the heating process and under v a c u u m conditions.
In this study, the thermal constants of wood specimens were m e a s u r e d by means of the laser flash m e t h o d in the range of r o o m t e m p e r a t u r e to 270°C in air or under v a c u u m conditions. T o discuss the effects of the specimen's density and the atmospheric condition, a theoretical m o d e l of thermal conductivity was p r o p o s e d and its validity examined, where the w o o d specimen was assumed to be uniformly distributed material c o m p o s e d of cell walls and air.
Theory
Siau 3 p r o p o s e d a microscopic m o d e l of the w o o d with rectangles c o m p o s e d of the cell wall and the lumen (i.e., a single wall model) and presented a theoretical equation of the thermal conductivity of the w o o d based on the equation for calculating the thermal resistance of a parallel multilayer material. Although the effects of the air in the lumen and the density of w o o d were considered in his model, a factor had to be introduced because the m o d e l was too microscopic and the entire width of the cross wall was not effective for conduction because of nonuniformity. Accordingly, his theoretical equation be- came complicated.
On the other hand, w h e n the w o o d is considered as a uniformly distributed material consisting of cell walls and air (i.e., a macroscopic model), the thermal conductivity of a w o o d specimen in air with a void ratio x can be easily expressed as
kAt,p = (1 - x)kw + x - k a (2)
where kAt., is the thermal conductivity of wood with density p, and kw and k~ are the thermal conductivities of the cell wall and the equivalent thermal conductivity of the air, respectively. T h e void ratio x is calculated as follows.
x = 1 - - C ( 3 )
Pw
where p (kg-m 3) is the apparent density of wood, and pw(kg.m -3) is the density of the cell wall. If we assume k w and Pw are uniform regardless of the species, the theoretical equation for the thermal conductivity of w o o d in air is expressed as a simple equation of the density p. Empirically, the thermal conductivity of w o o d is assumed to increase in proportion to the density at r o o m temperature, and this expression agrees with the empirical formula. If we assume that the lumen is insulated under v a c u u m conditions, the theoretical equation is expressed as
kva,, = (1 - x)kw (4)
where kva,, is the thermal conductivity of w o o d under vacuum.
Materials and methods
Laser flash m e t h o d
T h e thermal constants were d e t e r m i n e d by the thermal con- stants measuring apparatus (Sinku-riko TC7000H system) according to the J a p a n e s e Industrial Standard (JIS R-1611). 7
T h e thermal diffusivity a(m2"s -1) was calculated by
L2 _ 0.1388 .L2 (m~.s 1) (5) a = 1.37 7v2. tl/2 h/z
where L is the thickness of the specimen, and tl/2 is the half- time for the rear face of the specimen to reach half of the m a x i m u m rear face t e m p e r a t u r e rise A Tn~ax.
T h e specific heat c(J.kg-l.K 1) was calculated f r o m the m a x i m u m rear face t e m p e r a t u r e rise A Tmax. This is based on the assumption that the energy absorption at the surface is constant. T h e energy absorption Q is expressed by
Q = c.L.p.ATm~ x (6)
T h e specimens were heated by an electric furnace. T h e rate of t e m p e r a t u r e increase was 8°C.min 1. T h e thermal constants of the specimens were m e a s u r e d after the atmo- sphere stabilized at the expected t e m p e r a t u r e b o t h in air and under vacuum. In the measuring system, v a c u u m condi- tions were achieved using oil rotary and oil diffusion pumps.
Specimens
Thirteen species of w o o d (Table 1) were used for the experi- ments at r o o m temperature. For the experiments during the heating process, five species of w o o d - hiba (Thujopsis dolabrata Sieb. and Zucc. var. hondai Makino), hinoki (Chamaecyparis obtsusa (Sieb. and Zucc.) Endl.), kiri (Pau- lownia tornentosa Steud.), b u n a (Fagus crenata B1.), and akagashi (Quercus acuta Thunb.) - were used. T h e hiba specimens were m e a s u r e d at 30 ° , 60 ° , 90 ° , 120 ° , 150 o , 180 ° , 210 °, 240 °, and 270°C. T h e other four species were m e a s u r e d at 20 °, 90 °, 150 °, 180 °, 210 °, and 240°C. O n e or two replica- tions were p e r f o r m e d for each specimen and temperature.
Each specimen was in the shape of a circular plate with a diameter of about 1 0 m m and a thickness of l m m . T h e radial or tangential surface of w o o d was irradiated with the laser pulse. T h e laser pulse can easily p e n e t r a t e porous materials such as wood. T o avoid this problem, the speci- mens were thinly painted with silver paste. Moreover, carbon black was sprayed on b o t h sides of the specimens to i m p r o v e the absorption of the laser energy and the accu- racy of t e m p e r a t u r e m e a s u r e m e n t using the noncontact t h e r m o m e t e r .
Results and discussion
Specific heat at r o o m t e m p e r a t u r e
Table 1. Wood materials tested
Species Thickness Density
(mm) (kg.m -3) Softwood
Hinoki (Charnaecyparis obtsusa (Sieb. and Zucc.) Endl.) 1.2 360 Hiba (Thujopsis dolabrata Sieb. and Zucc. vat. hondai Makino) 1.0-1.4 375
Redwood (Sequoia sempervirens Endl.) 1.0 391
Akamatsu (Pinus densiflora Sieb. and Zucc.) 1.1 424
Karamatsu (Larix leptolepsis Gord) 0.9 504
Hardwood
Kiri (Paulownia tomentosa Steud.) 1.0 286
Hannoki (Alnus japonica Steud.) 1.1 378
Buna (Fagus crenata B1.) 1.1 488
Onigurumi (Juglans soeboldiana Maxim.) 1.1 583
Aodamo (Fraxinus lanuginosa Koidz.) 1.1 636
Keyaki (Zelkova serrate Makino) 0.9 728
Mizunara (Quercus mongolica Torcz. var. grosserrata Rehd. 1.1 788 and Wils.)
Akagashi (Quercus acuta Thunb.) 1.0 965
Thicknesses and densities are given as average values
1.25 × 10³J.kg-t.K 1 is reported in chronological scientific 2.0 tables. ~* To confirm whether similar results could be ob-
tained using the laser flash method, the specific heats in air , and under vacuum conditions were calculated. W h e n the 1.6 specific heat of the akamatsu specimen at r o o m tempera- 7 ture in air (specimen A) was assumed to be 1.25 ×
103j-kg-l.K -1, the specific heats of the other specimens ~ 1.2
(specimen B) were calculated according to , -
x
ATA . . . PA
C B = C A X ZJVBma~ X --PB ( 7 ) "~11) 0 . 8
, ¢"
O where the subscripts A and B denote the values for speci-
o 0 . 4 m e n A and specimen B, respectively. The results are shown ~. in Fig. 1. Although the values were scattered, the specific oo heats at r o o m temperature are roughly constant regardless
of the species, density, and t h e presence of air. Conse- 0.0 quently, we adopted 1.25 x 10³j.kg 1.K-I as the specific
heat of w o o d at r o o m temperature.
Thermal conductivity at r o o m temperature
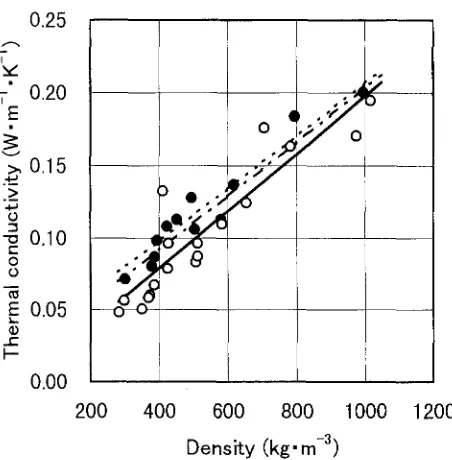
The thermal conductivities of the specimens were calcu- lated using Eq. (1). T h e results are shown in Fig. 2. It is clear that the thermal conductivity increases in proportion to the density, and the values in air are larger than those under vacuum conditions.
There have been m a n y studies on the thermal conductiv- ity of w o o d in air. U r a k a m i and Fukuyama, 4 for example, reported the relation between density and thermal conduc- tivity, kA~,~.R, in a direction perpendicular to the grain of wood at r o o m temperature as follows:
kat.p,R = 0.0174 + 1.86 × 10⁻⁴p ( W . m - l . K -1) (8) where the subscript R denotes the value at r o o m tempera- ture. This regression line for Eq. (8) on the data is shown in Fig. 2. The measured values of kAt,p,R w e r e almost on this
0 ~ C O 0 • '
, O; q
I
I
200 400 600 800 1 0 0 0 1200
Density (kg" m -3)
Fig. L Effects of density and air on specific heat at room temperature.
Filled circles, measured in air; open circles, measured under vacuum
line, and the validity of the thermal conductivity obtained by the laser flash m e t h o d was confirmed.
428
0.25
T 0.20 E
>, 0.15 .>_
0
0.10
C O O
E 0.05
t- i--0.00
I~ ,,2; b
° S
O.g;e
I P O ~1000
200 400 600 800 1200
Density (kg" m -a)
Fig. 2. Effects of density and air on thermal conductivity at room temperature. Filled circles, measured in air; open circles, measured under vacuum; alternate long and short dashed line, regression line calculated by Urakami and Fukayama4; broken line, theoretical line in air; solid line, theoretical line under vacuum
~E
0
X
.2
E
I- 0.25
0.20
0.15
0.10
0.05
0.00 L _ _ - ~ _ -
200 400 600 800 1000 1200
Density (kg- m -3)
Fig. 3. Effects of density and air on thermal diffusivity at room tem-
perature. Filled circles, measured in air; open circles, measured under vacuum; broken line, theoretical line in air; solid line, theoretical line under vacuum
and the values of
kAt,p,R
andkva,p,R
w e r e calculated for arbi- trary density p. T h e theoretical equations for kAt,p,R , kva,p,Rwere as follows, and the relations are plotted in Fig. 2.
kAt,p,R = 0.0256 + 1.81 × 10⁻⁴/9 (W.m 1.K-I) (9)
kva,p,R ~ 1.97 X 10⁻⁴p ( W . m - I . K 1) (10)
T h e theoretical values showed good a g r e e m e n t with the experimental values, and the validity of the theory at r o o m t e m p e r a t u r e was confirmed.
T h e r m a l diffusivity at r o o m t e m p e r a t u r e
T h e thermal diffusivities at r o o m t e m p e r a t u r e are shown in Fig. 3. T h e theoretical values of the thermal diffusivity cal- culated f r o m the above equations are also shown in Fig. 3. Although the experimental values were slightly scattered, the values under v a c u u m conditions were smaller than the values in air. According to Fig. 3, the theoretical m o d e l explains the tendency of the experimental results; that is, the theoretical m o d e l shows that the values in air decrease with density, and those under v a c u u m conditions are almost the same for the different species and smaller than the values m e a s u r e d in air.
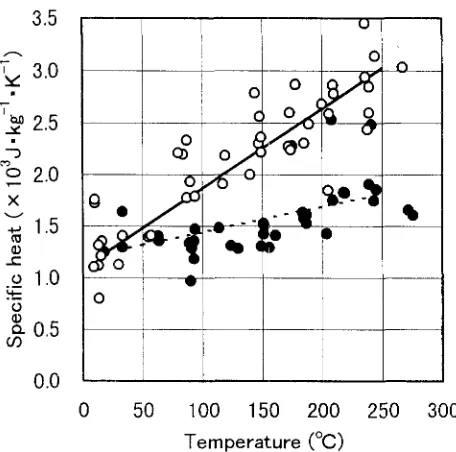
H e a t capacity during the heating process
T h e heat capacities of kiri, hiba, hinoki, buna, and akagashi during the heating process are shown in Fig. 4. T h e heat capacities during the heating process were calculated from
L'PR
ZJTmaxR (J.kg ~.K z) (11)C T = C R X ×
L" pz
Z]TmaK.Twhere the subscripts R and T denote the values at r o o m t e m p e r a t u r e and at t e m p e r a t u r e T, respectively, and CR was taken to be 1.25 × 10³J.kg-LK z. T h e differences between species were small, and the following regression formulas were obtained.
In air:
CAt,T : 1200 + 2.45 × T (J.kg-l.K -1)
(n = 37, r = 0.64) (12)
U n d e r vacuum:
CVa.T = 1100 + 7.72 × T (J.kg-l.K 1)
(n = 44, r = 0.88)
(13)
where T is the ambient t e m p e r a t u r e (°C), and its range is f r o m r o o m t e m p e r a t u r e to 240°C; n is the n u m b e r of speci- mens; and r is the correlation coefficient. The specific heat at 20°C was taken to be 1.25 × 10³j-kg-l.K 1. It is known that the specific heat of w o o d increases linearly with the t e m p e r a t u r e for t e m p e r a t u r e s less than 100°C. It was found that this tendency continued up to 240°C; above this tem- p e r a t u r e the specimens pyrolize rapidly.
3.5 I ! I u i
i n',
,~ 3.0 ' ~ n
• o o
T 25 g -
4x
o
o 0 / _
. . .
, -11 •o 1.0
q= o
O d3
0.5
03
]
0.0 i
0 50 100 150 200 250
Temperature (°C)
300
Fig. 4. Relation between temperature and specific heat. Filled circles,
measured in air; open circles, measured under vacuum; broken line,
regression line in air; solid line, regression line under vacuum
t v
T
E
v
.>
O "1 "13
C
O O
E
r -
0.25
0.20
0.15
0.10
0.05
0.00
E
]
I !
I
J
[
o
..o-- o " " " i
0 50 100 150 200 250 300
Temperature (°C)
Fig. 5. Relation between temperature and thermal conductivity of hiba. Filled circles, measured in air; open circles, measured under vacuum; broken line, regression line in air; solid line, regression line under vacuum
thought that the effect of the heat loss from the lumen is significant.
T h e r m a l conductivity during the heating process
T h e thermal conductivity of hiba during the heating process is shown in Fig. 5. T h e r e were linear relations b e t w e e n the thermal conductivity of the wood and the ambient tem- p e r a t u r e both in air and under vacuum. Considering these results in relation to the above discussion, we can assume that the thermal conductivity of w o o d is correlated with its density and the ambient temperature. W e analyzed the rela- tions b e t w e e n the three p a r a m e t e r s using multiple regres- sion analysis and obtained the following results.
In air:
ka~,,,T = 0.00249 + 0.000145p + 0.000184T
( W . m - l . K 1 ) ( r / = 37, R . 2 = 0.76)
U n d e r vacuum:
(14)
kva,p.y = -0.0237 + 0.000208p + 0.000361T
(W.m L.K-1)(n = 44, R . 2 = 0.76) (15)
where R .2 is the coefficient of determination adjusted by the degrees of f r e e d o m and a t e m p e r a t u r e range of r o o m t e m p e r a t u r e to 240°C. Although the coefficients of deter- mination were slightly low, it was found that the values for
kAt,p,T and kva,p,T could be estimated f r o m multiple regression formulas.
W e found (above) that the thermal conductivity at r o o m t e m p e r a t u r e could be explained by the theoretical model. W e now consider whether the theoretical model also
applies to thermal conductivity during the heating process. Here, the thermal conductivities of the cell wall in air and under v a c u u m were calculated f r o m the results of hiba specimens and were compared. If Eq. (4) holds at ambient temperature, the thermal conductivity of the cell wall at T under v a c u u m kw.w,T can be obtained f r o m the data of the hiba specimens. T h e regression formula b e t w e e n kva,w,r and T was determined to be
kv~.w,f = 0.291 + 0.000836T ( W - m - I - K 1)
(16) (n = 14, r = 0.93)
where the thermal conductivity at 20°C was taken to be 0.308W.m 1.K-~ to correlate with the value at r o o m temperature.
T h e equivalent thermal conductivity of the air at T was calculated f r o m the known thermal properties of the air ~ as follows.
= 0.0243 + 0.0000722T (W-m 1.K-1)
&,T
(17)As mentioned, because there is heat loss in the high tem- perature air, the thermal conductivity calculated f r o m Eqs. (4), (16), and (17) did not agree with the experimental values. It is necessary to introduce the coefficient/~ to cor- rect for the effect of the heat loss. Because the rate of the CAt,R increase against T was about one-third that of CVa.R and the thermal conductivity is expressed by k = a . p . c from Eq. (1), we set # = 0.33. Thus the thermal conductivity of the cell wall in the high-temperature air kAt,w,T is given by
= 0.291 + 0.000836 × F × T (W-m l - K - ' )
k A t w.T (18)
.~.
0.35
"r I
r E 0.30
¢
o o
"~
0.25% o /
o
o 0 . 2 0 o "
• "o 0 ~- ( / "
o 0.15
"~ o, ~ o ]
0 1 0
0.05
I o
0 I 0 0
]
0.00 0.05 0.10 0.15 0.20 0.25 0.30 0.35
M e a s u r e d t h e r m a l c o n d u c t i v i t y ( W " m -~. K -~) Fig. 6. Relation between the measured and calculated thermal conduc- tivities from room temperature to 240°C. Filled circles, values in air;
open circles, values under vacuum; broken line, regression line in air;
solid line, regression line under vacuum
s h o w e d g o o d a g r e e m e n t . Consequently, if the h e a t loss is c o r r e c t e d for, the t h e o r e t i c a l m o d e l for t h e r m a l conduc- tivity is valid for high t e m p e r a t u r e s up to 240°C in air.
T h e r m a l diffusivity during the heating process
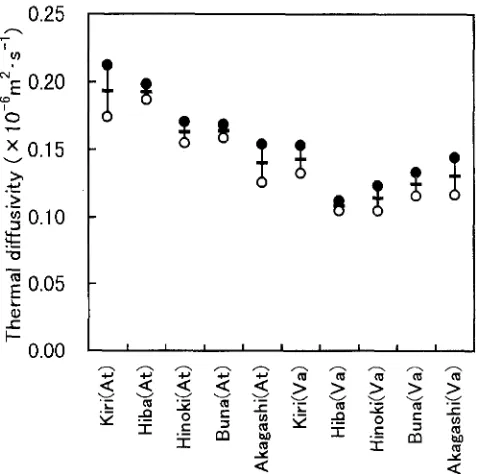
The values for t h e r m a l diffusivity during the heating p r o - cess of kiri, hiba, hinoki, buna, and akagashi are given in Fig. 7. It is e v i d e n t that t h e r e is little change in the t h e r m a l diffusivity during the h e a t i n g process up to 240°C b o t h in air and u n d e r vacuum, H o w e v e r , differences b e t w e e n the species w e r e observed. T h e m e a n values and their 95% confidence limits are illustrated in Fig. 8, which indicates that the l o w e r - d e n s i t y w o o d specimens have larger t h e r m a l diffusivities in air, w h e r e a s t h e r e is little difference b e t w e e n the species u n d e r vacuum. T h e t h e o r e t i c a l t h e r m a l diffusivity t e n d e n c y illustrated in Fig. 3 was also s u p p o r t e d by these results. A l t h o u g h the t h e r m a l diffusivity u n d e r v a c u u m calculated f r o m the t h e o r e t i c a l m o d e l is constant, according to Fig. 8, t h e r e is a t e n d e n c y for the t h e r m a l diffusivity u n d e r v a c u u m to increase slightly with the den- sity. F u r t h e r study is n e c e s s a r y to clarify this point.
Conclusions
T h e t h e r m a l constants of w o o d specimens w e r e m e a s u r e d by m e a n s of the laser flash m e t h o d at r o o m t e m p e r a t u r e and during the h e a t i n g process up to 270°C, and the a t m o - spheric conditions in air or u n d e r vacuum. T h e effects of a t m o s p h e r i c conditions on t h e r m a l constants were
0.25
Iff)
0 . 2 0
E
x
0.15 >, .>__= 0.10
" O
E o.o5
[.,-
I--
I
+
• e e ~ [ •
• • + ~
• •
•
~O
•
aA
• x * A
o ° o oO
O ;~ O
0 . 0 0
0 50 100 150 200 250 300
Temperature (°C)
Fig. 7. Relation between temperature and thermal diffusivity. Pluses,
kiri in air; crosses, kiri under vacuum; filled circles, hiba in air; open circles, hiba under vacuum; filled rhombuses, hinoki in air; open rhom- buses, hinoki under vacuum; filled triangles, buna in air; open triangles,
buna under vacuum; filled squares, akagashi in air; open squares,
akagashi under vacuum
0.25
I
el
~E 0.20
x 0 . 1 5
._> 3 0 . 1 0
" O
0.05
t-
O .00 I I I I I I I I I
~ = ~ ~ ~ . -
"-
~
w
Fig. 8. Population mean of thermal diffusivity (95% confidence limits).
Filled circles, upper confidence limit; open circles, lower confidence limit; minuses, average value; (At), measured in air; (Va), measured under vacuum
discussed; a t h e o r e t i c a l m o d e l of the t h e r m a l conductivity was p r o p o s e d and its validity examined. The results can b e s u m m a r i z e d as follows.
D u r i n g the heating process there was a linear relation b e t w e e n specific heat a n d the a m b i e n t t e m p e r a t u r e , a n d the specific heat u n d e r v a c u u m was larger t h a n that in air.
2. T h e t h e r m a i conductivity increased with the density a n d the a m b i e n ! t e m p e r a t u r e . T h e theoretical m o d e l explained the t h e r m a l conductivity at r o o m t e m p e r a t u r e effectively. D u r i n g the heating process, it is necessary to correct for the effect of heat loss.
3. T h e t h e r m a l diffusivities u n d e r v a c u u m conditions were smaller t h a n those in the air, a n d these values varied little in the heating process up to 240°C. This t e n d e n c y was also explained effectively by the theoretical model.
References
1. Takahashi A, Nakayama Y (1992) Mokuzai Kagaku Koza 3 Butsuri (Wood Science Series 3 Physics) (in Japanese). Kaisei-sha, Otsu, pp 45-50
2. Maku T (1954) Studies on the heat conduction in wood. Wood Res 13:1-80
3. Siau JF (1984) Transport processes in wood. Springer, Tokyo, pp 132-143
4. Urakami H, Fukuyama M (1981) The influence of specific gravity on thermal conductivity of wood (in Japanese). Bull Kyoto Prefect Univ For 25:38-45
5. Kollmann F (1951) Technologie des Holzes und der Holz- welkstoffe, vol 1. Springer, Berlin, p 514
6. Ouchi T (1988) Thermal conductivity of wood at high temperature. In: Proceedings of the 1988 international conference on timber engineering, Seattle, pp 441-447
7. JIS R 1611 (1991) Testing method of thermal diffusivity, specific heat capacity, and thermal conductivity for high performance ceramics by laser flash method (in Japanese). Japanese Industrial Standard
8. Parker WJ, Jenkins RJ, Butler CP, Abbott GL (1961) Flash method of determining thermal diffusivity, heat capacity, and thermal conductivity. J Appl Physics 32:1679-i684
9. Uesugi S, Ishihara S, Hata T (1993) Measurement of thermal con- stants of wood by laser flash method (in Japanese). In: Abstracts of the 43rd annual meeting of the Japan Wood Research Society, Morioka, p 384
10. Murata K, Sadoh T (1994) Heat absorption and transfer in soft woods and their knot surfaces (in Japanese). Mokuzai Gakkaishi 40:1180-1184
11. National Astronomical Observatory (1992) Rika nenpyo (Chrono- logical Scientific Tables) (in Japanese). Maruzen, Tokyo, p 475 12. Shoji M (1995) Heat transfer textbook, University of Tokyo series