J. Sens. Sens. Syst., 2, 95–102, 2013 www.j-sens-sens-syst.net/2/95/2013/ doi:10.5194/jsss-2-95-2013
©Author(s) 2013. CC Attribution 3.0 License.
RGB
Geoscientific Instrumentation Methods and Data Systems
Discussions
Geoscientific Instrumentation Methods and Data Systems
Open Access
Web Ecology
Open Access
Open
Access
JSSS
Journal of Sensors and Sensor SystemsImprovement of the sensitivity of a conductometric soot
sensor by adding a conductive cover layer
P. Bartscherer1and R. Moos2
1Robert Bosch GmbH, Robert-Bosch-Platz 1, 70839 Gerlingen-Schillerh¨ohe, Germany
2Bayreuth Engine Research Center (BERC), University of Bayreuth, 95447 Bayreuth, Germany
Correspondence to: R. Moos ([email protected])
Received: 22 February 2013 – Revised: 2 June 2013 – Accepted: 4 June 2013 – Published: 3 July 2013
Abstract. Diesel particulate filters are emission-relevant devices of the exhaust gas aftertreatment system. They need to be monitored as a requirement of the on-board diagnosis. In order to detect a malfunction, planar sensors with interdigital electrodes on an insulating substrate can be installed downstream of the filter. During the loading phase, soot deposits onto the electrodes, but the sensor remains blind until the percolation threshold has been reached (initiation time) and the sensor current starts to flow. In order to detect small soot concentrations downstream of the filter from small defects, this initiation time needs to be as low as possible. One may reduce the initiation time by covering the interdigital electrodes with an electrically conductive layer. Using finite element method (FEM) simulations, the influence of conductivity and thickness of such a coating
on the initiation time are determined. It is found that a thin, screen printable coating with a thickness of 20µm
and a conductivity in the range of 10−3to 10−1S m−1may reduce the initiation time by about 40 %. The FEM
results were verified by a commercially available thick film resistor paste with a conductivity of 0.45 mS m−1,
showing an improvement of about 40 % compared to an uncoated sensor.
1 Introduction
Together with the constantly tightening limits of harmful ex-haust gas emissions of internal combustion engines, a perma-nent monitoring of all emission-relevant devices is required (Europ¨aisches Parlament, 2007; European Union, 2008). For
Diesel engines, NOxabatement and particulate matter (PM)
reduction are of special importance (Johnson, 2007; Twigg, 2007). PM consists of aggregated carbon soot particles, cov-ered with organics like (polycyclic aromatic) hydrocarbons, and inorganic oxides (e.g., ashes originating from wear of the engine or engine oil additives) (Spears, 2008; U.S. Environ-mental Protection Agency, 2002). Not only due to the small size of these particles, ranging between only a few tens and some hundreds of nanometers (Harris and Maricq, 2001), but also because of the soluble organic fraction (SOF) covering the surface of these small particles (Otto et al., 1980; U.S. Environmental Protection Agency, 2002), serious concerns
exist about the effect of PM to human health (Geiser, 2005;
Adar et al., 2010; Grahame and Schlesinger, 2010; U.S. En-vironmental Protection Agency, 2002).
In order to reduce the mass and the number of PM in the exhaust, diesel particulate filters (DPF) – typically porous ce-ramic wall-flow filters (Fino, 2007; Twigg and Phillips, 2009) – are installed in the exhaust line. When soot is deposited in the filter, the pores get clogged and the exhaust backpressure increases with increasing soot load (Alkemade and Schu-mann, 2006; Duvinage et al., 2001). Therefore, the DPF must be regenerated from time to time, typically by heating the
fil-ter to several hundred◦C and oxidizing the soot. Currently
the approach is to use the pressure difference up- and
1
2
3
Figure 1.Image of an uncoated blank sensor with interdigital electrodes (IDEs) and feed lines
4
5 6 7 8 9
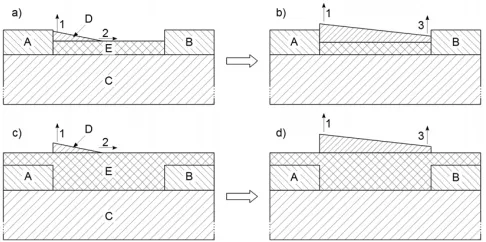
Figure 2. Geometry used for the simulations. The upper row (a and b) depicts the setup for a coating (E) being thinner than the electrodes (A) and (B). The lower row depicts the case of a coating (E) being thicker than the electrodes (coating covers the electrodes). 1, 2 and 3 indicate the growth direction of the soot path (D). C indicates the electrically insulating substrate.
18
Figure 1.Image of an uncoated blank sensor with interdigital
elec-trodes (IDEs) and feed lines.
1
2
3
Figure 1.Image of an uncoated blank sensor with interdigital electrodes (IDEs) and feed lines
4
5 6 7 8 9
Figure 2. Geometry used for the simulations. The upper row (a and b) depicts the setup for a coating (E) being thinner than the electrodes (A) and (B). The lower row depicts the case of a coating (E) being thicker than the electrodes (coating covers the electrodes). 1, 2 and 3 indicate the growth direction of the soot path (D). C indicates the electrically insulating substrate.
18
Figure 2. Geometry used for the simulations. The upper row (a
and b) depicts the setup for a coating (E) being thinner than the electrodes (A) and (B). The lower row (c and d) depicts the case of a coating (E) being thicker than the electrodes (coating covers the electrodes). 1, 2 and 3 indicate the growth direction of the soot path (D). C indicates the electrically insulating substrate.
The first method is serial standard, but it has not been clarified yet whether this method is precise enough to de-tect reliably small malfunctions of DPFs, like small cracks or holes that lead to soot slip. Therefore, sensors measuring the amount of soot in the exhaust downstream of a DPF are in discussion. Many principles for such sensors have been investigated, but the conductometric approach is considered the best choice for PM detection, especially with respect to the low-cost of a sensor (Riegel and Klett, 2008). A typi-cal conductometric PM sensor is shown in Fig. 1. It con-sists of two electrodes that are typically applied as interdig-ital electrodes (IDEs) on an electrically insulating substrate. Recent approaches are given by Ochs et al. (2010), Lloyd Spetz et al. (2012), Groß et al. (2012), Hagen et al. (2010), Bartscherer et al. (2007), Bartscherer and Schmidt (2008), or Bartscherer et al. (2008).
Soot is deposited by thermophoresis on the IDE structure. If a voltage is applied between both electrodes, electrophore-sis also occurs. It even prevails over the thermophoretic
effect.
If one neglects the substrate conductivity, the current does not flow before the first percolation path forms between the electrodes. In other words, the sensor remains “blind” at the beginning of a loading cycle. This blind time as well as the
Table 1.Electrical conductivities of the conductive layer in mS m−1
used for different layer thicknesses and base currents/resistances.
Wanted sensor Conductivity for different thickness properties b of the conductive layer Rno soot Ino soot 1µm 11µm 20µm 40µm
300 kΩ 0.1 mA 9.01 0.82 0.46 0.25 30 kΩ 1 mA 90.09 8.19 4.61 2.49 3 kΩ 10 mA 900.90 81.93 46.08 24.96
initiation time increases with decreasing PM concentration. Therefore, it will take some time to detect a DPF defect, especially for very small defects with very low soot con-centration downstream of the DPF. To overcome this and to reduce the blind time, we suggest applying an electrically conductive layer that connects both electrodes and covers all the space in between them. By adding such a layer, a soot-dependent current can be measured even if no soot percola-tion paths have reached the counter electrode.
It is the object of this study to demonstrate the feasibil-ity of this idea. The first part of this article describes an FEM study to estimate suitable parameters with respect to conductivity and thickness of the conductive film. Later on, sensors coated with a commercial ruthenium oxide (RuO2)-based thick-film paste were used to verify the results of the
simulations. RuO2 was only selected to prove the concept.
For a reliable application in the exhaust, material with better long-term stability have to be applied.
2 FEM Modeling
2.1 Setup and modeling
One part of an IDE (as depicted in Fig. 2) was FEM mod-eled (FEM software Comsol Multiphysics). To comply with Fig. 1, the electrode width (w) and spaces (s) between the
electrodes were set to 150µm each and the electrode
thick-ness to h=10µm. The substrate thickness was set to 500µm.
Further elements of the sensor, like the embedded heater (Ochs et al., 2012), have not been considered in the model. All free edges of the sensors were set to an electric insu-lation (boundary condition). For the substrate conductivity,
10−12S m−1was assumed, which is a typical value for
tech-nical alumina at 200–400◦C (Evans, 1995). Four different
thicknesses (b) of the conductive layer were modeled, each
one with three different electrical conductivities (for values
of the conductivities see Table 1). The conductivities were adjusted in a way that the basic current of the sensor without soot load, Ino soot, was 0.1 mA, 1 mA, or 10 mA at an applied
voltage of U=30 V. Therefore, the conductivity for a thin
layer had to be higher; the conductivity for a thicker layer had
to be lower in order for the four different layers to exhibit the
P. Bartscherer and R. Moos: Improvement of the sensitivity of a conductometric soot sensor 97 1
2
0 5 0 1 0 0 1 5 0
0 5 1 0 1 5 2 0 2 5 3 0
s i m u l a t i o n m e a s u r e d
Isim
/ µ A
t
s i m / a r b i t r a r y u n i t s
0 1 0 0 2 0 0 3 0 0 4 0 0
0 5 1 0 1 5 2 0 2 5 3 0 t
m e a s u r e d / s
Imea s u r e d
/ µ A
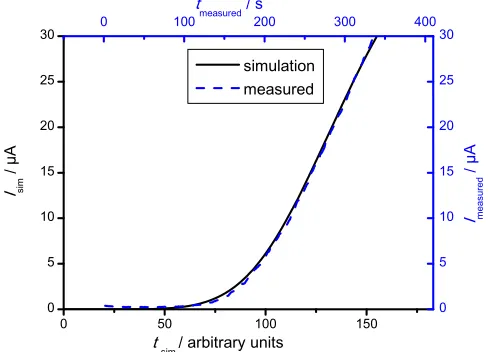
Figure 3. Simulation and real measurement of soot signal for a blank sensor
0 5 0 1 0 0 1 5 0 2 0 0 2 5 0
0 , 0 0 , 5 1 , 0 1 , 5 2 , 0 1 0 , 0 1 0 , 5 1 1 , 0
3 0 0 k Ω b l a n k s e n s o r
3 k
Ω
Itota
l / m A
t
s i m / a r b i t r a r y u n i t s
3
4 5 6
7
3 0 k Ω
Figure 4. Simulation of the total current, Itotal, for sensors with different conductive coatings
leading to base resistances (without soot) of 3 kΩ, 30 kΩ, and 300 kΩ, see Table 1,compared to a blank sensor. Coating thickness b = 11 µm.
19
Figure 3.Simulation and real measurement of soot signal for a
blank sensor.
Two geometries of the conductive layer have to be consid-ered. In one case, the layer is thinner than the electrodes (i.e.
b<h=10µm) and the electrodes are not covered by the
ap-plied conductive layer (Fig. 2a and b; top row). In this case, the soot can contact the electrodes directly. In the other case,
the conductive layer is thicker than the electrodes (b>h) and
covers them (Fig. 2c and d; bottom row). In this case, soot has no direct contact to the electrodes.
Since there is not much known about the growth of soot paths in an electric field, some assumptions had to be made for the simulation. Light optical microscopy (Fig. 8) revealed that the soot paths are denser at one electrode – presumably at the electrode at which the growth is initiated – than on the other one. Therefore, the growing soot path was assumed to be wedge-shaped (D in Fig. 2), initially growing vertically at position 1 and horizontally at position 2 at the same time. When it reaches the counter electrode (position 3), it stops growing horizontally and the growth is vertical also at this position. From this point on, the the soot layer would con-tribute also to the current of a sensor without a conductive layer. At the end of the growth, the height of the wedge is
5µm at position 1 and 2.5µm at position 3. Since the
elec-trical conductivity of soot may vary with the type of soot, a macroscopic approach was conducted. A blank sensor with-out conductive layer but fully covered with soot shows a cur-rent of approximately 1 mA, if a dc voltage of 30 V is applied
to the electrode (at a sensor temperature of about 50◦C). This
corresponds to a resistance of 30 kΩ. The electrical
conduc-tivity of the soot in the simulations was chosen in a way that the resistance of the soot wedge amounted to this value at the end of the growth. Hence, the electrical conductivity of the
soot should be about 25 mS m−1.
In reality, there is not only one soot path growing from one electrode to the other but instead many soot paths start
to grow at different times. All paths are parallel connected
1
2
0 5 0 1 0 0 1 5 0 0
5 1 0 1 5 2 0 2 5 3 0
s i m u l a t i o n m e a s u r e d
Isim / µ A
t
s i m / a r b i t r a r y u n i t s
0 1 0 0 2 0 0 3 0 0 4 0 0
0 5
1 0 1 5 2 0 2 5 3 0
t
m e a s u r e d / s
Imea s u r e d / µ A
Figure 3. Simulation and real measurement of soot signal for a blank sensor
0 5 0 1 0 0 1 5 0 2 0 0 2 5 0 0 , 0
0 , 5 1 , 0 1 , 5 2 , 0 1 0 , 0 1 0 , 5 1 1 , 0
3 0 0 k
Ω
b l a n k s e n s o r 3 k
Ω
Itota l / m A
t
s i m / a r b i t r a r y u n i t s
3
4 5 6
7
3 0 k
Ω
Figure 4. Simulation of the total current, Itotal, for sensors with different conductive coatings
leading to base resistances (without soot) of 3 kΩ, 30 kΩ, and 300 kΩ, see Table 1,compared to a blank sensor. Coating thickness b = 11 µm.
19
Figure 4.Simulation of the total current, Itotal, for sensors with
dif-ferent conductive coatings leading to base resistances (without soot) of 3 kΩ, 30 kΩ, and 300 kΩ(see Table 1) compared to a blank sen-sor. Coating thickness b=11µm.
and contribute to the total current according to their state of growth. To represent that, a Gaussian distribution (Eq. 1) of the number of paths, npaths, starting to grow at a certain time,
ts, in the simulation was assumed.
npaths(ts)= 1
25·√2π
·e−12
ts−75
25 2
·15 000 (1)
Since the simulation should reveal only relative results for
the different varied parameters, and due to the many
uncer-tainties of the soot growth and its nature, the simulations
have been done using arbitrary units for the time, ts. Diff
er-ent growth rates of the soot paths were not considered. Using this approach, only one path had to be calculated, but the out-put current of the whole sensor was obtained by superposing the currents of each single path according to the Gaussian distribution. Calculated and measured current progressions for a blank sensor without conductive layer agree quite well (Fig. 3) if one assumes appropriate scaling factors for current and time.
It should be annotated here that this model for the soot path growth does not consider the physical deposition mechanism of the soot. However, it will be shown that it is a very useful approximation that describes the current response quite well. The measurement procedures for the experiments leading to Fig. 3 are described in the experimental Sect. 3.
2.2 Variations of the layer parameters
In the following, Itotalrefers to the total current of a sensor,
including the current through the conductive cover layer (if present) and the collected soot (the current through the sub-strate can be neglected because the subsub-strate is insulating),
98 P. Bartscherer and R. Moos: Improvement of the sensitivity of a conductometric soot sensor
0 5 0 1 0 0 1 5 0 2 0 0 2 5 0
0 , 0 0 , 2 0 , 4 0 , 6 0 , 8 1 , 0
b l a n k s e n s o r
3 k
Ω
3 0 k Ω
Δ
I / m A
t
s i m / a r b i t r a r y u n i t s
3 0 0 k Ω
1
2 3
Figure 5. Current deviation ΔI = Itotal - Ino soot, for coatings with base resistances (without soot)
of 3 kΩ, 30 kΩ and 300 kΩ, compared to a blank sensor. For raw data see Fig. 4
0 2 5 5 0
0 1 2 3 4 5
t r i g g e r l i m i t
b l a n k s e n s o r
3 0 0 k Ω 3 0 k
Ω
3 9
3 k
Ω
5 2 3 3
Δ
I / µ A
t
s i m / a r b i t r a r y u n i t s 3 2
4
5 6
Figure 6. Magnification of Fig. 5 to determine the initiation time ti for coatings with different
base resistances (without soot).
20
Figure 5. Current deviation ∆I=Itotal−Ino soot, for coatings with
base resistances (without soot) of 3 kΩ, 30 kΩand 300 kΩ, com-pared to a blank sensor. For raw data see Fig. 4.
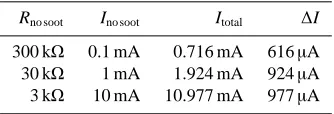
Table 2.Total current and current deviation∆I of a simulated
con-ductive layer (b=11µm thickness) with different electrical conduc-tivities.
Rno soot Ino soot Itotal ∆I
300 kΩ 0.1 mA 0.716 mA 616µA 30 kΩ 1 mA 1.924 mA 924µA 3 kΩ 10 mA 10.977 mA 977µA
Examples for the simulated total current, Itotal, and the
soot-related current deviation ∆I=Itotal−Ino soot for a blank
sensor and sensors with a conductive layer of b=11µm (see
Fig. 2c and d) are shown in Figs. 4 and 5 for three diff
er-ent electrical conductivities in a way that Rno sootcorresponds
to 3 kΩ, 30 kΩ, or 300 kΩ. Table 2 lists the numerical
val-ues. Figure 6 shows the magnification of Fig. 5 to extract the
initiation time ti for these four sensors at a trigger limit of
∆Itrigger=3µA.
The differences in the total current arise from the different
resistances of the conductive layers (as they depend on the cover layer materials conductivity and on the thickness of the cover layer), which add up to the resistance of the soot path. A low conductivity of the conductive layer yields high serial resistances, and therefore limits the current. It appears implausible at first glance that the current of the fully soot loaded but uncovered sensor (Fig. 4) should be higher than
the 300 kΩ-covered one. However, one has to consider that
the conductive layer (which in case of a 300 kΩlayer exhibits
poor conductivity) also covers the electrodes, prevents direct contact between soot and electrodes, and therefore limits the current.
The improvements that can be obtained with the
conduc-tive layers are summarized in Fig. 7. Here, (1−ti/tref)/%
indi-cates the percentaged reduction of the initiation time, ti, com-pared to the initiation time, tref, of the uncoated blank sensor.
0 5 0 1 0 0 1 5 0 2 0 0 2 5 0
0 , 0 0 , 2 0 , 4 0 , 6 0 , 8
Ω
3 0 k Ω
Δ
I / m A
t
s i m / a r b i t r a r y u n i t s
3 0 0 k Ω
1
2 3
Figure 5. Current deviation ΔI = Itotal - Ino soot, for coatings with base resistances (without soot) of 3 kΩ, 30 kΩ and 300 kΩ, compared to a blank sensor. For raw data see Fig. 4
0 2 5 5 0
0 1 2 3 4 5
t r i g g e r l i m i t
b l a n k s e n s o r
3 0 0 k Ω 3 0 k
Ω
3 9
3 k
Ω
5 2 3 3
Δ
I / µ A
t
s i m / a r b i t r a r y u n i t s 3 2
4
5 6
Figure 6. Magnification of Fig. 5 to determine the initiation time ti for coatings with different
base resistances (without soot).
20
Figure 6.Magnification of Fig. 5 to determine the initiation time,
ti, for coatings with different base resistances (without soot).
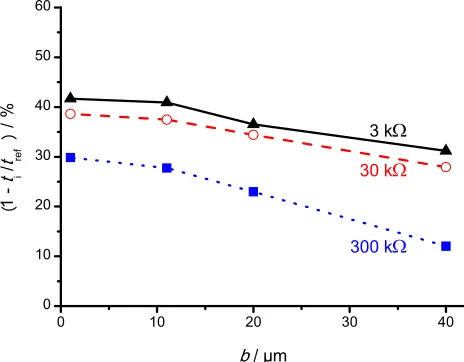
As shown by the simulations, an improvement of about 40 % should be possible.
Thin layers with a high conductivity show the best
perfor-mance, especially for the 1µm layer. Since such thin layers
with b<h (Fig. 2a and b) do not cover the electrodes, soot
can contact the electrodes directly without any limiting serial resistances between electrode and soot. However, the calcu-lated improvements in reduction of the blind time between
coatings of 1µm and 20µm thickness as well as with
coat-ings between a resistance of 3 kΩand 30 kΩ(for the data of
the sensor with respect to conductivity and film thickness, see Table 1) can be considered insignificant, so that the al-ready mentioned disadvantages of thin layers or low resis-tance without soot outweigh the slight advantages regarding the current signal. Considering an economical screen
print-ing process, typical layer thicknesses of 5µm or more can
be achieved. Hence, a functional layer with an electrical
re-sistance of 30 kΩ and a thickness of 5 to 20µm seems to
be a good tradeoffbetween improved measurement duration,
manufacturability and usability of inexpensive measurement equipment.
3 Experimental verification
In Sect. 2, the advantages of a conductive layer were worked out using simulation. In this section, we will describe exper-imental results and compare them with our simulations.
Experiments
P. Bartscherer and R. Moos: Improvement of the sensitivity of a conductometric soot sensor 99
0 1 0 2 0 3 0 4 0
0
1 0 2 0 3 0 4 0 5 0 6 0
3 k Ω 3 0 k
Ω
3 0 0 k
Ω
︵
1
-ti
/
tref
︶ / %
b / µ m
1
2
3
4
5
Figure 7. Simulated percentaged reduction of the initiation time t
ifor different layer
thicknesses and conductivities, see Table 1. t
refis the initiation time of the uncoated sensor.
6
7
8
9
Figure 8. Light optical microscope image of a soot loaded interdigital electrode structure. The
soot accumulates in form of percolation paths, growing from one electrode to the other.
Exhaust gas hit the sensor perpendicular to the surface and spread as indicated by the arrows.
21
Figure 7.Simulated percentaged reduction of the initiation time ti
for different layer thicknesses and conductivities, see Table 1. trefis
the initiation time of the uncoated sensor.
Figure 8 shows a typical IDE (without additional coating) during electrophoretic soot deposition. Electrically conduc-tive soot paths grow from one electrode to the other, resulting in an ohmic current (Ochs et al., 2012; Hagen et al., 2010). The initiation time, ti, i.e., the time the current needs to reach
a trigger limit (for instance a current of 3µA) can be used as
a measure for the amount of PM in the exhaust gas. After a
deposition cycle, the sensor is heated to above 600◦C to burn
the soot on the IDE. After cooling, the sensor is regenerated and the subsequent loading cycle can start.
To verify the results from the simulation and to proof the concept of improving the particle sensor by applying a con-ductive layer, a commercial resistor paste which is typically used in LTCC and thick-film technology, was applied
(Her-aeus, type R8281). It consists of RuO2embedded in a glass
matrix (for literature see, e.g., Pike and Seager, 1977, or Ni-coloso et al., 1995). The nominal square resistance
accord-ing to the data sheet was 100 MΩfor a fired film thickness
of 22µm. This leads to a conductivity of 0.45 mS m−1, which
is close to the optimum determined in the simulation. For the test sensor, this small deviation is not important, because even for a slightly deviating electrical conductivity, the re-duction of the initiation time should be significant. It should
be clarified that RuO2embedded is a glass matrix is a good
fabrication approach for thick-film resistors in electronics but it is not suitable to be applied in automotive exhausts at el-evated temperatures. It is known that RuO2-based materials show reversible as well as irreversible changes in resistance, depending on temperature, mechanical stress and electrical field (Pike and Seager, 1977). Since the temperature during regeneration can reach or even exceed the firing temperature
of the RuO2/glass layer, the glass matrix may soften each
time the soot is burned offat regeneration temperatures. This
may result in plastic deformation of the conductive layer that
0 1 0 2 0 3 0 4 0
0
1 0 2 0 3 0 4 0 5 0 6 0
3 kΩ
3 0 k Ω
3 0 0 k
Ω
︵
1 -ti / tref ︶ / %
b / µ m 1
2
3 4
5
Figure 7. Simulated percentaged reduction of the initiation time ti for different layer
thicknesses and conductivities, see Table 1. tref is the initiation time of the uncoated sensor.
6
7 8 9
Figure 8. Light optical microscope image of a soot loaded interdigital electrode structure. The soot accumulates in form of percolation paths, growing from one electrode to the other. Exhaust gas hit the sensor perpendicular to the surface and spread as indicated by the arrows.
21
Figure 8.Light optical microscope image of a soot loaded
interdig-ital electrode structure. The soot accumulates in form of percolation paths, growing from one electrode to the other. Exhaust gas hits the sensor perpendicular to the surface and spreads as indicated by the arrows.
changes the electrical characteristic. Furthermore, high
tem-peratures may affect the conductivity of RuO2 due to
oxi-dation and loss of volatile reaction products (Colomer and
Jurado, 1997). All these factors affect the conductivity of
RuO2-based resistor pastes and may lead to a drift of the sensor current that is not tolerable for a sensor that should operate for many years in the exhaust gas. However, in or-der to verify the concept, these shortcomings are not relevant and the already mentioned paste was selected despite all its disadvantages.
For the test sample, blank sensors were manufactured as described briefly above and in detail in Ochs et al. (2012). Some of the sensors were coated with the screen-printed
paste, dried for 10 min at 80◦C and fired at 850◦C according
to the manufacturer’s specifications. A fired film thickness of
about 35µm was obtained. The sensors were built into the
exhaust pipe of an artificial soot source (CAST2, Matter En-gineering) together with an uncoated blank sensor serving as
a reference. The gas stream was 5 L min−1 with an average
particle size of 85 nm. During soot deposition, the sensors
were not heated, i.e. soot collection occurred at about 35◦C.
Figure 9 shows a typical measuring cycle. At t1, the IDE voltage (30 V dc) was applied to determine a possible temperature-based drift of the sensor base signal. At t2, about 2 min later, the artificial soot source was switched on. After the current of both sensors (coated sensor and blank sensor)
exceeded the triggering limit (3µA) significantly, the
artifi-cial soot source was switched offat t3. At t4, the IDE voltage
was also switched offand shortly after that, the regeneration
was initiated (at t5). Using the applied heater, a temperature
above 750◦C was achieved and the collected soot was
oxi-dized. After turning offthe sensor heating at t6, the sensor
was allowed to cool down to a stable temperature before the subsequent cycle started.
100 P. Bartscherer and R. Moos: Improvement of the sensitivity of a conductometric soot sensor
0
1 0 0 2 0 0 3 0 0
t 6 t 5 t 4 t 3 t 2
b l a n k s e n s o r c o a t e d s e n s o r
I / µ A
t
/ s
t 1 r e g e n e r a t i o n r e g e n e r a t i o n 1 2 3 4
Figure 9. Typical measurement and regeneration cycle. t1: sensor voltage over the IDE is
applied, t2: artificial soot source is switched on, t3: artificial soot source is switched off, t4:
sensor voltage is switched off, t5 to t6: heater current for regeneration is applied.
1 8 0 0 1 9 0 0 2 0 0 0 2 1 0 0 2 2 0 0 2 8 5
2 9 0 2 9 5 3 0 0 3 0 5
0 5
1 0 1 5 2 0
3 µ A Icoa
t e d / µ A t
/ s
3 µ A A Iblan
k / µ A
t
2 tc r e ft
c o a t e d s e n s o r s e n s o rb l a n k
5
6 7 8 9
Figure 10. Raw signal for a coated (left axis) and an uncoated (right axis) sensor. The current drift for the coated sensor was compensated using linear extrapolation. The artificial soot source is switched on at t2. The coated sensor reaches the trigger limit of 3 µA at tc, the
uncoated sensor reaches the trigger limit at tref.
22
Figure 9.Typical measurement and regeneration cycle. t1: sensor
voltage over the IDE is applied, t2: artificial soot source is switched
on, t3: artificial soot source is switched off, t4: sensor voltage is
switched off, t5to t6: heater current for regeneration is applied.
yielded an increasing baseline. It was used to correct the
initi-ation time tcas depicted in Fig. 10. The coated sensor showed
a baseline of almost 300µA, which is equivalent to a
resis-tance of about 100 kΩin the soot-free state. Furthermore, the
coated sensor reached the trigger limit of ∆I≈3µA about
100 s earlier than the uncoated sensor, and, as predicted from the simulations, the coated sensor showed a smaller slope
dI/dt. This behavior can be explained by the serial resistance
of the conductive coating that reduces the contribution of the soot to the total current.
The very low (but not zero) current of the reference sen-sor before applying the soot source may originate from some soot that had been deposited between the feed lines during antecedent cycles (see Fig. 1). Since the sensor feeds are not heated, this part was not regenerated. However, this leakage current can be neglected.
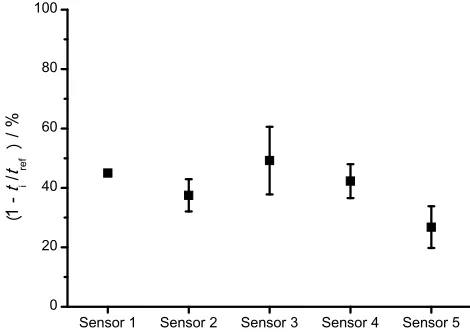
The tests were repeated with five different sensors with 1
to 5 cycles for each sensor. The results for each sensor with the standard deviation of the percentaged reduction of the initiation time are shown in Fig. 11. Despite not being op-timized, the initiation time with a conductive layer can be reduced by between 25 and 50 % compared to the uncoated sensor. The results are even slightly better than predicted by the simulations (25 to 40 %).
4 Concluding remarks
The simulations showed that the conductivity of a conduc-tive coating of the electrode area of a PM sensor greatly influences the sensor performance. Conductivity and layer thickness can be further optimized. On the one hand, higher conductivities are preferred because they reduce the current through the serially connected soot only a little. However, the benefit of a high conductivity gets smaller for higher
conduc-0
1 0 0 2 0 0
t 6 t 5 t 4 t 3 t 2
b l a n k s e n s o r
I / µ A
t
/ s
t 1 r e g e n e r a t i o n r e g e n e r a t i o n 1 2 3 4
Figure 9. Typical measurement and regeneration cycle. t1: sensor voltage over the IDE is applied, t2: artificial soot source is switched on, t3: artificial soot source is switched off, t4:
sensor voltage is switched off, t5 to t6: heater current for regeneration is applied.
1 8 0 0 1 9 0 0 2 0 0 0 2 1 0 0 2 2 0 0
2 8 5 2 9 0 2 9 5 3 0 0 3 0 5
0 5
1 0 1 5 2 0
3 µ A
Icoa t e d / µ A t
/ s
3 µ A A Iblan
k / µ A
t
2 tc r e ft
c o a t e d s e n s o r b l a n k s e n s o r
5
6 7 8 9
Figure 10. Raw signal for a coated (left axis) and an uncoated (right axis) sensor. The current drift for the coated sensor was compensated using linear extrapolation. The artificial soot source is switched on at t2. The coated sensor reaches the trigger limit of 3 µA at tc, the uncoated sensor reaches the trigger limit at tref.
22
Figure 10.Raw signal for a coated (left axis) and an uncoated
(right axis) sensor. The current drift for the coated sensor was com-pensated using linear extrapolation. The artificial soot source is switched on at t2. The coated sensor reaches the trigger limit of
3µA at tc, the uncoated sensor reaches the trigger limit at tref.
1
2
S e n s o r 1 S e n s o r 2 S e n s o r 3 S e n s o r 4 S e n s o r 5
0
2 0 4 0 6 0 8 0 1 0 0
︵
1 -ti / tref ︶ / %
Figure 11. Reduction of the initiation time due to coating, proven for five different sensors.
Figure 11.Reduction of the initiation time due to coating, proven
for five different sensors.
tivities. Comparing the simulated low and medium conduct-ing layers, an improvement of the initiation time of about 12 % can be obtained with a conductivity change of a factor of 10. Increasing further the conductivity of the layer by a factor of 10 yields an additional reduction of only about 2 %. Besides the sensor performance with respect to a shorter initiation time, system aspects as well as manufacturing pro-cess issues deserve consideration. How can such a conductive coating be applied, what electronic measurement equipment is needed? Both aspects may limit the application.
The conductive layers are preferably applied in thick-film technology. This technique is process compatible, inexpen-sive and well-known for ceramic exhaust gas sensors (Riegel
et al., 2002). Layer thicknesses between about 5 to 50µm can
be manufactured reliably. Thin film techniques like CVD or PVD are more expensive and are not preferred.
P. Bartscherer and R. Moos: Improvement of the sensitivity of a conductometric soot sensor 101
Cost issues of the measurement circuit play a crucial role. The higher the required resolution, the more expensive it will
be1. If the conductivity of the layer is too high, a 12 bit A/D
converter may not be sufficient due to the high base current
without soot. In case of the highly conducting coating, a reso-lution of 15 bit would be needed. For the medium
conductiv-ity, 12 bit would be sufficient and for the lowest conductivity
9 bit would suffice. With respect to the required resolution, a
low conductivity would be preferable.
As a tradeoff, medium conductive layers are considered
best. The demands on the A/D converters are moderate, and
the initiation time is short. A higher conductivity does not show a huge advantage regarding the initiation time, but will result in much higher cost of the measuring equipment. A
material with an electrical conductivity of 10−3to 10−1S m−1
would be suitable for a functional layer of 20µm thickness
and 12 bit resolution.
The functional demonstration with a RuO2-based coating showed even more potential to reduce the initiation time than expected from the simulation. But it also showed the
cur-rent limiting effect of a serial connection between soot and
functional coating. With a reduction of the initiation time of about 45 % with a non-optimized system, an even higher ef-fect can be expected by using an optimized material and coat-ing, therefore a continuation of these investigations seems promising.
A reduction in the initiation time enhances the accuracy of the sensor and therefore allows a much better prediction of the particle filter condition, meaning that smaller defects may be more reliably detected. However, it is challenging to find a material with a suitable electrical conductivity and the robustness to withstand the harsh conditions in automotive exhausts.
Recently, dosimeter-type resistive gas sensors are sug-gested for gas concentration measurements (Geupel et al., 2010; Groß et al., 2012). Both soot sensor and dosimeter-type resistive gas sensor rely on the same principle: with sorption of gas (or soot) the resistance changes and as soon as
sat-uration effects occur, sensor regeneration is required,
typi-cally induced by heating the sensitive film far above working temperature. Recently, Hennemann et al. (2012), even sug-gested a dosimeter-type gas sensor based on percolation
ef-fects. H2S percolation paths are formed on nanofibers leading
to a steep resistance decrease when a defined dose is applied. This behavior is very similar to the conductometric soot sen-sor where a defined amount of soot yields a similar behav-ior. It is suggested to transfer the idea of a conductive layer
1If one accepts a resolution for the A/D converter of 12 bit, than
the measuring range can be resolved in 212=4096 equidistant steps.
The steps should be about 10 times smaller than the value to be measured. Hence, a trigger limit of 3 A requires steps of at least 0.3µA. If the layer conductivity is too high, a 12 bit A/D converter may not be sufficient due to the high base current without soot.
also to such percolation-type conductometric dosimeter gas sensors.
Acknowledgements. The authors thank Ralf Schmidt, Frank
Rettig and Gerd Teike for discussions and their help on the simulation and model building, as well as Ulrich Hasenkox and Helmut Marx for the support during the measurements. The authors also thank Robert Bosch GmbH, where most of the work have been done, for supporting this work and for the permission to publish the results.
Edited by: A. Lloyd Spetz
Reviewed by: two anonymous referees
References
Adar, S. D., Klein, R., Klein, B. E. K., Szpiro, A. A., Cotch, M. F., Wong, T. Y., O’Neill, M. S., Shrager, S., Barr, R. G., Siscov-ick, D. S., Daviglus, M. L., Sampson, P. D., and Kaufman, J. D.: Air Pollution and the Microvasculature: A Cross-Sectional Assessment of In Vivo Retinal Images in the Population-Based Multi-Ethnic Study of Atherosclerosis (MESA), PLOS Med., 7, 1–11, 2010.
Alkemade, U. G. and Schumann, B.: Engines and exhaust after treatment systems for future automotive applications, Solid State Ionics, 177, 2291–2296, 2006.
Bartscherer, P. and Schmidt, R.: Sensor and method for detecting particles in a gas flow, Patent Application WO002008138659A1, 2008.
Bartscherer, P., Grabis, J., and Schmidt, R.: Verfahren zum Betrieb eines Partikelsensors, German Patent Application DE102007060939A1, 2007.
Bartscherer, P., Hasenkox, U., and Roesch, S.: Sensor for resistively determining concentrations of conductive particles in gas mix-tures, Patent Application WO002008025602A1, 2008.
Colomer, M. T. and Jurado, J. R.: Preparation and characterization of gels of the ZrO2-Y2O3-RuO2 system, J. Non-Cryst. Solids,
217, 48–54, 1997.
Duvinage, F., Nolte, A., Paule, M., Schommers, J., and Bruegge-mann, H.: Dieselpartikelfilter f¨ur PKW – gestern, heute und mor-gen, 10. Aachener Kolloquium Fahrzeug- und Motorentechnik, 2001.
Europ¨aisches Parlament: Verordnung (EG) Nr. 715/2007 ¨uber die Typgenehmigung von Kraftfahrzeugen hinsichtlich der Emis-sionen von leichten Personenkraftwagen und Nutzfahrzeugen (Euro 5 und Euro 6) und ¨uber den Zugang zu Reparatur-und Wartungsinformationen f¨ur Fahrzeuge, Amtsblatt der Eu-rop¨aischen Union, L171, 1–16, 2007.
European Union: Communication on the application and future de-velopment of Community legislation concerning vehicle emis-sions from light-duty vehicles and access to repair and mainte-nance information (Euro 5 and 6), Official Journal of the Euro-pean Union, 2008/C 182/08, 2008.
Evans, B. D.: A review of the optical properties of anion lattice vacancies, and electrical conduction in Al2O3: their relation to
Feulner, M., Hagen, G., Piontkowski, A., M¨uller, A., Fischerauer, G., Br¨uggemann, D., and Moos, R.: In-Operation Monitoring of the Soot Load of Diesel Particulate Filters – Initial Tests, Top. Catal., 56, 483–488, 2013.
Fischerauer, G., F¨orster, M., and Moos, R.: Sensing the Soot Load in Automotive Diesel Particulate Filters by Microwave Methods, Meas. Sci. Technol., 21, 035108, doi:10.1088/ 0957-0233/21/3/035108, 2010.
Fino, D.: Diesel emission control: Catalytic filters for particulate removal, Sci. Technol. Adv. Mat., 8, 93–100, 2007.
Geiser, M.: Distribution and Clearance of Inhaled Ultrafine TiO2
Particles in Rat Lungs, 9th ETH Conference on CGP, 2005. Geupel, A., Sch¨onauer, D., R¨oder-Roith, U., Kubinski, D. J., Mulla,
S., Ballinger, T. H., Chen, H.-Y., Visser, J. H., and Moos, R.: Integrating nitrogen oxide sensor: a novel concept for measuring low concentrations in the exhaust gas, Sensor. Actuat. B-Chem., 145, 756–761, 2010.
Grahame, T. J. and Schlesinger, R. B.: Cardiovascular Health and Particulate Vehicular Emissions: a Critical evaluation of the Evi-dence, Air Quality, Atmosphere and Health, 3, 3–27, 2010. Grob, B., Schmid, J., Ivleva, N., and Niessner, R.: Conductivity
for Soot Sensing: Possibilities and Limitations, Anal. Chem., 84, 3586–3592, 2012.
Groß, A., Beulertz, G., Marr, I., Kubinski, D. J., Visser, J. H., and Moos, R.: Dual Mode NOxSensor: Measuring Both the
Accumu-lated Amount and Instantaneous Level at Low Concentrations, Sensors, 12, 2831–2850, 2012.
Hagen, G., Feistkorn, C., Wieg¨artner, S., Heinrich, A., Br¨uggemann, D., and Moos, R.: Conductometric Soot Sen-sor for Automotive Exhausts: Initial Studies, SenSen-sors, 10, 1589–1598, 2010.
Harris, S. J. and Maricq, M. M.: Signature size distributions for diesel and gasoline engine exhaust particulate matter, Aerosol Science, 32, 749–764, 2001.
Hennemann, J., Sauerwald, T., Kohl, C.-D., Wagner, T., Bognitzki, M., and Greiner, A.: Electrospun copper oxide nanofibers for H2S dosimetry, Phys. Status Solidi A, 209, 911–916, 2012
Johnson, T. V.: Diesel emission control in review, SAE Paper 2007-01-0233, doi:10.4271/2007-01-0233, 2007.
Lloyd Spetz, A., Huotari, J., Bur, C., Bjorklund, R., Lappalainen, J., Jantunen, H., Sch¨utze, A., and Andersson, M.: Chemical sensor systems for emission control from combustions, Sensor. Actuat. B-Chem., doi:10.1016/j.snb.2012.10.078, in press, 2012.
Moos, R., Beulertz, G., Reiß, S., Hagen, G., Fischerauer, G., Votsmeier, M., and Gieshoff, J.: Overview: Status of the microwave-based automotive catalyst state diagnosis, Top. Catal., 56, 358–364, 2013.
Nicoloso, N., LeCorre-Frisch, A., Maier J., and Brook, R. J.: Con-duction mechanisms in RuO2-glass composites, Solid State
Ion-ics, 75, 211–216, 1995.
Ochs, T., Schittenhelm, A., Genssle, A., and Kamp, B.: Par-ticulate Matter Sensor for On Board Diagnostics (OBD) of Diesel Particulate Filters (DPF), SAE paper 2010-01-0307, doi:10.4271/2010-01-0307, 2010.
Otto, K., Sieg, M. H., and Zinbo, M.: The Oxidation of Soot Deposits from Diesel Engines, SAE paper 800336, doi:10.4271/800336, 1980.
Pike, G. E. and Seager, C. H.: Electrical properties and conduction mechanisms of Ru-based thick-film (cermet) resistors, J. Appl. Phys., 48, 5152–5169, 1977.
Riegel, J. and Klett, S.: Sensors for modern exhaust gas after-treatment systems. In: Proceedings of the 5th International Ex-haust Gas and Particulate Emissions Forum, Ludwigsburg, Ger-many, February 2008, 84–97, 2008.
Riegel, J., Neumann, H., and Wiedenmann, H.-M.: Exhaust gas sen-sors for automotive emission control, Solid State Ionics, 152– 153, 783–800, 2002.
Rose, D. and Boger, T.: Different Approaches to Soot Estimation as Key Requirement for DPF Applications, SAE paper 2009-01-1262, doi:10.4271/2009-01-1262, 2009.
Spears, M.: Particulate Matter and Adsorption: The First 100 Sec-onds, 5. Internationales Forum Abgas- und Partikelmesstechnik, Ludwigsburg 2008.
Twigg, M. V.: Progress and future challenges in controlling auto-motive exhaust gas emissions, Appl. Catal. B-Environ., 70, 2–15, 2007.
Twigg, M. V. and Phillips, P. R. Cleaning the air we breathe – Con-trolling diesel particulate emissions from passenger cars, Plat-inum Metals Review, 53, 27–34, 2009.