An Experimental Combined Objective and Subjective Investigation
of Thermal Comfort Perception in a Non-Air-Conditioned Lyceum
School Building
Eleni Papazoglou1, Konstantinos P. Moustris2*, Konstantinos-Stefanos P. Nikas3,
Panagiotis T. Nastos4 and John C. Statharas5
1Laboratory of Fluid Mechanics, Mechanical Engineering Department, Piraeus University of Applied Sciences, 250 Thivon and P. Ralli Str., GR-12244 Athens, Greece, eleniglou76@gmail.com 2Laboratory of Fluid Mechanics, Mechanical Engineering Department, Piraeus University of Applied
Sciences, 250 Thivon and P. Ralli Str., GR-12244 Athens, Greece, kmoustris@puas.gr 3Laboratory of Fluid Mechanics, Mechanical Engineering Department, Piraeus University of Applied
Sciences, 250 Thivon and P. Ralli Str., GR-12244 Athens, Greece, ksnikas@puas.gr
4Laboratory of Climatology and Atmospheric Environment, Faculty of Geology and Geoenvironment, University of Athens, Panepistimiopolis Camp, GR-15784 Athens, Greece, nastos@geol.uoa.gr 5Aircraft Engineering Department, Technological Educational Institution (TEI) of Sterea Ellada,
GR-34400 Psachna, Greece, stath@teihal.gr, stath@teiste.gr
*Corresponding Author: kmoustris@puas.gr
Abstract
The Predicted Mean Vote (PMV) and the Predicted Percentage of Dissatisfied (PPD) indices are used to assess the indoor environment in terms of human thermal comfort-discomfort. In this study, an experimental combined objective and subjective investigation of thermal comfort perception has been performed in students between 16-18 years old, in a non-air-conditioned school building. The objective approach included instrumentation measurements and data processing according to ISO 7730, whereas, the subjective one was based on answers collection following ISO 10551. The study is mainly devoted to the verification of Fanger’s approach in a building, in free running conditions, under a mild (moderate) climate.
The comparison between instrumentation data and questionnaire results presented an underestimation of the mean vote, predicting a cooler sensation than the actual one.
Keywords: human thermal comfort-discomfort; Fanger’s model; PMV; PPD
1. Introduction
Indoor environmental quality, consisting of visual, acoustic, thermal and air quality is important in terms of energy saving in buildings and occupants’ productivity.
Fanger (1970) developed a model for the thermal comfort assessment of an air-conditioned environment, in moderate climatic conditions [1]. The model included the PMV index determination, which predicts the expected mean vote of the occupants on a 7-point ASHRAE scale [2]. A related PPD index predicts the percentage of the occupants dissatisfied [1]. The Fanger’s model is assumed to work under minor variations of the physical variables in time, so that to be considered as steady-state model.
experience of the occupants, ranging from 0.5 up to 1, that multiplies PMV and b) the activity level factor, based on the unconscious reduced activity of people, who feel warm in an environment.
Another approach, with better performance on naturally ventilated buildings, is the development of the adaptive model, accepted in ASHRAE 55 [4] and ISO 7730 [5]. Unlike the Fanger’s model, which assumes no possibility of controlling the environment, the adaptive model considers the user interaction including his behavior adjustment, physiological and psychological factors. The adaptive model is based on the mathematical correlation between neutral indoor temperature and multi-day averaged outdoor one.
In school buildings, the relationship between thermal comfort and students’ performance with regard to attention, concentration and learning has been firstly studied by Pepler and Warner (1968), who concluded to the optimum temperature for best performance [6]. Thereafter, a lot of studies have been conducted on school buildings, especially, the last five years, due to the buildings' energy efficiency awareness and thermal comfort importance. These studies are either based on subjective (questionnaires) and/or objective (experimental instrumentation) surveys. The survey duration varies from less than a week up to a whole year [7-11] and corresponds to different architectural construction, in terms of material properties, window to wall ratio, shadings, etc.
The number of responders varies from 28 [7] to 4000 [12], in subjective type surveys, as by Mishra and Ramgopal [13], there is not any specific requirement for a minimum number. Questionnaires, usually, ask for thermal sensation and preference, including a 7-point ASHRAE scale.
On the other hand, objective surveys include measurements and recording of air temperature, air velocity, relative humidity and radiant temperature. Two more parameters, clothing level (clo) and metabolic rate (met) are also gathered, so that to calculate the PMV index [12], [14-16].
The aim of the present study is to obtain the students thermal comfort perception by comparing questionnaire results of actual mean vote (AMV) and percentage dissatisfied (PD) according to Fanger’s model and has been conducted, in a school building.
2. Results and Discussion
ASHRAE Standard 55-2004 defines Draft as “unwanted local cooling of the body caused by air movement”. ASHRAE Standard 55-2004 further defines a metric which quantifies Draft in terms of what percentage of occupants will be dissatisfied with a space due to annoyance by the local Draft conditions. This “predicted percentage of people dissatisfied due to annoyance by draft” is called the Draft Rate [17].
The Operative Temperature is defined as a uniform temperature of a radiantly black enclosure in which an occupant would exchange the same amount of heat by radiation and convection as in the actual non uniform environment [18]. Furthermore, turbulence can be thought of as fluctuations in air flow. A steady flow of air would have low turbulence. An unsteady flow of air would have higher turbulence. But what is the meaning of “low” and “higher” turbulence? In this sense, Turbulence Intensity
Is a uniform measurement scale which is needed in order to describe the “low” or the “high” turbulence in air flow [19].
Table 1: ComfortSense Results
Operative Temperature
(oC)
Mean Radiant Temperature
(oC)
Predicted Mean
Vote
Predicted Percent of Dissatisfied
(%)
Velocity (m/s)
Turbulence Intensity
(%)
Temperature (oC)
Draught Rate
(%)
17.37 17.67 -1.72 62.66 0.15 34.68 17.11 20.14
17.44 17.88 -1.77 65.32 0.17 28.48 17.11 22.04
18.52 18.62 -1.32 41.11 0.12 29.14 18.41 13.62
19.13 19.21 -1.12 31.22 0.11 52.75 19.06 14.42
19.57 19.52 -0.97 24.75 0.11 54.17 19.62 12.87
19.64 19.85 -0.98 25.47 0.12 26.13 19.44 11.66
19.72 19.91 -1.07 28.98 0.15 19.07 19.57 14.75
19.91 19.81 -0.87 20.87 0.11 49.25 20.02 12.87
20.03 19.90 -0.79 18.11 0.08 67.99 20.17 8.12
20.29 20.18 -0.76 17.31 0.12 34.02 20.40 11.60
20.28 20.07 -0.79 18.29 0.13 33.33 20.47 12.74
20.29 20.04 -0.78 17.84 0.12 47.82 20.53 14.30
20.21 20.05 -0.84 19.89 0.14 29.74 20.35 13.70
20.13 20.08 -0.83 19.47 0.13 37.65 20.19 13.89
20.07 20.17 -0.90 22.14 0.14 22.62 19.98 13.98
20.10 20.33 -0.88 21.20 0.14 24.01 19.88 13.53
20.17 19.92 -0.84 19.74 0.14 58.34 20.39 17.97
20.11 19.93 -0.73 16.16 0.09 40.80 20.30 8.49
The mean radiant temperature is defined as the uniform temperature of a hypothetical spherical surface surrounding the subject that would result in the same net radiation energy exchange with the subject as the actual, complex radiative environment [20]. The mean radiant temperature is calculated automatically, by the ComfortSense software, according to the following formula (1):
TO = ATA + (1.0 − A) ∙ MRT (1)
where, (TO) is the Operative temperature, (TA) is the air temperature, (MRT) is the mean radiant temperature and (A) is a parameter estimated from the relative air velocity, as per Table 2.
Table2: Estimation of A parameter for mean radiant temperature calculation
Velocity (m/s) <0.2 0.2-0.6 >0.6
A 0.5 0.6 0.7
Table 3: Probes last measurement
Probe TAG (m) X (m) Y (m) Z Velocity (m/s) Turbulence Intensity (%)
Temperature
(oC) Rate (%)Draught
Relative Humidity
(%)
Operative Temperature
(oC)
Velocity 0.00 1.3 0.00 0.09 40.80 20.30 8.49
-Humidity 0.00 2.3 0.00 - - - - 70.40
-Operative Temperature
0.00 1.2 0.00 - - - 20.11
The answers at the first question of the questionnaire “What kind of temperature change would you prefer during your presence at the hall?” are used to determine the PMV index. The resulting answers are presented in Table 4.
Table 4: Thermal comfort sensation subjective judgment results
Cold
(-3) Cool (-2) Cool (-1) Slightly Neutral (0) Warm (+1)Slightly Warm (+2) (+3) Hot Total AMV PD
0 1 3 6 7 2 0 19
0.00% 10.53% 36.84% 31.58% 15.79% 5.26% 0.00% 100%
-0.32 7.07%
The answers at the second question of the questionnaire “What kind of temperature change would you prefer during your presence at the hall?” describe the preferred conditions of the students in the hall and are presented in Table 5.
Table 5: Thermal comfort preferred
Cold (-3)
Cool (-2)
Slightly Cool (-1)
Neutral (0)
Slightly Warm (+1)
Warm (+2)
Hot
(+3) Total AMV PD
0 2 7 5 5 0 0 19
0.00% 0.00% 26.32% 26.32% 36.84% 10.53% 0.00% 100%
0.32 7.07%
According to ISO 10551 [23], the AMV (PMV) index is calculated by the arithmetic mean of the questionnaire results divided by the number of votes, as per equation (2):
AMV =∑ Q ∙ n
∑ n (2)
where: (Q) is the value representing questionnaire vote (-3, -2…+3), k and (n) is the number of students answered at the questionnaire, j.
According to Annex B of ISO 10551 [23], the AMV (PMV) value is used to calculate PD index, as per equation (3):
PD = 100 − 95e( . . ) (3)
A comparison between the datalogger PMV, and the questionnaire AMV and PD indices at the time of questionnaires submission is presented in Table 6.
PMV AMV PMV-AMV Difference PPD (%) (%) PD
Difference PPD-PD
(%)
-0.73 -0.32 -0.41 16.16 7.07 9.09
A graphical representation of the PMV indexes measured and obtained for students as well as for the teacher is illustrated in Figure 1.
Figure 1: PVM -AMV votes
Data from the questionnaire and the measurements are further processed in a spreadsheet.
The comfort votes’ statistical distribution from both the questionnaire as well as from the measurements is illustrated in Figure 2.
The processes results show that most of the students were feeling slightly cool in the classroom. However, the difference between measurements and questionnaire results are quite different.
Finally, the environmental conditions in the hall do not meet the limit values suggested by the ASHRAE 55-2013 standard, as illustrated in Figure 3.
Figure 3: Environmental and optimum conditions by ASHRAE 55 and EN15251 (Berkeley University)
By observing the acquired data on Table 1, all PMV values are negative throughout the whole measurements period. The lowest PMV values correspond to the beginning of the measurements session. By the time, PMV values are increasing reaching the value of -0.73 at the time of questionnaires distribution.
This may be explained by the fact that the hall was empty and closed before students enter and measurements start. Due to the high density of students (100 students approximately) occupying the hall during the measurement period, the environmental temperature increased by almost 3°C, causing a more comfortable thermal sensation, reflected to the PMV values. Moreover, the PMV index obtained for the teacher is 0.05 which corresponds to a slightly warm sensation, due to the greater metabolic activity set to 1.6 instead of 1.2 for the students.
The quite high relative humidity 70%, found in the hall (Table 3), is a consequence of the lack of space heating regularly, since the hall is not daily but rarely used, combined with the outdoor climate conditions of the winter season.
The average draught rate, which expresses the percentage of people predicted to be bothered by draught, is found to be around 14% by the data in Table 1.
With reference to the questionnaire results, the calculated absolute values of AMV judgment in Table 4 and preferred one in Table 5 are in consistency since both are found to be +/-0.32, which indicates that students had a good understanding of the thermal comfort perception, answering reasonably at the questionnaires. According to the findings, students felt slightly cool in the classroom and preferred a slightly warmer environment. According to the answers, the dissatisfied people in the hall were only 7.07%.
Another important consideration of the comparison between data logger and questionnaire results is the votes’ distribution in Figure 2. Results concerning AMV votes are scattered over the 7-point scale and more precisely among five regions (from slightly warm to slightly cool) whereas data logger results are concentrated in slightly cool and cool regions only. The observation is explained by the fact that the data logger results concern the whole measurement period whereas, the questionnaires were distributed at the end of the measurements period, when the hall was warmer by 3oC as mentioned above. Adolescents might have filled in the questionnaire according to their instantaneous thermal perception rather than accounting the whole measurements period.
Finally, the environmental conditions in the hall do not meet the criteria set neither by the ASHRAE 55-2013 standard nor by EN 15251, for having environmental conditions considered as acceptable for general thermal comfort, as illustrated in Figure 3. The air temperature has to increase to 22°C from 20.3°C (which corresponds to the last measurement), remaining all other parameters constant in order to achieve the ASHRAE 55 compliance for thermal comfort. With reference to EN 15251, the air temperature must be increased by only 0.4°C to meet the requirements for thermal comfort.
3. Materials and Methods
The present study has been conducted, in a school building, to underage people and its aim is to obtain their thermal comfort perception by comparing questionnaire results of actual mean vote (AMV) and percentage dissatisfied (PD) according to Fanger’s model with datalogger measurements, processed according to EN ISO 7730 for PMV and PPD indices and then to analyze their differences. The use of questionnaires constitutes a qualitative and subjective approach of thermal comfort, whereas the measurements constitute a quantitative and objective one, based on EN ISO 7730 standard. Moreover, the environmental conditions in the environment have been assessed for their compliance with ASHRAE 55-2013 and EN 15251 standards, of acceptable general thermal comfort.
Questionnaire: A simple questionnaire was distributed to the students. The questionnaire used for obtaining the subjective judgment included two simple questions, formulated according to the recommendations of ISO 10551 standards [21]. The first one referred to the AMV and PD indices: “What is your perception of the environmental temperature during your presence at the hall?”. The answer to this question was a seven point scale, varying from very hot (+3), hot (+2), warm (+1), neutral (0), cool (-1), cold (-2) up to very cold (-3).
The second question referred to the adaptive thermal comfort: “What kind of temperature change would you prefer during your presence at the hall?”. The answers included the same 7-scale judgment, as above.
Personal information covering the age and sex of the responders was also gathered. The questionnaires were distributed to 19 students after 90min from the lecture start, while the physical parameters were recorded.
The measurement set up included different probes for acquiring the main physical variables:
• An air temperature and omni-directional velocity probe • a relative humidity probe and
• an operative temperature probe
All probes have been mounted on a suitable stand, in a point layout pattern, as illustrated in Figure 4.
Figure 4: Probes stand with datalogger and software
Air speed and temperature were measured at height of 1.3m above the ground, whereas operative temperature was measured at a height 1.2m, with the probe clamped at 30° from the vertical, simulating a sitting person. Relative humidity was measured at 2.3m above the ground. The measurement set-up was arranged so that it could determine PMV/PPD and draughts at the neck.
The whole work station has been positioned almost at the centre of the hall, replacing a room chair and thus, measurements were performed in a single point, as illustrated in Figure 5.
Figure 5: Lecture hall before and during measurements
students’ arrival. The number of students present in the lecture hall was 100 approximately, however 19 of them filled in the questionnaire.
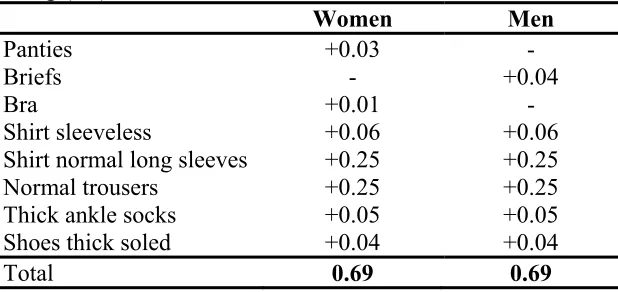
Since thermal sensation is affected by clothing, a value of the “clo” parameter was estimated according to ISO 7730, assuming a uniform level of clothing for the average of the students, as illustrated in Table 7.
Table 7: Clothing (clo) level calculation
Women Men
Panties +0.03 -
Briefs - +0.04
Bra +0.01 -
Shirt sleeveless +0.06 +0.06
Shirt normal long sleeves +0.25 +0.25
Normal trousers +0.25 +0.25
Thick ankle socks +0.05 +0.05
Shoes thick soled +0.04 +0.04
Total 0.69 0.69
The mean “clo” level was found to be 0.69. However, it has to be mentioned that some of the adolescents were lightly dressed with sleeveless T-shirt and others were wearing a jacket. Thermal insulation from the wooden seat (0 clo) does not contribute to the total “clo” value. The level of metabolic activity chosen was that of sedentary one at a school, equal to 1.2. For the case of teachers, the metabolic activity is slight higher and equal to 1.6. Both “clo” and “met” parameters were setup through the software, before the measurements start.
The case study:The secondary education school “2nd Lyceum of Gerakas” is located in Gerakas, a north-east suburb of Athens, lying between the mountains Hymettus and Pendeli (Figure 6) and is about 250m above sea level. The climate of Gerakas area is characterized “Mediterranean”, with mild winters and dry summers. The warm dry season lasts from late May to mid-September. Rainfall occurs mainly during November and January, as well as snowfall. The mean annual temperature is 19.1°C, with August being the warmer month, when the temperature reaches 27°C and February the coolest one at 1.9°C. The minimum average relative humidity is observed in July and the peak in December.
Figure 6: 2nd Lyceum of Gerakas (left panel) and the position of Gerakas municipality within the urban greater Athens area (right panel)
4. Conclusions
The aim of the present work was the objective and subjective investigation of thermal comfort perception in a non-air-conditioned lyceum school building. For this purpose, an experimental study which was accompanied by a subjective questionnaire survey was done. Results showed that the subjective feeling of human thermal comfort-discomfort in an indoor environment, can be measured using the appropriate experimental equipment in a significant good level. Furthermore, Authors believe that future combined works concerning human thermal comfort-discomfort, indoor air quality and noise pollution are needed in order to analyze the indoor environment of a building from energy save and human health care perspective.
References
1. Fanger, P.O. Thermal comfort. Danish Technical Press: Copenhagen, 1970.
2. American Society of Heating Refrigerating and Air Conditioning Engineers. ASHRAE handbook: fundamentals. Atlanta, GA USA: ASHRAE, 2009. Available online (09/11/2016):
http://shop.iccsafe.org/media/wysiwyg/material/8950P217-toc.pdf
3. Fanger, P.O.; Toftum, J. Extension of the PMV model to non-air-conditioned buildings in warm climates. Energ Buildings, 2002, 34, pp. 533-536.
4. American Society of Heating, Refrigerating and Air-Conditioning Engineers. Thermal Environmental Conditions for Human Occupancy. ASHRAE 55:2013, N.E. Atlanta, USA, 2014. Available online (18/10/2016):
file:///C:/Documents%20and%20Settings/USER/%CE%A4%CE%B1%20%CE%AD %CE%B3%CE%B3%CF%81%CE%B1%CF%86%CE%AC%20%CE%BC%CE%B F%CF%85/Downloads/55_2013_b_20141209.pdf
5. ISO 7730. Ergonomics of the thermal environment--analytical determination and interpretation of thermal comfort using calculation of the PMV and PPD indices and local thermal comfort criteria. International Standardization Organization, Geneva, Switzerland, 2005. Available online (18/10/2016):
http://www.iso.org/iso/catalogue_detail.htm?csnumber=39155
6. Pepler, R.D.; Warner, R.E. Temperature and learning: an experimental study. ASHRAE Trans, 1968, 74, pp. 211-219.
8. Yao, R.; Li, B.; Liu, J. (2209). A theoretical adaptive model of thermal comfort-Adaptive Predicted Mean Vote (aPMV). Build Environ, 2009, 44, 10, pp. 2089–2096. 9. Li, M.; Cao, B.; Zhu, Y. Indoor thermal comfort Survey in campus buildings in Beijing for a long time, in Counting the cost of comfort in a changing world. Proceedings of Windsor Conference, London, UK, 10th-13th April 2014.
10. Carvalho, P.M.; Silva, M.G.; Ramos, J.E. Influence of weather and indoor climate on clothing of occupants in naturally ventilated school buildings. Build Environ, 2012, pp.1–9.
11. Mishra, A.K.; Ramgopal, M. A thermal comfort field study of naturally ventilated classrooms in Kharagpur, India. Build Environ, 2015, 92, pp. 396-406.
12. d'Ambrosio Alfano; F.R.; Ianniello, E.; Palella, B.I. PMV–PPD and acceptability in naturally ventilated schools. Build Environ, 2013, 67, pp. 129-137.
13. Mishra, A.K.; Ramgopal, M. Field studies on human thermal comfort-An overview. Build and Environ, 2013, 64, pp. 94-106.
14. Corgnati, S.P.; Filippi, M.; Viazzo, S. Perception of the thermal environment in high school and university classrooms: Subjective preferences and thermal comfort. Build and Environ, 2007, 42, pp. 951-959.
15. Corgnati, S.P.; Ansaldi, R.; Filippi, M. Thermal comfort in Italian classrooms under free running conditions during mid seasons: Assessment through objective and subjective approaches. Build and Environ, 2009, 44, pp. 785-792.
16. Nico, M.A.; Liuzzi, S.; Stefanizzi, P. Evaluation of thermal comfort in university classrooms through objective approach and subjective preference analysis. Appl Ergon, 2015, 48, pp. 111-120.
17. Airflow Instruments, TSI Instruments Ltd. Draft Rate: A Determining Factor in the Quantification of Human Comfort. Application Note AF-142 (A4), 2014, UK. Available online (accessed on 20/12/2016):
http://www.tsi.com/uploadedFiles/_Site_Root/Products/Literature/Application_Notes/ AF-142%20Draft%20Rate.pdf
18. Kazkaz, M.; Pavelek, M. Operative Temperature and Globe Temperature. J Eng Mech, 2013, 20, pp. 319-325.
19. TSI, Precision Measurements Tools. Turbulence Intensity Measurement Models: 9555, 9565, 7565, 7575, TA460, TA465, EBT730, PH730, 8715. Application Note TSI-141, 2012, USA. Available online (20/12/2016):
http://www.tsi.com/uploadedFiles/_Site_Root/Products/Literature/Application_Notes/ TSI-141-A4.pdf
20. Matzarakis, A.; Rutz, F.; Mayer, H. Modelling radiation fluxes in simple and complex environments e application of the RayMan model. Int J Biometeorol, 2007, 51, pp. 323-334.
21. ISO 10551. Ergonomics of the thermal environment e assessment of the influence of the thermal environment using subjective judgement scales. Geneva: International Standardization Organization, 1995. Available online (accessed on 15/12/2016):
http://www.iso.org/iso/catalogue_detail.htm?csnumber=18636