R E S E A R C H
Open Access
Multi-scale contrast and relative
motion-based key frame extraction
Naveed Ejaz
1, Sung Wook Baik
2, Hammad Majeed
3, Hangbae Chang
4and Irfan Mehmood
2*Abstract
The huge amount of video data available these days requires effective management techniques for storage, indexing, and retrieval. Video summarization, a method to manage video data, provides concise versions of the videos for efficient browsing and retrieval. Key frame extraction is a form of video summarization which selects only the most salient frames from a given video. Since the automatic semantic understanding of the video contents is not possible so far, most of the existing works employ low level index features for extracting key frames. However, the usage of low level features results in loss of semantic details, thus leading to a semantic gap. In this context, the saliency-based user attention modeling technique can be used to bridge this semantic gap. In this paper, a key frame extraction scheme based on a visual attention mechanism is proposed. The proposed scheme builds static visual attention method based on multi-scale contrast instead of usual color contrast. The dynamic visual attention model is developed based on novel relative motion intensity and relative motion orientation. An efficient fusion scheme for combining three visual attention values is then proposed. A flexible technique is then used for key frame extraction. The experimental results demonstrate that the proposed mechanism provides excellent results as compared to the some of the other prominent techniques in the literature.
Keywords: Key frame extraction, Video summarization, Visual saliency, Visual attention model, Fusion mechanism, Video summary evaluation
1 Introduction
The amount of video data on the internet is increasing day by day primarily because of increased processing power, faster networks, cheaper storage devices, and rapid devel-opment in digital video capture and editing technologies [1]. In order to prevent the potential users of the videos from being inundated by this huge collection of videos, efficient techniques for indexing and video retrieval are needed. Video summarization is a method of generat-ing summarized versions of the videos by extractgenerat-ing only the significant portions of the video [2]. The primary application of video summarization include ease in brows-ing and retrieval. Moreover, video summaries are also used as a pre-processing steps in many video processing
*Correspondence:[email protected]
This submission is intended for the Special Issue onReal-time Image and Video Processing in Embedded Systems for Smart Surveillance Applications
2Department of Software, Sejong University, Seoul, South Korea
Full list of author information is available at the end of the article
applications. The two basic types of video summariza-tion are key frame extracsummariza-tion and video skimming. The key frames or representative frames are a collection of salient frames of a given video sequence. Video skims are a collection of significantly shorter duration video seg-ments extracted from the original video. In this paper, the focus is towards summarizing videos in the form of key frames.
Ideally, video summarization techniques must utilize the high level semantic details of the video content. How-ever, it is currently not feasible to generally extract seman-tic primitives (relevant objects, actions, events) from the videos. Most of the techniques in the literature are there-fore either domain specific [3, 4] or directly employ low level index features [5,6]. However, the usage of low level features is inherently associated with the loss of semantic details, thus creating a big semantic gap. In this context, some authors [7–10] use visual attention model-based schemes to bridge the semantic gap. The visual attention
model-based approaches provide a compromise between the usage of low level features and the impractical high level features. The basic assumption in such techniques is to extract those frames as key frames which are visually important for humans based on visual attention mod-els. In this way, the semantic details of the videos can be approximated in a better way as compared to the low level features.
In this paper, a visual attention-based mechanism for extracting key frames from the videos is proposed. The framework develops efficient visual saliency-based static and dynamic attention models and then combines them using a proposed non-linear weighted fusion mecha-nism. The proposed scheme has been compared with four prominent schemes in the literature [11–14]. The results demonstrate that the proposed visual attention model framework is more accurate as compared to the techniques to which it is compared.
The major contributions of this paper includes the following:
• The design of a complete and consistent framework for key frame extraction using static and dynamic visual attention clues and the non-linear fusion mechanism.
• The relative motion intensity and relative motion consistency visual attention features are proposed.
• A new non-linear scheme for integration of visual attention features is proposed.
The rest of this paper is organized as follows. Section2 provides a brief review of the existing techniques for key frame extraction. Section 3 describes the proposed framework. The experiments and results are discussed in Section4. Finally, Section5concludes the paper.
2 Related Work
The researchers have addressed the problem of video summarization from various perspectives. The taxonomy and review of prominent video summarization techniques can be found in [1,2].
There are some classification-based supervised meth-ods. The prominent supervised methods of video sum-marization includes category-specific classification for scoring importance [15, 16], learning to detect infor-mative and varying subsets from videos using human-generated summaries [17, 18], and learning using facets (hands, faces, objects, etc.) [19, 20]. As it might be expected, the performance of supervised methods are heavily dependent on training data which is generally not easily available. The user annotation of the training data set may also include some bias.
The unsupervised methods mostly employ low level visual features in various strategies including clustering ([14, 21], interest prediction [17], maximal bi-clique
finding [22], and energy minimization [23]). The usage of sparse coding-based techniques have also been used for video summarization by exploiting sparsity and recon-struction error [24–27]. The global comparison-based techniques use global differences between frames to extract key frames by minimizing some objective func-tion. Sequence reconstruction error [28,29] and fidelity criterion [30] are the popular objective functions used. The limitation of most of the low level feature-based methods is that there is no clearly defined relationship between low level features and human perception of the salient frames, and thus, high level semantic concepts are lost, creating a semantic gap.
static and dynamic visual attention measures are fused by using a non-linear weighted fusion method. The usage of approximated static and dynamic visual attention mod-els improves efficiency but is likely to effect the quality of summarization.
In all of the above schemes, the motion magnitude based on motion vectors of a frame are utilized for find-ing out the frames with high level of motion. However, the proposed relative motion intensity feature employs the relative motion magnitude values of two neigh-boring frames for computation of saliency value. Ma et al. [7] used entropy-based motion consistency mea-sure which takes into account the direction of motion vectors of a single frame. Unlike Ma et al. [7], our relative motion consistency-based scheme is based on variance and employs the motion variance of the neigh-boring frame for calculation of variance. In most of the existing schemes, the fusion of features was done lin-early which is inadequate. We propose a simple fusion scheme that better reflects the human perception of fusing features.
3 Methodology
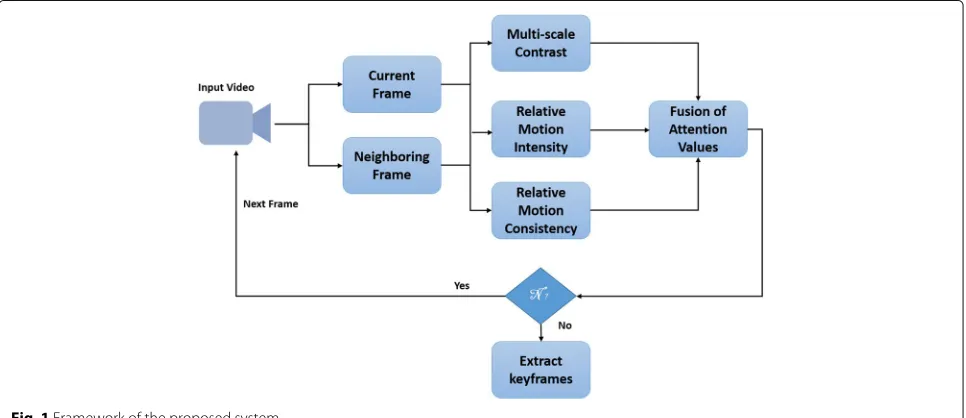
The proposed framework is based on the notion of visual attention modeling. Attention is a neurobiological con-cept which denotes the concentration of mental pow-ers upon certain areas by close observation [31]. Visual saliency of a region measures the extent to which it is different from its neighborhood. It is believed that visual saliency highlights the regions which attract visual atten-tion of human beings or which are interesting for humans [31]. Figure1shows the main steps of the proposed frame-work. Each of these steps is described in subsequent sub-sections.
3.1 Multi-scale color contrast
The contrast measures the distinctiveness of a region from its environment. The contrast has been widely used for modeling visual attention because the human perception system is known to react to the contrast of visual signals [31]. The contrast value of a pixel is usually computed by calculating the sum of differences of a visual signal with the neighboring pixels. We used the multi-scale con-trast [31,32] for the computation of contrast value at each pixel. The multi-scale contrast is computed on RGB color channels at various scales of Gaussian image pyramid levels.
The contrast value of a color channelcof a pixelpin frame F at a particular scale l of Gaussian pyramid is defined as:
Clc(F,p)=
q∈N(p)
Fcl(p)−Fcl(q)2, c=red, green, blue (1)
where N(p) is the 9 × 9 neighborhood around pixel p, Fcl(p)is the value of color channelcat pixelpof frameFat levell. The contrast values of each pixel for the three color channels are then added to get the overall contrast value of pixelpat scalel.
Cl(F,p)=Clred(F,p)+Clgreen(F,p)+Clblue(F,p) (2)
The resultant contrast value at each pixel is then nor-malized in the range of [ 0, 1] by dividing the value of each pixel by the maximum contrast value in the frame. The multi-scale contrast value at a pixel is then computed by linear combination of contrasts at various scales of a Gaussian pyramid.
C(F,p)=
L
l=1
Cl(F,p) (3)
The number of levels in the Gaussian pyramidLis taken as 6. The value at each pixel is normalized to the range of [0, 1] by dividing each value by the maximum value to obtain a multi-scale contrast saliency map. The aver-age of all non-zero values in the multi-scale color contrast saliency map is then taken as multi-scale color contrast attention valueC(F)of frameF.
There are multiple benefits of using multi-scale contrast over simple image contrast:
• The computation of contrast at multiple scales helps in locating the salient object in the frame even if the salient objects vary in size,
• It has been asserted in a study by Toet [31] that multi-scale contrast-based visual saliency correlates well with the human perception of visual attention as compared to simple contrast,
• The strength rendered by the usage of multi-scale contrast eliminates the need of using any other static visual saliency model.
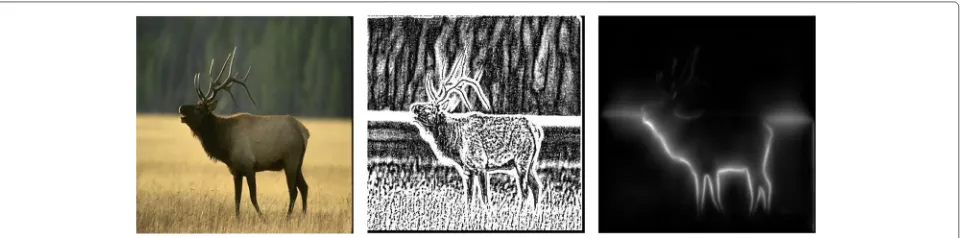
A visual comparison of multi-scale contrast and simple contrast saliency maps [7] is shown in Fig. 2. It is clear that multi-scale contrast outperforms simple contrast by clearly identifying only the salient object in the scene.
3.2 Dynamic features
In static images, the saliency maps are indexed on image regions, whereas in dynamic scenes, humans focus both on objects and their motion [31]. Moreover, the relative motion among objects is also important in user attention modeling. Therefore, in videos, motion is an important factor in building human attention model. Because of this importance of motion, two different descriptors based on relative motion strength and relative motion direction have been proposed for building saliency maps. For com-putation of these maps, first, the motion vector field (M)
is computed using the Lucas Kanade Algorithm [33]. The resultant motion vectors are then used to compute the two descriptors called relative motion intensity and relative motion consistency.
3.2.1 Relative motion intensity
In most of the previous works, the motion intensity was directly used as a visual attention feature. IfMx(p) and
My(p)represent thexandycomponent of the motion
vec-tor of current frameF with reference to previous frame, the motion intensity at pixelpis given as:
I(F,p)=
M2
x(p)+M2y(p) (4)
In this paper, instead of using motion intensity directly, the notion of relative motion intensity has been introduced. For videos, the relative motion intensity is expected to be more relevant than the absolute motion intensity.
For the calculation of relative motion intensity-based attention measure, the motion intensity of a frame is computed using Eq. (4). Next, the frame is divided into non-overlapping blocks of size 9×9. The human beings tend to focus more towards center of an image. There-fore, a weightαis defined in such a way that the blocks near to the center of the frame are assigned higher weight as compared to the blocks that are far from the center of the frame. For this purpose, the distance of each block with the center of the frame is computed. This distance measure is used to define weight α in such a way that the weight value is higher if the distance between a given block center with the center of the frame is less and vice versa. Ifdmaxrepresents the maximum possible Euclidean distance between a block and center of image anddi
rep-resents the Euclidean distance of blockifrom the center of image, then the weightαifor blockiis defined as:
αi=1−
di
dmax
(5)
The average motion magnitude of each blockidenoted byIi(F,p)is then found by averaging the motion intensity
of each pixel in the block. The motion intensity of each
blockiis multiplied by weight αi. The weighted motion
intensity of each block is added to get the weighted motion intensity of frameF.
The weighted average motion intensity value is then computed for each frame in the video. If there arenframes in the video andIFjrepresents the weighted average
inten-sity value ofjth frame,IminandImaxare the minimum and maximum motion intensity values, then relative motion intensity of frameRI(Fj)is found as:
RI(Fj)=
IFj−Imin Imax−Imin
(6)
The relative motion intensity values are now in the range of [0, 1] whereby a value closer to 1 represents a high salient relative motion and a value closer to 0 means less salient motion.
3.2.2 Relative motion consistency
Along with the motion magnitude, an important metric in the motion field is the orientation or direction of the motion vectors. IfMx(p)andMy(p)represent thexandy
components of the motion vector of current frameFwith reference to previous frame, the orientation value at pixel pis given as:
O(F,p)=arctan
My(p)
Mx(p)
(7)
The consistent values of orientation generally represent the saliency intensive moving objects. A set of inconsis-tent orientation values, on the other hand, may refer to object boundaries or random motions.
In order to compute the relative motion consistency measure of a frame, the orientation value of each pixel in the frame is computed using Eq. (7). Like, Section 3.2.1, the frame is divided into non-overlapping blocks of size 9 × 9. The weight valuesαi of a block i relative to the
center of the image is also defined in same way as in Section3.2.1. Next, the variance of each blockidenoted by σ2
i is computed which is a measure of variation of motion
orientations in the corresponding block. The variance value of each blockiis then multiplied by the correspond-ing weightαi. The variances of each block in the frame is
then summed up to get the motion variance measure of each frame.
The weighted average motion variance value is then computed for each frame in the video. If there arenframes in the video andσFj2represents the weighted average vari-ance value ofjth frame,σmin2 andσmax2 are the minimum and maximum motion variance values, then the relative motion consistency value of frameFjdenoted byRO(Fj)is
found as:
RO(Fj)=1−
σ2
Fj−σmin2
σ2
max−σmin2
(8)
In Eq. (8), the variance values are subtracted from 1 to convert relative variance values into relative consistency values. The resultant values are again in the range of [ 0, 1]. The values closer to 1 indicates relatively higher consis-tent motion, and the values closer to 0 indicates relatively lower consistent motion.
3.2.3 Benefits of relative motion measures
The relative motion intensity, unlike absolute motion intensity, determines the amount of motion relative to the rest of the frames. The studies of human visual systems indicate that the human tend to focus on that parts of the video which reflect more change in terms of motion. The proposed relative motion intensity and relative motion consistency measure the change in magnitude and direc-tion in a frame relative to other frames in the video. In this way, those frames will get the higher visual attention val-ues where the change in higher in comparison with other frames. On the other hand, the usage of absolute mea-sures for magnitude and direction will merely capture the amount and direction of motion in the frame irrespective of the amount and direction of motion in other frames and thus will not effectively reflect the properties of human visual system.
Moreover, the proposed methods of relative motion take into account the location of a pixel value relative to the center of the image. Since, human beings usually focus on the center of an image, so the motion values are adjusted in a way such that the pixels closer to center get a high bias as compared to the pixels way from the center. The proposed scheme assigns this bias on block level instead of applying on pixel level in order to save the computational time.
3.3 Fusion of features
is to select the maximum value of the two attention values. However, the maximum function does not differ-entiate between values(1, 0),(1, 0.9),(1, 0.8), etc. where the resultant value will always be 1 and ignores the second attention value altogether.
In this context, a fusion scheme with the following properties is needed:
• For two high attention values, the resultant fusion value must be high.
• If one attention value is high and other is low, the resultant fusion value must still be relatively high.
• If both attention values are low, the resultant fusion value must be low.
• The fusion function must be an an increasing function. For instance, if one attention value is 1 and other attention value vary from 0 to 1, then the fusion values must be increasing.
A simple novel fusion mechanism is proposed that ful-fills all of the abovementioned properties. Consider A1 andA2to be two attention values to be fused. The value of a constantc1is then defined as per following criteria:
c1=
0.2 if max(A1,A2)≥λ
λ otherwise (9)
The thresholdλis defined to be 0.7. Another constant c2is set to the value 0.2. The two attention values are then combined to get an intermediate fused valueF:
F= [1+max(A1,A2)−c1]+[min(A1,A2)−c2] 2
(10)
Using Eq. (10), the maximum possible value is achieved when one of the attention values is 1 and the minimum attention value is achieved when one of the values is 0. Using Eq. (10), the maximum and minimum possible valuesFmax andFmin are found as:
Fmax = [2−c1]+[min(A1,A2)−c2]
2 (11)
Fmin = 1+max(A1,A2)−c1−c2
2 (12)
Finally, the fused attention valueFis obtained:
F=max(A1,A2)−Fmin ×
F−Fmin Fmax −Fmin
+Fmin
(13)
The thresholdλdetermines the attention value that is considered to be high. Setting λ = 0.7 suggests that an attention value that is greater than or equal to 0.7 is considered high. The constantsc1andc2are controlling parameters. Equation (9) suggests that if one of the atten-tion values exceeds the criteria of being high then the
penalty control parameter c1 is set to be low and vice versa. The second controlling parameter c2is fixed to a low value. Equation (10) is averaging the attention val-ues by boosting the maximum value by adding 1 and then penalizing the maximum and minimum value by subtract-ing c1 and c2 respectively. The choice of parameters c1 and c2 makes sure that if at least one of the attention values is higher then the penalty to the higher value is less. However, if both values are lower, then the first value also gets a higher penalty. Equations (11) and (12) sim-ply computes the minimum and maximum possible values of Eq. (10). Equation (13) simply scales the fusion value obtained through Eq. (10) in the range [ 0, 1]. The value of λcan be changed to set to a value that is considered to be high. The values of controlling parametersc1andc2can be changed to control the level of penalty to low and high attention values. The values of parameters given above are selected experimentally.
Table1displays the results of fusion values for combi-nation of two attention values in the range of [ 0, 1] with a step size of 0.1. As discussed, the fusion scheme must generate a higher resultant value if one of the attention value is on the higher side. Moreover, the magnitude of the attention value must also be reflected in the fused value. The results indicate that the fusion scheme fulfills all the properties of an ideal fusion scheme of attention values.
3.4 Key frame selection
The range of the attention values for the complete video is increased by stretching the range of attention values to span the entire range of values from 0 to 1. This range stretching step assists in highlighting the differences between attention values. If the minimum and maximum values in the attention curve are denoted by Amin and Amax, then each valueAinin the attention curve is scaled toAoutas:
Aout=
Ain−Amin Amax−Amin
(14)
Table 1Fusion results for sample attention values
A1/A2 1 0.9 0.8 0.7 0.6 0.5 0.4 0.3 0.2 0.1 0
1 1 0.98 0.96 0.94 0.92 0.9 0.88 0.86 0.84 0.82 0.8
0.9 0.98 0.885 0.87 0.855 0.84 0.825 0.81 0.795 0.78 0.765 0.75
0.8 0.96 0.87 0.78 0.77 0.76 0.75 0.74 0.73 0.72 0.71 0.7
0.7 0.94 0.855 0.77 0.685 0.68 0.675 0.67 0.665 0.66 0.655 0.65
0.6 0.92 0.84 0.76 0.68 0.5 0.475 0.45 0.425 0.4 0.375 0.35
0.5 0.9 0.825 0.75 0.675 0.475 0.4 0.38 0.36 0.34 0.32 0.3
0.4 0.88 0.81 0.74 0.67 0.45 0.38 0.31 0.295 0.28 0.265 0.25
0.3 0.86 0.795 0.73 0.665 0.425 0.36 0.295 0.23 0.22 0.21 0.2
0.2 0.84 0.78 0.72 0.66 0.4 0.34 0.28 0.22 0.16 0.155 0.15
0.1 0.82 0.765 0.71 0.655 0.375 0.32 0.265 0.21 0.155 0.1 0.1
0 0.8 0.75 0.7 0.65 0.35 0.3 0.25 0.2 0.15 0.1 0.05
variation of each shot is measured by computing the vari-ance of fused attention values of the frames in the shot. If the variation in a shot is higher, it must be assigned more key frames and vice versa. The number of key frames assigned to a particular shot is then defined as:
Ks=max
nK ×
vs
Ts
i=1vi
, 1
(15)
vsis the variance of attention values in a shots,nK is the
total number of desired key frames, andTsis the number
of shots in the video. If the desired number of key frames is unknown, then the frame with the highest attention value is selected as the key frame from each shot.
4 Experiment results and discussion
In order to evaluate the efficacy of the proposed method, three different groups of experiments were performed. The details of these experiments are described in the subsequent sections.
4.1 Benefits of proposed visual attention mechanism In this sub-section, the benefits of the proposed scheme have been demonstrated based on the choice of key frames
in single shots of the two videos downloaded from the Open Video projectwww.open-video.org.
Firstly, we present the results of the proposed tech-nique on frames 532 to 548 from the second shot of the video hcil2000_01.mpeg. The shot consists of a person standing and talking in front of the trees with very little motion. A subtitle, showing an introduction of the per-son in the scene starts appearing in Frame 545. There is no significant motion in the scene apart from the move-ment of the person’s body parts. The maximum attention value is found at frame 548, and thus, it is selected as the key frame. Figure 3 shows the key frames selected by a clustering-based algorithm [14], visual attention-based model [9], and the proposed method. The key frame selected by [14] does not include the subtitle. In the key frame selected by [9], it can be seen that even though the subtitle starts appearing in the frame, it is not legible. The key frame selected by our scheme matches the human perception better than the key frame extracted by [9].
Secondly, the technique was tested on the fifth shot of the video ucomp03_0 6_m1.mpeg which ranges from the frames 484 to 555. This shot shows a tennis player striking the ball and then standing and receiving applause from the
Fig. 4Key frames extracted by [14] and [9] and our scheme on the videoucomp03_06_m1.mpeg. From left to right:akey frame extracted by [14], bkey frame extracted by [9],ckey frame extracted by the proposed scheme
audience. The shot is characterized by a large amount of camera and object motions. The highest attention value is present at frame 486 which is thus the key frame selected by our scheme.Lai and Yi [9] selects frame 525 as the key frame. Figure 4 shows the key frames extracted by [14] and [9] and the proposed technique. The key frames extracted by [14] and [9] fail to show the stroke of the ten-nis player. The key frame extracted by our scheme is thus more interesting and representative of the shot.
4.2 Comparison with other techniques
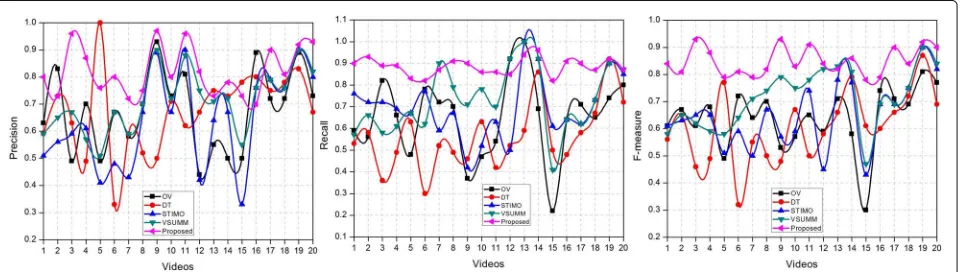
In this section, the results of our scheme are compared with some of the popular non-visual attention-based tech-niques. For this purpose, the experiments are conducted based on 20 videos selected from the Open Video Project. The videos belong to different genres including histori-cal, education, and documentary. These videos were part of the data set used by many authors [12–14] in the eval-uation of their video summarization algorithms. All the videos are in mpeg format. The information about the data set videos is presented in Table2. For the evaluation data set of Table2, the proposed scheme has been com-pared with four other schemes for key frame extraction: OV [11], DT [12], STIMO [13], and VSUMM [14].
In the evaluation scheme, the key frames are manually selected by three human users for a particular video and then compared with the key frames extracted by a partic-ular technique. The number of matched and unmatched key frames is then calculated. The two frames are con-sidered matched if they are conveying same semantic message. In this way, the key frames selected by the user act as ground truth data. The comparison between ground truth and key frames generated by a technique is used to define the following terms: true positive, a frame selected as key frame by both human user and the technique; false positive, a frame selected as key frame by technique but not by human user; and false negative, a frame selected as key frame by human user but not by technique.
The number of true positive, false positive, and false negative frames is used to reflect the quality of the
summaries in terms of popular pattern recognition metrics Recall, Precision, and F-measure. In the current context, the Recall is defined as the probability that a rel-evant key frame is selected by the technique. Precision is defined as the probability that an extracted key frame is relevant. Usually, there is a tradeoff between Recall and Precision values where one value decreases with the increase in the other one. The F-measure combines Preci-sion and Recall as one measure.
If the numbers of true positive, false positive, and false negative frames are denoted by Tp, Fp, and Fn respectively, Recall and Precision are defined as:
Table 2Details of test videos
No. Video name No. of
frames
1 Wetlands Regained, segment 03 of 8 3562
2 Technology at Home: A Digital Personal Scale 3346
3 Introduction to HCIL 2000 reports 2454
4 Ocean floor Legacy, segment 05 of 14 4665
5 The Great Web of Water, segment 01 3279
6 The Great Web of Water, segment 02 2118
7 The Great Web of Water, segment 07 1745
8 A New Horizon, segment 01 1806
9 A New Horizon, segment 02 1797
10 A New Horizon, segment 06 1944
11 A New Horizon, segment 08 1815
12 Exotic Terrene, segment 04 4797
13 The Future of Energy Gases, segment 05 3615
14 The Future of Energy Gases, segment 09 1884
15 Ocean floor Legacy, segment 01 1740
16 Ocean floor Legacy, segment 02 2325
17 Ocean floor Legacy, segment 09 2106
18 Hurricane Force—A Coastal Perspective, segment 03 2310
19 Drift Ice as a Geologic Agent, segment 05 2187
Table 3Mean Recall, Precision, and F-measure achieved by different techniques
OV DT STIMO VSUMM Proposed
Recall 0.65 0.56 0.70 0.73 0.88
Precision 0.67 0.67 0.64 0.71 0.82
Recall 0.64 0.61 0.65 0.71 0.85
Recall= Tp Tp+Fn
(16)
Precision= Tp Tp+Fp
(17)
The Recall and Precision obtained by matching with summaries of three users are then averaged to obtain Precision and Recall values for a video. The F-measure is then defined as:
F=2×
Recall×Precision Recall+Precision
(18)
The ground truth data (user summaries) for the data set of Table1is taken from the open access database provided by the authors of [14]. The summaries for our technique have been generated by selecting one key frame from each shot. The average values of Recall, Precision, and F-measure for all the techniques under consideration are shown in Table3. The proposed methodology is clearly superior to the rest of the techniques based on these results.
The Recall, Precision, and F-measure values for each video in the evaluation data set are shown in Fig.5. It can be easily observed that the proposed technique consis-tently achieve the highest values for Recall and Precision for all the videos. There are however exceptions whereby other schemes attain high values for one of the parame-ters. A high value for one of the parameters is generally not sufficient. The Precision measures the ability of a scheme to retrieve the most precise results. A high value of Precision means better relevance. However, a high value of Precision can be achieved by selecting very few key
frames. For instance, for video 5, DT achieves a Precision value of 1 by selecting only one key frame. The Recall value measures the ability to retrieve as many as possible rele-vant key frames. In this way, the Recall value complements the Precision value. Therefore, a good scheme is one hav-ing high values for both the Recall and Precision. Thus, the Recall value of DT for video 5 is sufficiently low. The proposed scheme however has the highest value of Recall for this video and a reasonably high value for Precision. Moreover, the F-measure of our scheme is 0.79 whereas for DT it is 0.77. Table3clearly indicates that the proposed scheme obtains the highest value for F-measure and thus is more efficient and close to human perception than that of the other schemes.
4.3 Time complexity of the proposed system
Assume that there are a total ofTnumber of frames in the image with each one of them having resolutionN×N.
The time complexity for computing the relative motion intensity value for one frame is the sum of (i) time taken for computation of optical flow which is ON2 using Lucas Kanade algorithm by setting the number of warp parameters to 2, (ii) finding the distance of each of the N/2 block with the center of the frame which is O(N), (iii) finding and applying the value of α which is again an operation ofO(N), (iv) finding the average intensity value which involves finding average value of each pixel in the frame and thus isON2 , and (v) finding the relative motion intensity which involves finding the relative inten-sity of a frame in comparison with all frames of the image and thus has a time complexity ofO(T). Thus, the over-all time complexity of finding relative motion intensity is ON2+T .
Similarly, the time complexity of finding relative orien-tation consistency isON2+T . The time complexity of fusion of features isO(1)as there are only three features to be combined. The time complexity of key frame selection isO(T). Thus, the overall time complexity of the system is ON2+T +ON2+T +O(T)=ON2+T .
5 Conclusions
In this paper, a visual attention-based framework for extracting key frames from the videos is presented. The proposed saliency-based visual attention model effectively bridges the semantic gap between low level features and human perception without actual human intervention. The usage of multi-scale color contrast provides an excel-lent approximation of the interested object in a video frame. The proposed relative motion intensity and rel-ative orientation consistency are effective measures of motion-based saliency. The used fusion scheme combines the benefits of previously used schemes by providing a non-linear mechanism along with weighted motion pri-ority mechanism. The used visual attention clues and fusion mechanism render a more complete and consistent framework. The framework allows the users to control the density of key frames and works at both shot and scene level. The experimental results on a number of cri-teria demonstrate that the proposed framework extracts more semantically meaningful key frames as compared to the techniques to which it is compared. The time com-plexity of the algorithm is the major issue which may hinder the implementation in some scenarios. This can be improved by using more efficient algorithm for comput-ing optical flow or by uscomput-ing an efficient motion estimation scheme.
Funding
This work was supported by the National Research Foundation of Korea (NRF) grant funded by the Korea Government (MSIP) (No. 2016R1A2B4011712).
Authors’ contributions
NE, SWB, HC, and IM conceived and discussed the project. IM and NE developed and discussed the algorithms. SWB and HC wrote the publication and provided the data for testing the algorithms. HM assisted in testing and revising the paper apart from doing time complexity analysis. All authors have read and approved the final manuscript.
Competing interests
The authors declare that they have no competing interests.
Publisher’s Note
Springer Nature remains neutral with regard to jurisdictional claims in published maps and institutional affiliations.
Author details
1Department of Computer Science, Iqra University, Islamabad, Pakistan. 2Department of Software, Sejong University, Seoul, South Korea.3Department
of Computer Science, National University of Computer and Emerging Sciences, Islamabad, Pakistan.4Department of Industrial Security, College of
Business and Economics, Chung-Ang University, Seoul, South Korea.
Received: 12 January 2018 Accepted: 21 May 2018
References
1. BT Truong, S Venkatesh,Video abstraction: a systematic review and classification, (2007), pp. 1–37
2. AG Money, H Agius, Video summarisation: a conceptual framework and survey of the state of the art. J. Vis. Commun. Image Represent.19, 121–143 (2008)
3. X Song, L Sun, J Lei, D Tao, G Yuan, M Song, Event-based large scale surveillance video summarization. Neurocomputing.187, 66–74 (2016). Recent Developments on Deep Big Vision
4. T Itazuri, T Fukusato, S Yamaguchi, S Morishima, inHawaii Convention Center in Honolulu. Court-based volleyball video summarization focusing on rally scene, (Hawaii, 2017), pp. 179–186
5. N Ejaz, TB Tariq, SW Baik, Adaptive key frame extraction for video summarization using an aggregation mechanism. J. Vis. Commun. Image Represent.23, 1031–1040 (2012)
6. AC Hernandez, MC Hernandez, FG Ugalde, MN Miyatake, HP Meana, A fast and effective method for static video summarization on compressed domain. IEEE Lat. Am. Trans.14, 4554–4559 (2016)
7. YF Ma, LLu XS Hua, HJ Zhang, A generic framework of user attention model and its application in video summarization. IEEE Trans. Multimedia. 7, 907–919 (2005)
8. J Peng, Q Xiaolin, Keyframe-based video summary using visual attention clues. IEEE MultiMedia.17, 64–73 (2010)
9. J-L Lai, Y Yi, Key frame extraction based on visual attention model. J. Vis. Commun. Image Represent.23, 114–125 (2012)
10. N Ejaz, I Mehmood, SW Baik, Efficient visual attention based framework for extracting key frames from videos.Signal Process. Image Commun.28, 34–44 (2013)
11. D DeMenthon, V Kobla, D Doermann, inProceedings of the Sixth ACM International Conference on Multimedia. MULTIMEDIA ’98. Video summarization by curve simplification (ACM, New York, 1998), pp. 211–218
12. P Mundur, Y Rao, Y Yesha, Keyframe-based video summarization using Delaunay clustering. Int. J. Digit. Libr.6, 219–232 (2006)
13. M Furini, F Geraci, M Montangero, M Pellegrini, Stimo: Still and moving video storyboard for the web scenario. Multimedia Tools Appl.46, 47 (2009)
14. SEF de Avila, APB Lopes, A da Luz, A de Albuquerque Arajo, Vsumm: A mechanism designed to produce static video summaries and a novel evaluation method. Pattern Recogn. Lett.32, 56–68 (2011). Image Processing, Computer Vision and Pattern Recognition in Latin America 15. D Potapov, M Douze, Z Harchaoui, C Schmid,Category-Specific Video
Summarization. (Springer International Publisher, Switzerland, 2016), pp. 540–555
16. M Sun, A Farhadi, S Seitz, inIEEE, Computer vison and pattern recognition, Hynes Convention Center in Boston. Ranking Domain-Specific Highlights by Analyzing Edited Videos (Springer International Publishing,
Massachusetts, 2016), pp. 787–802
17. M Gygli, H Grabner, LV Gool, inIEEE, Computer vison and pattern recognition, Hynes Convention Center in Boston. Video summarization by learning submodular mixtures of objectives, (Massachusetts, 2015), pp. 3090–3098 18. K Zhang, WL Chao, F Sha, K Grauman, inIEEE, 2015 International
Conference on Computer Vision, Dates: Dec 11, 2015 ˝U Dec 18, 2015. Summary transfer: exemplar-based subset selection for video summarization, (Araucano Park, Las Condes, Chile, 2016), pp. 1059–1067 19. B Xiong, G Kim, L Sigal, in2013 IEEE Conference on Computer Vision and
Pattern Recognition, Hynes Convention Center in Boston. Storyline representation of egocentric videos with an applications to story-based search, (Massachusetts, 2015), pp. 4525–4533
20. Z Lu, K Grauman, inIEEE, 2014 22nd International Conference on Pattern Recognition. Story-driven summarization for egocentric video, (Stockholm, Sweeden, 2013), pp. 2714–2721
21. R Panda, SK Kuanar, AS Chowdhury, in2013 IEEE Conference on Computer Vision and Pattern Recognition, Hynes Convention Center in Boston. Scalable video summarization using skeleton graph and random walk,
(Massachusetts, 2014), pp. 3481–3486
22. WS Chu, Y Song, A Jaimes, in2012 IEEE Conference on Computer Vision and Pattern Recognition, Hynes Convention Center in Boston. Video
co-summarization: video summarization by visual co-occurrence, (Massachusetts, 2015), pp. 3584–3592
23. S Feng, Z Lei, D Yi, SZ Li, in2015 IEEE Conference on Computer Vision and Pattern Recognition, Hynes Convention Center in Boston. Online
content-aware video condensation, (Massachusetts, 2012), pp. 2082–2087 24. F Dornaika, IK Aldine, Decremental sparse modeling representative
selection for prototype selection. Pattern Recognit.48, 3714–3727 (2015) 25. E Elhamifar, G Sapiro, R Vidal, inIEEE, Computer vison and pattern
26. J Meng, H Wang, J Yuan, YP Tan, inIEEE, Computer vison and pattern recognition, Hynes Convention Center in Boston. From keyframes to key objects: video summarization by representative object proposal selection, (Massachusetts, 2016), pp. 1039–1048
27. B Zhao, EP Xing, inIEEE Conference on Computer Vision and Pattern Recognition. Quasi real-time summarization for consumer videos (Elsevier International Publisher, Switzerland, 2014), pp. 2513–2520 28. H-C Lee, S-D Kim, Iterative key frame selection in the rate-constraint
environment. Signal Process. Image Commun.18, 1–15 (2003)
29. T Liu, X Zhang, J Feng, K-T Lo, Shot reconstruction degree: a novel criterion for key frame selection. Pattern Recogn. Lett.25, 1451–1457 (2004) 30. M Cooper, J Foote, inIEEE International Conference on Multimedia and
Expo. Discriminative techniques for keyframe selection (Elsevier International Publisher, Switzerland, 2005), p. 4
31. A Toet, Computational versus psychophysical bottom-up image saliency: a comparative evaluation study. IEEE Trans. Pattern. Anal. Mach. Intell.33, 2131–2146 (2011)
32. T Liu, Z Yuan, J Sun, J Wang, N Zheng, X Tang, HY Shum, Learning to detect a salient object. IEEE Trans. Pattern. Anal. Mach. Intell.33, 353–367 (2011) 33. BD Lucas, T Kanade, inProceedings of the 7th International Joint Conference
on Artificial Intelligence - Volume 2, IJCAI’81. An iterative image registration technique with an application to stereo vision (Morgan Kaufmann Publishers Inc, San Francisco, 1981), pp. 674–679

![Fig. 4 Key frames extracted by [b14] and [9] and our scheme on the video ucomp03_06_m1.mpeg](https://thumb-us.123doks.com/thumbv2/123dok_us/885646.1585994/8.595.303.538.426.731/fig-key-frames-extracted-scheme-video-ucomp-mpeg.webp)