LETTER
Single to three nucleotide polymorphisms
assay of miRNA-21 using DNA capped gold
nanoparticle-electrostatic force microscopy
system
Hyungbeen Lee and Soo Hyun Lee
*Abstract
Aberrant expression of microRNA (miRNA) in biological cells is crucial evidence for early diagnosis of cancer. Improve-ments in molecular detection techniques enabled miRNA to be detected in human blood obtained from liquid biop-sies (e.g., Polymerase chain reaction, microcantilever sensor, and surface-enhanced Raman spectroscopy). Despite the advances in molecular detection technology, a simultaneous detection of single or multiple mutations of miRNAs is still a challenge. Here, we show electrostatic force microscopy (EFM) imaging of DNA-capped gold nanoparticles (DCNP) that enables discrimination between single and three-nucleotide polymorphism (SNP, TNP): 1 and 3-point mismatched nucleotides in miRNA-21 (M1_RNA, M3_RNA). Detection of the miRNA-21 and their mutant sequence is owing to sterically well-adjusted DNA–RNA interactions that take place within the confined spaces of DCNP. The aver-age absolute EFM amplitudes of DCNP interacting with M1_RNA, and M3_RNA (− 81.0 ± 11.5, and − 65.7 ± 8.2 mV) were found to be lower than the DCNP reacting with normal (non-mutant) miRNA-21 (− 100.2 ± 13.6 mV). Keywords: Electrostatic force microscopy, Genetic mutation analysis, Gold nanoparticle, Micro RNA, Single nucleotide polymorphism, Three nucleotide polymorphisms
© The Author(s) 2019. This article is distributed under the terms of the Creative Commons Attribution 4.0 International License (http://creativecommons.org/licenses/by/4.0/), which permits unrestricted use, distribution, and reproduction in any medium, provided you give appropriate credit to the original author(s) and the source, provide a link to the Creative Commons license, and indicate if changes were made.
Introduction
The development of biomolecular detection in human blood, extracted with liquid biopsy technology for early and noninvasive cancer diagnosis, remains an important challenge in oncology [1–3]. Studies on the diagnosis of cancer through liquid biopsy have started from the detec-tion of circulating tumor cells (CTC) [4, 5] in the blood and have recently led to the sequencing of circulating nucleic acids (CNA) [5–7]. Particularly, micro RNAs (miRNAs) can contribute to early development [8] and progression [9] of cancer, since they can play roles in vivo functions as oncogenes or tumor suppressor genes [10, 11]. Aberrant expression of miRNA in biological cells is crucial evidence for early diagnosis of cancer [12, 13].
Therefore, miRNA analysis has been highlighted as a non-invasive cancer diagnosis method.
Moreover, precise identification of the number and position of nucleotide mismatches in miRNA is funda-mental to determine the disease type of a patient and anticipate the time of onset. Specifically, mutations of two or more nucleotides in a miRNA are more aggres-sive than mutations caused by a single nucleotide poly-morphism [14]. This is because the risk of mutation of multiple amino acids increases as the successive positions of the codons change. However, in general method of miRNA assay (e.g., polymerase chain reac-tion [15], next generation sequencing [16], and surface-enhanced Raman spectroscopy [17]), a simultaneous detection of single or multiple mutations of miRNAs is still a challenge. Specifically, the detection of miRNAs at the single molecule level enables detection of even single nucleotide mutations, but it is difficult to iden-tify the sequence of all RNAs in solution. Conversely,
Open Access
Page 2 of 6 Lee and Lee Micro and Nano Syst Lett (2019) 7:21
fluorescence based optical sensors that detect all miR-NAs in solution are difficult to have a single mutation resolution.
To overcome these hurdles, we have adopted DNA-capped gold nanoparticles (DCNPs) as a sensing plat-form. A probe DNA (pDNA) was immobilized onto uniformly-sized 50 nm gold nanoparticles to capture miRNA-21 which has early diagnostic and prognostic potential in a wide variety of cancers including lung and breast cancers. In addition, to measure the electrostatic potential of DCNP surface, electrostatic force micros-copy (EFM) was used for high-resolution detection of individual DCNPs. EFM is one of standard application of AFM for profiling the electrostatic surface potential with nanoscale level [18]. EFM measures the contact poten-tial difference (CPD) between the conductive cantilever tip and the sample surface. EFM utilizes the electrostatic force between the tip and the sample to get the CPD [18, 19]. When the tip scans over the sample, the external bias is applied between the tip and the sample to nullify the CPD. EFM has the advantage that it is able to measure the surface potential of an individual oligomer [20] or nanoparticle [21], in contrast with conventional elec-trophoresis and zeta-potential. Therefore, gene muta-tion analysis of miRNA using a combinamuta-tion of EFM and DCNP has the following advantages: (i) dozens of DCNP (30–50 individual complexes) surface charge analyzes in one imaging (The surface charge of one DCNP repre-sents the result of complementary binding reactions of more than 600 miRNAs and pDNAs [22], and dozens of these results are obtained in one imaging, which allows efficient statistical analysis of miRNA mutation assay [19, 23]); (ii) accurate DNA–RNA response affinity analysis due to the binding of freely moving DCNP and miRNA in solution; (iii) label-free fashion; (iv) single or multiple nucleotide assay using nano-scale resolution of EFM.
As a result of gene mutation analysis using our method with these advantages, the average absolute EFM ampli-tudes of DCNP interacting with M1_RNA, and M3_RNA were found to be lower than the DCNP reacting with normal (non-mutant) miRNA-21. This result implies that the amount of miRNA to be bound decreases as the num-ber of nucleotides mismatches increases. We believe that our miRNA analysis system will be a brand-new method of cancer diagnosis via liquid biopsy.
Materials and methods Preparation of gold nanoparticles
Gold nanoparticles (GNP) (Mean size = 50.0 nm;
CV ≤ 8%) solution was purchased from BBI Solutions
(Cardiff, UK). GNP were suspended in purified water at 4.5 × 10¹⁰ particle per milliliter.
GNP functionalization with pDNA
To immobilize pDNA on the nanoparticles, we used a thiol-terminated DNA (sequence: 5′/5ThioMC6-D-TCA ACA TCA GTC TGA TAA GCT A-3′). The pDNA were reduced by 100 mM 1,4-dithiotheritol (DTT) (H7033, Sigma-Aldrich). The reduction of the pDNA by DTT is necessary to remove the protecting group from the DNA [24, 25]. To purify the pDNA from excess DTT, the pDNA solution was applied to GE Healthcare illus-tra™ NAP™ Columns, NAP-5 (GE17-0853-01, Sigma-Aldrich, St. Louis, Missouri, USA), after 1 h incubation at room temperature. Purified pDNA solution was mixed with colloidal GNP at room temperature for 1 h. Phos-phate buffer with pH 7 and 10% sodium dodecylsulfate solution (V6551, Promega, Fitchburg, Wis-consin, USA) was added for pH adjustment, followed by the addition of six aliquots of 2 M sodium chloride solution (S7653, Sigma-Aldrich, St. Louis, Missouri, USA) to a final con-centration of 0.3 M. After chemical functionalization, the mixture was centrifuged for 25 min at 14,000 rpm at room temperature to remove excess reagents. The super-natant was removed, and 0.1 mM phosphate buffer was added to the tube containing the pDCNPs.
Hybridization of pDNA and miRNA
A mixture of 1 nM miRNA solution (c, M1, M3, and NC) and pDCNP solution was vortexed for 10 min at room temperature. After vortexing of the mixture, the temperature of the mixture is raised to 60 °C and then slowly lowered and mixed for 3 h in a roll mixer.
Preparation of EFM samples
For EFM imaging, 50 μl of the DCNPs were dropped onto each gold substrate, and the DCNPs were adsorbed on the gold substrate for 1 h. The gold substrate was then rinsed with deionized water and gently blow-dried with nitrogen to avoid aggregation of the DCNPs before AFM imaging or electrostatic force measurements.
Electrostatic force measurements of DCNPs
The topography and the electrostatic force measure-ments of all DCNP specimens were performed using a commercial AFM (XE-100, Park Systems, Suwon, Korea) at room temperature. All of the topography and the electrostatic force mapping images (scan size: 10 μm × μm) by non-contact mode were obtained at the
scan speeds of 5 μm/s.
Results and discussion
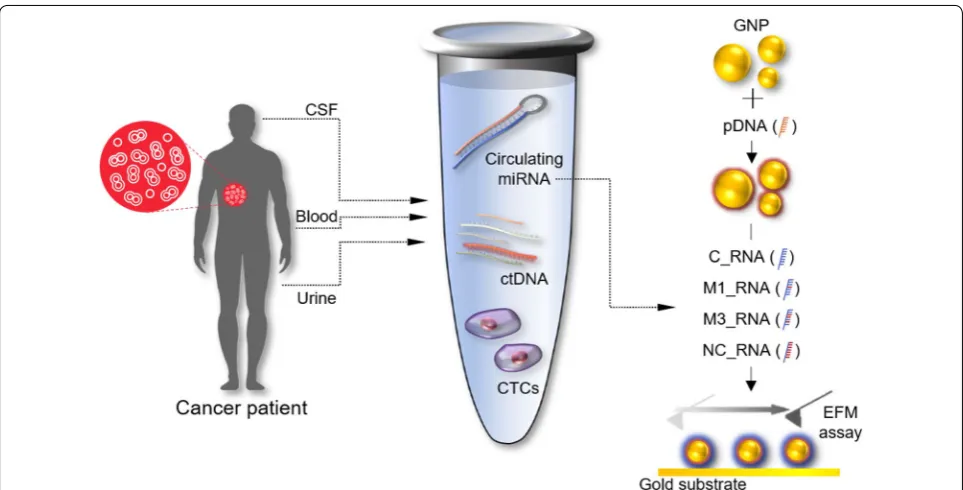
a hybridized form of DNA–miRNA (Fig. 1). The DNA and RNA sequences (22 mer; Table 1) were used in our assay system, and among them, RNA that binds to pDNA complementarily is miRNA-21. It is important that the assay system can accurately identify the num-ber and position of nucleotide mismatches in miRNA. To test how many nucleotide mutations our system can identify, we artificially made oligonucleotides with complimentary, 1, 3-point mismatched, and non-com-plimentary nucleotides in miRNA-21 (c_RNA, M1_ RNA, M3_RNA, and, NC_RNA). Our system performs a complementary binding reaction between the GNPs to which pDNA is immobilized and the miRNA to be measured (Fig. 1). When pDNA and miRNA react, there is a difference in binding affinity according to the difference of the sequence of miRNA, and the differ-ence in binding affinity is represented by the number
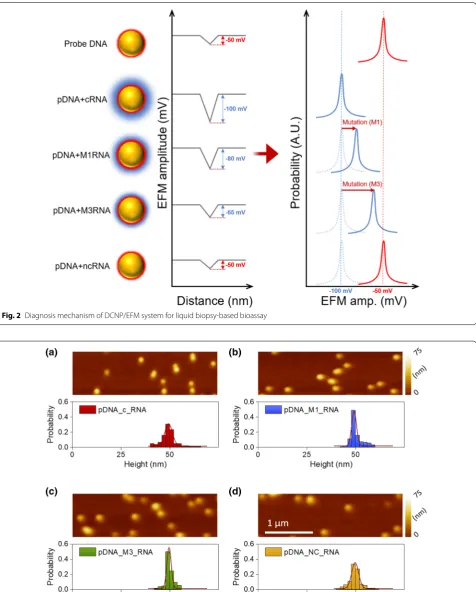
of miRNAs capturing to GNPs. Since all oligonucleo-tides bound to the GNP surface have a strong negative charged phosphate backbone, the electrostatic surface potential of DCNP after DNA–RNA reaction indicates the amount of bound miRNA. Furthermore, as shown in Fig. 2, the electrostatic surface potential of DCNP, which represents the number of miRNAs capturing to GNPs is expected to decrease as the number of miRNA mutations increases. Because, the equilibrium con-stant for two different oligonucleotides hybridization exponentially diminished asymptotically as number of nucleotide mismatches increased [23].
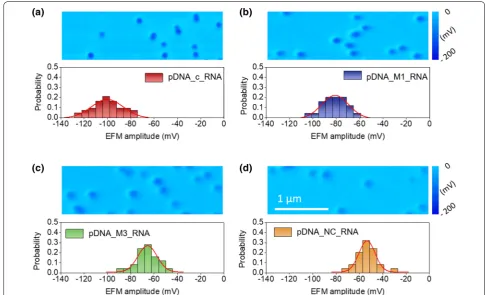
Before the measurements of the DCNPs electri-cal surface potential, the size and morphology of the DCNPs were confirmed by AFM topographic imag-ing. Figure 3 represents the topographic images and the histograms of the height distributions of all the types of DCNPs. Each histogram graph was obtained from 30 to 50 individual complexes captured as a sin-gle image under each condition. Both the mean value and standard deviation for each case were extracted by the Gaussian fits: c_RNA (49.32 ± 1.97 nm), M1_RNA (49.16 ± 1.23 nm), M3_RNA (49.32 ± 1.97 nm), and NC_RNA (49.70 ± 1.78 nm). As a result of the height of DCNP, it is possible to prove that the diameter of GNP used in this paper is identical. In addition, since the diameter of GNP is much larger than oligonucleotides, it is confirmed that the number of oligonucleotides
Fig. 1 Schematic representation of the assembly of DCNPs and their electrostatic force detection by EFM for liquid biopsy-based bioassay of circulating miRNA-21 (with c_RNA, M1_RNA, M3_RNA)
Table 1 DNA and RNA sequences used in the experiment
Name Sequence
Probe DNA 5′-SH-(CH2)3-TCA ACA TCA TC TGA TAA GCT A-3′
c_RNA 5′-UAG CUU AUC AGA CUG AUG UUG A-3′
Page 4 of 6 Lee and Lee Micro and Nano Syst Lett (2019) 7:21
Fig. 2 Diagnosis mechanism of DCNP/EFM system for liquid biopsy-based bioassay
attached to the surface of GNP does not affect the height of DCNP.
For mutation analysis of miRNA, the electrostatic sur-face potential of DCNP was measured by EFM. Figure 4 represents the EFM mapping images and the histograms of the EFM amplitude distributions of all the types of DCNPs. Both the mean value and standard deviation for each case were extracted by the Gaussian fits: c_RNA (− 100.21 ± 13.61 mV), M1_RNA (− 80.99 ± 11.49 mV), M3_RNA (− 65.69 ±8.17 mV), and NC_RNA (− 53.55 ± 6.92 mV). As a result of the EFM mapping of
DCNP, it was evident that the absolute value of the EFM amplitude decreased as the number of mutations of the miRNA increased. The decrease in the absolute value of the EFM amplitude implies that a relatively small amount of miRNA binds to DCNP. This result depicts that the presence of the mutant of the miRNA to be measured weakens the binding affinity of the miRNA to pDNA, which can be used to detect the mutation of miRNA.
Furthermore, to evaluate the detection resolution of our system, we performed t-tests using the EFM amplitude data of both neighboring conditions (i.e.,
pDNA + c_RNA/pDNA + M1_RNA, pDNA + M1_
RNA/pDNA +M3_RNA, and pDNA + M3_RNA/
pDNA + NC_RNA). In the t-tests, all P-values were
much less than 0.05. As a result, we believe that the EFM amplitudes of DCNPs enabled reliable discrimination of mutant miRNA.
Conclusion
This study confirmed that the miRNA detection system (a combination of DCNP and EFM) is a promising system that could clearly distinguish miRNAs with mutations of 1 or 3 compared to wild type of miRNA-21. Moreover, statistical analysis from the electrostatic surface poten-tial of dozens of DCNPs could be performed through just one round of EFM imaging. These results suggest that our miRNA analysis system allows for efficient sequence-specific detection of miRNAs. We believe that the application of our system to the detection of miRNAs in the blood or miRNAs in the exosomes could lead to a remarkable liquid biopsy-based cancer diagnostic system.
Page 6 of 6 Lee and Lee Micro and Nano Syst Lett (2019) 7:21
Abbreviations
miRNA: micro RNA; AFM: atomic force microscopy; EFM: electrostatic force microscopy; DCNP: DNA-capped gold nanoparticle; SNP and TNP: single and three-nucleotide polymorphism; M1_RNA and M3_RNA: 1 and 3-point mismatched nucleotides in miRNA; pDNA: probe DNA; CPD: contact potential difference.
Acknowledgements Not applicable.
Authors’ contributions
HL and SHL devised the idea and supervised the project. HL and SHL dis-cussed the design and experimental setup. HL performed the experiment and drafted the manuscript. All authors edited the manuscript. Both authors read and approved the final manuscript.
Funding
This research was supported by the National Research Foundation of Korea (NRF) funded by the Ministry of Education (NRF-2018R1A6A3A01013510), and KIST Institutional Program (2E29200).
Availability of data and materials
The datasets supporting the conclusions of this article are included within the article.
Competing interests
The authors declare that they have no competing interests.
Received: 12 August 2019 Accepted: 17 October 2019
References
1. Crowley E, Di Nicolantonio F, Loupakis F, Bardelli A (2013) Liquid biopsy: monitoring cancer-genetics in the blood. Nat Rev Clin Oncol 10:472 2. Wan JC, Massie C, Garcia-Corbacho J, Mouliere F, Brenton JD, Caldas C,
Pacey S, Baird R, Rosenfeld N (2017) Liquid biopsies come of age: towards implementation of circulating tumour DNA. Nat Rev Cancer 17:223 3. Rolfo C, Castiglia M, Hong D, Alessandro R, Mertens I, Baggerman G,
Zwaenepoel K, Gil-Bazo I, Passiglia F, Carreca AP, Vento R, Peeters M, Russo A, Pauwels P (2014) Liquid biopsies in lung cancer: the new ambrosia of researchers. Biochim Biophys Acta 1846:539–546
4. Alix-Panabieres C, Pantel K (2013) Circulating tumor cells: liquid biopsy of cancer. Clin Chem 59:110–118
5. Pantel K, Alix-Panabières C (2012) The potential of circulating tumor cells as a liquid biopsy to guide therapy in prostate cancer. Cancer Discov 2:974–975
6. Diaz LA, Bardelli A (2014) Liquid biopsies: genotyping circulating tumor DNA. J Clin Oncol 32:579
7. Bettegowda C, Sausen M, Leary RJ, Kinde I, Wang Y, Agrawal N, Bartlett BR, Wang H, Luber B, Alani R (2014) Detection of circulating tumor DNA in early-and late-stage human malignancies. Sci Transl Med 6:224ra224 8. Foshay KM, Gallicano G (2009) miR-17 family miRNAs are expressed
dur-ing early mammalian development and regulate stem cell differentiation. Dev Biol 326:431–443
9. Brase JC, Johannes M, Schlomm T, Fälth M, Haese A, Steuber T, Beissbarth T, Kuner R, Sültmann H (2011) Circulating miRNAs are correlated with tumor progression in prostate cancer. Int J Cancer 128:608–616 10. Kosaka N, Iguchi H, Ochiya T (2010) Circulating microRNA in body fluid: a
new potential biomarker for cancer diagnosis and prognosis. Cancer Sci 101:2087–2092
11. Lawrie CH, Gal S, Dunlop HM, Pushkaran B, Liggins AP, Pulford K, Banham AH, Pezzella F, Boultwood J, Wainscoat JS, Hatton CSR, Harris AL (2008) Detection of elevated levels of tumour-associated microRNAs in serum of patients with diffuse large B-cell lymphoma. Br J Haematol 141:672–675 12. Bianchi F, Nicassio F, Marzi M, Belloni E, Dall’Olio V, Bernard L, Pelosi G,
Maisonneuve P, Veronesi G, Di Fiore PP (2011) A serum circulating miRNA diagnostic test to identify asymptomatic high-risk individuals with early stage lung cancer. EMBO Mol Med 3:495–503
13. Foss KM, Sima C, Ugolini D, Neri M, Allen KE, Weiss GJ (2011) miR-1254 and miR-574-5p: serum-based microRNA biomarkers for early-stage non-small cell lung cancer. J Thorac Oncol 6:482–488
14. Zorc M, Obsteter J, Dovc P, Kunej T (2015) Genetic variability of microRNA genes in 15 animal species. J Genomics 3:51
15. Kroh EM, Parkin RK, Mitchell PS, Tewari M (2010) Analysis of circulating microRNA biomarkers in plasma and serum using quantitative reverse transcription-PCR (qRT-PCR). Methods 50:298–301
16. Git A, Dvinge H, Salmon-Divon M, Osborne M, Kutter C, Hadfield J, Bertone P, Caldas C (2010) Systematic comparison of microarray profiling, real-time PCR, and next-generation sequencing technologies for measur-ing differential microRNA expression. RNA 16:991–1006
17. Driskell J, Seto A, Jones L, Jokela S, Dluhy R, Zhao Y-P, Tripp RA (2008) Rapid microRNA (miRNA) detection and classification via surface-enhanced Raman spectroscopy (SERS). Biosens Bioelectron 24:917–922 18. Girard P (2001) Electrostatic force microscopy: principles and some
appli-cations to semiconductors. Nanotechnology 12:485
19. Lee H, Lee SW, Lee G, Lee W, Lee JH, Hwang KS, Yang J, Lee SW, Yoon DS (2016) Kelvin probe force microscopy of DNA-capped nanoparticles for single-nucleotide polymorphism detection. Nanoscale 8:13537–13544 20. Cohen H, Sapir T, Borovok N, Molotsky T, Di Felice R, Kotlyar AB, Porath D
(2007) Polarizability of G4-DNA observed by electrostatic force micros-copy measurements. Nano Lett 7:981–986
21. Costi R, Cohen G, Salant A, Rabani E, Banin U (2009) Electrostatic force microscopy study of single Au–CdSe hybrid nanodumbbells: evidence for light-induced charge separation. Nano Lett 9:2031–2039
22. Hill HD, Millstone JE, Banholzer MJ, Mirkin CA (2009) The role radius of curvature plays in thiolated oligonucleotide loading on gold nanoparti-cles. ACS Nano 3:418–424
23. Lee H, Lee SW, Lee G, Lee W, Nam K, Lee JH, Hwang KS, Yang J, Lee H, Kim S, Lee SW, Yoon DS (2018) Identifying DNA mismatches at single-nucleo-tide resolution by probing individual surface potentials of DNA-capped nanoparticles. Nanoscale 10:538–547
24. Hurst SJ, Lytton-Jean AK, Mirkin CA (2006) Maximizing DNA loading on a range of gold nanoparticle sizes. Anal Chem 78:8313–8318
25. Lee H, Park J-E, Nam J-M (2014) Bio-barcode gel assay for microRNA. Nat Commun 5:3367
Publisher’s Note