RESEARCH ARTICLE
A pillar-based microfluidic chip
for T-cells and B-cells isolation and detection
with machine learning algorithm
Bilal Turan
1, Taisuke Masuda
1*, Wu Lei
2, Anas Mohd Noor
3, Koji Horio
1, Toshiki I. Saito
4, Yasuyuki Miyata
4and Fumihito Arai
1Abstract
Absolute counting of total leukocytes and specific subset (such as T-cells and B-cells) within small amounts of whole blood is difficult due to the lack of techniques that enables separation of leukocytes from limited volume of whole blood. In this study, a microfluidic chip equipped with a size controlled micropillar array for highly separation of T-cells and B-cells from sub-microliter of whole blood was studied. Based on the difference in size and deformability, leuko-cytes were separated from other blood cells by micropillar arrays. However, the variability of cells in size, morphology and color intensity along with the spectrum crosstalk between fluorescence dyes make cell detection among pillars extremely difficult. In this paper, an support vector machine supervised machine learning classifier based on both Histogram of Oriented Gradients (HOG) and color distribution features was proposed to distinguish T-cells and B-cells fast and robustly. HOG features were utilized to detect cells from background and noise; color distribution features were employed to alleviate the effect of fluorescence spectrum crosstalk. Experiment showed we achieved average detection accuracy of 94% for detecting T-cells and B-cells from the background. Furthermore, we also got 96% accu-racy with cross validation to detect T-cells from B-cells. Both theoretical analysis and experiments demonstrated the proposed method and system has high performance in T-cells and B-cells counting. And our microfluidic cell count-ing system has great potential as a tool for point-of-care leukocyte analysis system.
Keywords: Histogram of Oriented Gradients features, Microfluidic chip, Machine learning, Support vector machine, T-cells, B-cells
© The Author(s) 2018. This article is distributed under the terms of the Creative Commons Attribution 4.0 International License (http://creat iveco mmons .org/licen ses/by/4.0/), which permits unrestricted use, distribution, and reproduction in any medium, provided you give appropriate credit to the original author(s) and the source, provide a link to the Creative Commons license, and indicate if changes were made.
Introduction
Leukocytes and their subtypes population numbers change dramatically in the presence of infections, malig-nancies, autoimmune disorders, and chemical-induced hematotoxicity. The two categories of lymphocytes, T-cells and B-cells, are important constituents of the human immune system as their concentration, quanti-fied by a count test, indicates the state of body’s immune response against infections [1]. Currently, fluorescence-activated cells sorting (FACS) is used as golden standard
in biological research and clinical diagnostics to auto-matically determine the count or concentration for one or multiple types of cells. However, requirements of large volume sample (in the order of mL) and expensive rea-gent, bulky equipment size, sophisticated costly optical component and the requirement of technical personnel make conventional FACS prohibitive for point-of-care application. In addition, FACS is traditionally relied on non-imaging technique by laser scattering and fluores-cence emission for cell identification and hence there is no image information of cells [2]. There is a tremendous need for an automated, portable point-of-care blood cell counter that could yield results in a matter of minutes from a drop of blood without any trained profession-als to operate the instrument [3]. This technology could
Open Access
*Correspondence: [email protected]
1 Department of Micro-Nano Mechanical Science and Engineering, Graduate School of Engineering, Nagoya University, 1 Furo-cho, Chikusa-ku, Nagoya 464-8603, Japan
potentially have tremendous applications in hospitals, private clinics, retail clinics and the developing world.
In order to develop a compact leukocyte counting sys-tem, researchers are actively looking toward microfluidic devices as the platform for the next generation translat-able cell sorter. Microfluidic based devices are a proven technology for cellular handling as they can offer pre-cise spatial and temporal control in a greatly miniatur-ized platform [4, 5]. For cell isolation, there are several methods that utilize the physical characteristics of the cell [6]. Blood cells can be separated using non-inertial forces and concepts such as magnetic bead immunoas-say [7], dielectric properties [8], optical force [9], mag-netic [10], electrohydrodynamic [11], or acoustic [12, 13], as active separation strategies. The non-inertial forces may have some unexpected physiological effects on the blood component properties which are unsuitable for the downstream application of the separated products. These techniques add to the complexity of the microfluidic devices and normally run at very low flow rates. On the other hand, passive separation techniques exploit the dif-ference in size and deformability of cells in which they do not involve external forces but rely purely on the inter-action of the blood with internal geometries of microflu-idic devices [14]. The pore-based or pillar-based passive devices have simple mechanical design and can function in wide range of flow rates [15, 16], WBCs are flexible and can deform to pass through 7 µm pores. The RBCs are more flexible and can fold or align to cross the filter opening of 3–4 µm [17]. A perfect blood microfilter can trap all WBCs and pass all RBCs continuously without loss of separation efficiency at different flow rates and cell concentration.
After isolation, captured cells are usually distinguished from microfluidic chip’s fluorescent microscopy images. Using different cell markers, we can detect, identify and count cells. However, cells imaged by fluorescence microscopy exhibit heterogeneous intensity levels and are often badly contrasted. The variability of cell size and morphology, differences in illumination over time and across whole microfluidic chip hamper the ability to spec-ify a global set of parameters for cell detection algorithms over the whole experiment. Furthermore, there are seri-ous spectrum crosstalk between fluorescence dyes when performing dual or multiple cells detection. The available algorithms for illumination correction and segmentation do not perform well enough to achieve satisfying results on many experiments [18]. Therefore, there is a strong motivation for the development of an automatic cell detection and counting method [19]. A machine learn-ing algorithm, with an appropriate feature extractor for the application is the key to success. For this, Histogram of Oriented Gradients (HOG) represents a robust feature
descriptor used in computer vision area for object detec-tion [20]. One of the key advantages of HOG is being able to describe object orientation while showing invariance to geometric and photometric transformations because it operates in localized regions. In other words, HOG tends to be unaffected by changes in shapes and lighting, which appear in larger spatial regions. These advantages make HOG features fit our situation especially well due to the cells variability in intensity and shape on pillar based microfluidic chip. A support vector machine (SVM) can be used to classify HOG features. SVM is a super-vised machine learning algorithm, which creates a model according to the training data, and then the test data can be classified according to said model [21].
In this study, we propose a pillar-based microfluidic chip and system with machine-learning for T-cells and B-cells isolation and detection. The design of micropil-lar array with gradually narrowed gaps were optimized to trap leukocytes while allowing other blood cells to flow through [22]. The size and deformability-based sepa-ration of leukocytes require micropillar of proper gap size and precise control of pressure applied to the array. Under optimized conditions, a sub-microliter of whole blood was suspended in a buffer and then directly intro-duced to the micropillar array without pre-treatment such as density gradient or RBCs lysis. All leukocyte types were individually trapped between micropillars, while other elements of blood passed through the micro-pillar array into a waste reservoir. To detect T-cells and B-cells from fluorescence microscopy images, a machine learning method based on both HOG and color features was studied.
Materials and methods
Peripheral blood sample preparation
Human blood samples were collected from healthy donors at National Hospital Organization Nagoya Medical Center. The study protocol was reviewed and approved by the institutional review board, and written informed consent was obtained from all participants. The samples were collected in a collection tube with EDTA to prevent coagulation and were used within 24 h. For T-cells and B-cells detection, blood sample was mixed with a two-color direct immunofluorescence reagent (BD Simultest TM CD3-FITC/CD19-PE, BD Bioscience, San Jose, CA) and incubated in room temperature for 15 min.
A pillar‑based microfluidic chip
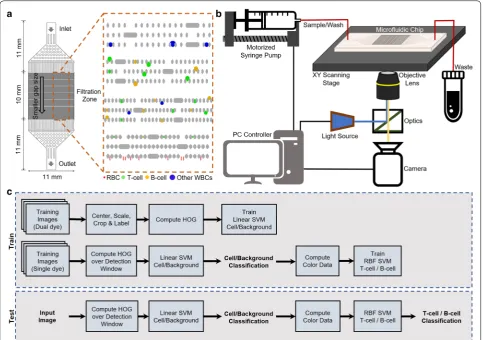
zone and leaves it at outlet port. Outlet port is for col-lecting the components of blood passing the filter. Pro-posed microfluidic chip has 12 different groups of pillar arrays [22]. Main difference between these pillar arrays is the spacing between each pillar, which we call gap size. The gap size for these 12 pillar arrays are gradu-ally decreasing in size from the inlet port to the outlet port, 15–3 µm respectively. The smallest gap size, 3 µm, can prevent leukocytes flowing away while allow red blood cells or platelets to pass through. Larger and less deformable cells are captured by pillar arrays with big-ger gaps while smaller cells flowed through, which makes this design suitable to prevent clogging. To further avoid clogging, escape routes without trap structure among pillars are designed, as Fig. 1a shows. The schematic and prototype of microfluidic chip was shown in Fig. 1b. The single inlet single outlet fabricated device was connected to a gastight syringe pump (1710 TLLX SYR, Hamil-ton, USA), which was manipulated by a high precision
578 nm). In the next section, we would present a method for detecting T-cells and B-cells in the images character-ized in this section.
Microfluidic chip fabrication
Our microfluidic chip fabrication process is based on the soft-lithography technique. We used a Si-wafer to make a master mold. The microchannel part is made of poly-dimethylsiloxane (PDMS) by using a molding process. Then, the microchannel part is bonded to a glass plate to form the microfluidic chip. First, the photomask was prepared using laser lithography (DWL66FS, Heidelberg Instruments Mikrotechnik GmbH, Heidelberg, Ger-many). We then prepared the Si-wafer (thickness 500 μm, Matsuzaki Ltd., Japan) for spin coating with an epoxy-based photoresist (SU-8 3010, Microchem, MA, USA) to the required thickness (~ 10 μm) and cured it using a soft bake (95 °C, 30 min) process. Next, the Si-wafer was exposed to UV light with the photomask using a mask aligner (Suss MA6, SUSS MicroTec, Germany). The Si-wafer was developed and dry-etched by deep reactive ion etching (RIE-800, Samco, Japan). Plasma polymeriza-tion (RIE-800, Samco, Japan) of octafluorocyclobutane (C4F8) was used for passivation of the Si-mold to make the surface non-adhesive during repeated PDMS micro-fluidic chip demolding processes. The PDMS microchan-nel part was prepared using a PDMS pre-polymer (Silpot 184, Dow Corning Toray Co., Ltd., Japan) mixed in a 10:1 (w/w) ratio with a curing agent, then pouring onto the Si-mold and baking at 85 °C for 45 min. The cured PDMS was then demolded and the PDMS microchannel part was treated with an O2 plasma (Femto Science Cute-MPR, South Korea) to complete the PDMS-glass bond-ing process.
Cell detection
The framework of object detection with HOG and color features is illustrated by the block diagram in Fig. 1c. It consists of separate training and testing phases. In the training phase, we trained two separate SVMs to detect cells from background and to identify the detected cells as T-cells or B-cells. First using the dataset that is gener-ated from the dual dyed images, a linear-kernel SVM is trained to detect cells from background. Then, the images that is dyed with only singe dye is exhaustively searched using sliding window method, finding HOG for each window and classified by the first SVM. Found cells then used for their color information to train a Radial Basis Function (RBF)-kernel SVM [21] to identify T-cells from B-cells. Although RBF-SVM is timewise costly, it gives better accuracy. In the testing phase, unseen images are scanned with sliding window and HOG features are gen-erated from the position of each window in the image.
These features are classified as cell or background with the linear SVM classifier, then classified cells are further processed to get the color information and classified as T-cells or B-cells using the RBF SVM.
The HOG and color-based features extraction will be described in the next section.
Results
In order to get an idea about how well the T-cells and B-cells are detected, it is necessary to study both SVM classifier and performance of the system as a whole.
Cell isolation
Cell isolation experiment is performed for several times, to test the performance of our system and method. The experiment condition is decided empirically [22]. First, we introduced sheath liquid (PBS with 5 mM EDTA) into the microfluidic chip to remove the bubbles. We intro-duced 1 µL peripheral blood into chip and collected the fluid out of chip in a tube. After all blood sample flowed through the chip, 30 µL sheath liquid was introduced to remove non-trapped cells. The flow rates for periph-eral blood and sheath liquid are both set to be 10 µL/ min. Then, the whole filtration part on chip was scanned frame by frame with the control of motorized stage. When scanning, T-cells and B-cells are excited (488 nm). 420 frames were captured for the whole filtration zone. Figure 2 shows partial scanned images of the filtration zone. According to the design principle, larger cells were mostly trapped in wide pillar gaps, while smaller cells, such as T-cells and B-cells, were mainly trapped in nar-row pillar gaps. As Fig. 2 shows, most T-cells (green) and B-cells (yellow) were captured in 5–8 µm gaps area.
Dataset and methodology
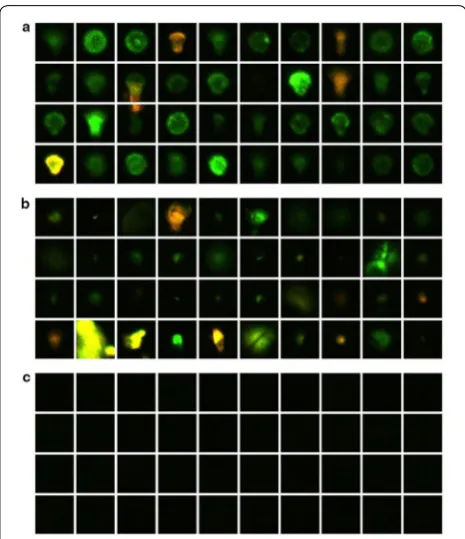
There is no standard dataset for fluorescent cell images, so we created a custom dataset to be used in our detec-tion algorithms. To train and test the detecdetec-tion of cells we used the scan images from 10 experiments that is dyed with the dual dye. Seven experiments are used as training data which consists of 2940 images. Another three exper-iments which consists of 1320 images are reserved for test. A total of 6200 cell images and 35,000 background images are gathered semi-automatically from the training images. Figure 3 shows a sample from this dataset.
then cropped and scaled. Then all the cropped images are manually checked to eliminate the misdetections and noises, which are used as hard negatives as Fig. 3b shows. After this semi-automated process, 50 training images which are dense in cells are annotated manually, also fixing the scaling of the cells when necessary. Neg-ative training samples are then automatically cropped in different scales from these annotated images. Using the positive and negative training data from this semi-automatic process the detector is trained, then annotated images are exhaustively searched for misde-tections. Found hard negatives are added to the train-ing dataset to re-train the final detector.
Crosstalk between the dyes, prevents us from manu-ally annotating the datasets to be used as training data. Hence in order to train the second SVM which identi-fies T-cells from B-cells, we used the datasets which are only dyed with one color.
HOG descriptor and color distribution features
Preparing the data set appropriately is vital for achieving good performance. Cell images are centered and scaled. Since the size of the cells vary, we upscaled them to 80 pix-els squares, with the scaling factor appropriate to the long-est side of the cell bounding boxes. A margin of 16 pixels around the cell on all four sides are included, as this bor-der provides a significant amount of context that helps
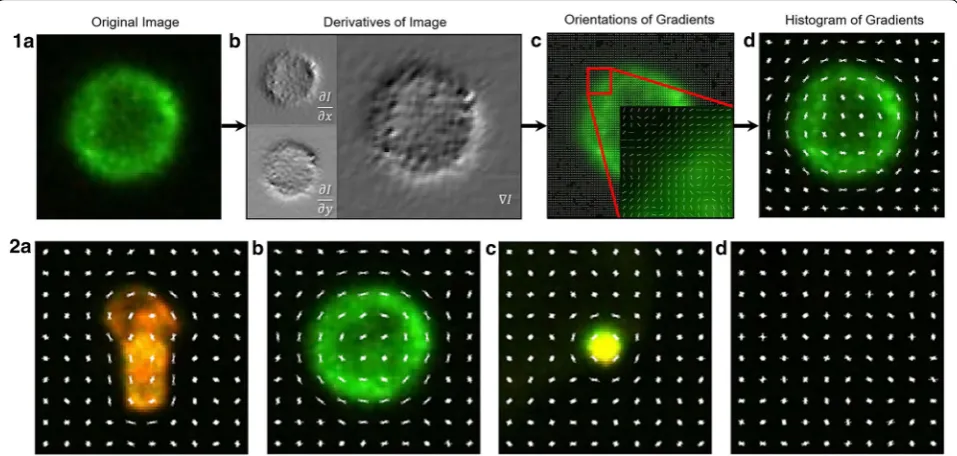
detection. As Fig. 4 shows, HOG helps us define the shape context of the cells effectively, which in return makes it possible to detect all different shapes of cells deformed by the micropillars in our study.
We computed HOG descriptors for the prepared cell samples. A HOG feature vector is modeled for such an image. Figure 4 shows step by step computation of HOG descriptors. First, one the image gradient values are deter-mined, representing directional changes in the intensity or color. The gradient vector is formed by combining the par-tial derivatives of image I in the x and y directions,
The gradients in the two directions are computed by applying the 1D centered, point discrete derivative mask in the horizontal and vertical directions,
The gradient orientations are computed using the verti-cal and horizontal gradients as,
The image I is then divided into cells, and for each cell, a local 1D histogram of gradient directions (orien-tations) is calculated over the pixels from that cell. We used nine bins for the local histogram. The histogram channels are evenly spread over 0°–180° in absolute val-ues, so each histogram bin corresponds to a 20-degree orientation interval. The obtained cell histograms are then combined into a descriptor vector of the image. First, these cells locally contrast normalized, due to the variability of illumination and shadowing in the image. That requires grouping the cells together into larger, spatially-connected blocks. Once the normalization is performed, all the histograms can be concatenated in a single feature vector, representing the HOG descriptor. Depending on the cell size and block overlap, the amount of detail one could get changes. We used [8 × 8] cell size to calculate blocks of [16 × 16] pixels with overlaps using nine histogram channels. These setting can be thought as default choice in object detection. The feature vector of
∇I=
∂
I ∂x
2
+
∂
I ∂y
2
∂I
∂x =I×
−1 0 1 ,
∂I
∂y=I×
−1
0 1
.
θ=tan−1 ∂
I ∂x÷
∂I
∂y Fig. 2 Partial scanned images of the filtration zone for T and B
the image is computed as its HOG descriptor, with 2916 coefficients.
Because the long emission spectrum tail of dyes causes overlap like with the fluorophores FITC and PE, in our T-cells and B-cells counting experiment, cells are stained by a two color (CD3-FITC/CD19-PE) immunofluores-cence dye. The color vectors for cells fluctuate in a big range. Cells can be sorted from background and noise through HOG features, but among the detected cells, it is difficult to decide the cell type when taking multicolor cell detection. To alleviate the influence of fluorescence emission spectrum crosstalk, we calibrated the color dis-tribution of FITC and PE single dye stained cells and then classified dual stained cells by the model trained from single dye stained cells color features. We stained sam-ples with single dye, FITC Mouse Anti-Human CD3 (BD Pharmingen™, BD Bioscience, San Jose, CA) for T-cells and PE Mouse Anti-Human CD19 (BD Pharmingen™, BD Bioscience, San Jose, CA) for B-cells. The single dye stained samples were introduced to the same isolation system and sorted under the same condition as dual dye stained sample. As stained by only one fluorescent dye, the detected cells’ type could be decided. We used pre-viously trained HOG detector to detect the cells and extracted the average color in RGB space for every cell in FITC and PE. After the cells are detected, an adaptive
thresholding using Otsu’s method is performed to find the cell segment [23]. Then average color in RGB is cal-culated using this thresholding as a mask. We trained an RBF kernel SVM using the color averages from single dye stained cells. This calibration needs to be performed only once. Through cross-validation, an average accuracy of 96% was achieved.
Detection results of T‑cells and B‑cells
We have created a data set to test the performance of the HOG detector. 500 positive cell images are cropped, cen-tered and scaled from the annotated test images. 50 diffi-cult examples containing noise and 450 randomly selected background examples are used as negative test set. To quantify the HOG detector performance, we plot Receiver Operating Characteristics (ROC’s), i.e. true pos-itive rate TruePos
TruePos+FalseNeg
versus false positive rate
FalsePos FalsePos+TrueNeg
. Using also this test set we calculated
accuracy, specificity and sensitivity values as:
In addition to this set of 1000 image patches, negative images from test data exhaustively searched and around 4,500,000 negative images are added to plot Detection Error Tradeoff (DET) curve on log–log scale i.e. miss rate FalseNeg
TruePos+FalseNeg
versus false positive per window
FalsePos TotalPopulation
. DET curves present the same
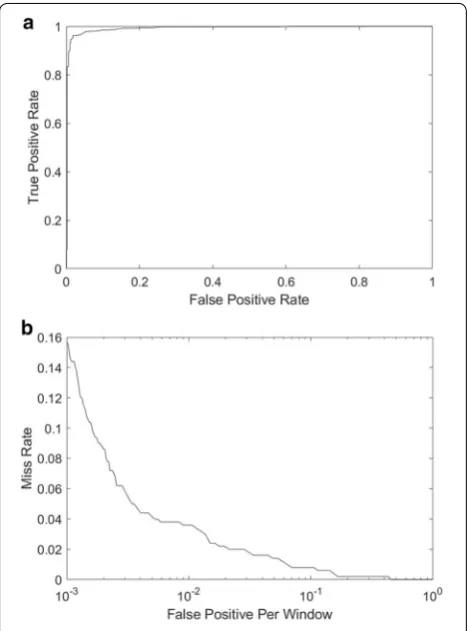
informa-tion as ROC’s but small differences in probabilities are easier to distinguish. Figure 5 presents ROC’s and DET curves.
Different points in ROC and DET curves corresponds to different accuracy, specificity and sensitivity. We have achieved an accuracy of 94% and sensitivity of 90% when specificity was chosen to be 99%.
In one experiment, 420 frames are scanned for the fil-tration zone on the microfluidic chip. With the classifi-ers trained with HOG and color distribution feature, all the 420 images were processed in 67 s with our experi-ment PC (CPU i7-8700 K 3.7 GHz, Nvidia GTX 1080Ti,
Accuracy=
TruePos+TrueNeg Total Population
Specificity=
TrueNeg TrueNeg+FalsePos
Sensitivity=
TruePos TruePos+FalseNeg
Fig. 3 Example images from the dataset. a Cell images centered and scaled. b Hard negative images, that is manually eliminated. c
64 GB RAM). We have used OpenCV libraries for HOG to perform GPU processing. Figure 6 shows the results of an example detection, although cells are of different morphology and size, all cells have been detected.
Discussion
Several methods exist for counting the cells in an image [24, 25]. The difficulty of performing the cell segmenta-tion or detecsegmenta-tion task and choosing the correct algorithm depends much on the type of cells being targeted. If the cells are well separated from each other and have uni-form intensity, simple thresholding or watershed algo-rithms are popular choices of approach. If the cells are packed together, algorithms which account for cell shape and size are preferred [26]. But in our application, the unavoidable uneven illumination over time and across the whole microfluidic chip makes the cells fluorescence intensity differs from image to image. And the cells’ shape and size were deformed by pillar structure. The intensity, shape and size features could not be utilized directly to detect cells in our pillar-based microfluidic chip system. Another approach, like the one used in this study, is to recognize cells using training-based machine learning methods. Examples of cells and background are shown to the detector, which then learns their most important characteristics. Furthermore, to detect both T-cells and B-cells in a single experiment, the emission spectrum crosstalk of these two cells’ dyes should also be overcome. In this work, cell detection from fluorescence microscope images is studied using both HOG and color distribution
features with SVM learning classifier. HOG features were utilized to distinguish cells from background noise. But HOG features could only distinguish cells from back-ground and noise, how to eliminate the crosstalk between FITC and PE emission spectrum is still a question. We evaluated the color distribution of cells solely stained by FITC or PE and trained the classifier based on the sin-gle stained cells’ color features. The classifier was used to determine the cell type when sample were stained by dual-color fluorescence (FITC and PE).
microfluidic counting system provided a fast and robust way for cell isolation and detection. Although, comparing
to expensive FACS systems, there are still problems (clog-ging and spectrum overlap) in multi-type cells sorting for current microfluidic system.
Conclusion
A pillar-based microfluidic chip with machine learning algorithm for T-cells and B-cells isolation and detection were studied in this paper. A HOG and color features based SVM classifier was proposed to overcome the dif-ficulties in cell detection process, such as fluorescence emission spectrum crosstalk, variability of cell size and morphology, differences in illumination and inconsist-ence fluorophores expressing level on living cells. We have performed numerous cell detection experiments using the detection technique provided here. The experi-ment tests performed on various image datasets, have produced satisfactory detection results that prove the effectiveness of our proposed approach. It has achieved a high accuracy of 94%, specificity of 99% and sensitivity of 90%. For T-cells B-cells detection we have achieved 96% cross-validation accuracy. The proposed method and sys-tem could also be applied to all other specific leukocytes using different stain agent. Compared to current com-mercial cell sorter, our system is low cost, small size and microfluidic chip is disposable, it has great potential as a tool for point-of-care cell sorting and analysis.
Authors’ contributions
TM, BT, WL, KH and AMN performed experiments and analysis. TM and BT prepared Figs. TM, BT and FA contributed to write the manuscript text. TM, TIS, YM and FA designed the study. All authors read and approved the final manuscript.
Author details
1 Department of Micro-Nano Mechanical Science and Engineering, Graduate School of Engineering, Nagoya University, 1 Furo-cho, Chikusa-ku, Nagoya 464-8603, Japan. 2 School of Chemistry and Chemical Engineer-ing, Beijing Institute of Technology, BeijEngineer-ing, China. 3 School of Mechatronic Engineering, University Malaysia Perlis, Perlis, Malaysia. 4 National Hospital Organization Nagoya Medical Center, Nagoya, Japan.
Acknowledgements Not applicable.
Competing interests
The authors declare that they have no competing interests.
Availability of data and materials All relevant data are within the paper.
Funding
This work was supported in part by the Japan Society for the Promotion of Sci-ence (JSPS), Project No.: 15F15757, and supported in part by START Program from Japan Science and Technology Agency, JST.
Publisher’s Note
Springer Nature remains neutral with regard to jurisdictional claims in pub-lished maps and institutional affiliations.
Fig. 5 ROC (a) and DET (b) curves for HOG detector
Received: 31 July 2018 Accepted: 20 September 2018
References
1. Costa S, Schutz S, Cornec D et al (2016) B-cell and T-cell quantification in minor salivary glands in primary Sjögren’s syndrome: development and validation of a pixel-based digital procedure. Arthritis Res Ther 18(1):21 2. Huang X, Guo J, Wang X et al (2014) A contact-imaging based
microflu-idic cytometer with machine-learning for single-frame super-resolution processing. PLoS ONE 9(8):e104539
3. Hassan U Jr, Reddy B Jr, Damhorst G et al (2015) A microfluidic biochip for complete blood cell counts at the point-of-care. Technology 3(4):201 4. Piyasena ME, Graves SW (2014) The intersection of flow cytometry with
microfluidics and microfabrication. Lab Chip 14(6):1044–1059 5. El-Ali J, Sorger PK, Jensen KF (2006) Cells on chips. Nature
442(7101):403–411
6. Shields CW IV, Reyes CD, López GP (2015) Microfluidic cell sorting: a review of the advances in the separation of cells from debulking to rare cell isolation. Lab Chip 15(5):1230–1249
7. Wu HW, Hsu RC, Lin CC et al (2010) An integrated microfluidic system for isolation, counting, and sorting of hematopoietic stem cells. Biomicroflu-idics 4(2):989
8. Agarwal S, Sebastian A, Forrester LM et al (2012) Formation of embryoid bodies using dielectrophoresis. Biomicrofluidics 6(2):24101
9. Hoi SK, Kim HV, Huy MN, Sow C-H, Ow YS, Bettiol AA (2010) Passive opti-cal separation and enrichment of cells by size difference. Biomicrofluidics 4:044111
10. Kim Y, Lee SH, Kim B (2009) Droplet-based magnetically activated cell separation: analysis of separation efficiency based on the variation of flow-induced circulation in a pendent drop. Anal Bioanal Chem 395(7):2415–2421
11. Hassan U, Reddy B Jr, Damhorst G et al (2015) A microfluidic biochip for complete blood cell counts at the point-of-care. Technology 3(04):201–213
12. Nam J, Lim H, Kim C et al (2012) Density-dependent separation of encapsulated cells in a microfluidic channel by using a standing surface acoustic wave. Biomicrofluidics 6(2):24120(1–10)
13. Liu Y, Hartono D, Lim KM (2012) Cell separation and transportation between two miscible fluid streams using ultrasound. Biomicrofluidics 6(1):12802(1–14)
14. Masuda T, Song W, Nakanishi H et al (2017) Rare cell isolation and recov-ery on open-channel microfluidic chip. PLoS ONE 12(4):e0174937 15. Hosokawa M, Asami M, Nakamura S et al (2012) Leukocyte counting from
a small amount of whole blood using a size-controlled microcavity array. Biotechnol Bioeng 109(8):2017
16. Alvankarian J, Bahadorimehr A, Yeop MB (2013) A pillar-based microfilter for isolation of white blood cells on elastomeric substrate. Biomicrofluid-ics 7(1):142–502
17. Ji HM, Samper V, Chen Y et al (2008) Silicon-based microfilters for whole blood cell separation. Biomed Microdevice 10(2):251–257
18. Buggenthin F, Marr C, Schwarzfischer M et al (2013) An automatic method for robust and fast cell detection in bright field images from high-throughput microscopy. BMC Bioinform 14(1):1–12
19. Faustino GM, Gattass M, Rehen S et al (2009) Automatic embryonic stem cells detection and counting method in fluorescence microscopy images. In: Proceedings of IEEE international conference on symposium on biomedical imaging, pp 799–802
20. Dalal N, Triggs B (2005) Histograms of oriented gradients for human detection. In: Proceedings of computer vision and pattern recognition, pp 886–893
21. Suykens JA, Vandewalle J (1999) Least squares support vector machine classifiers. Neural Process Lett 9(3):293–300
22. Noor AM, Masuda T, Lei W, Horio K, Miyata Y, Namatame M, Hayase Y, Saito TI, Arai F (2018) A microfluidic chip for capturing, imaging and counting CD3+ T-lymphocytes and CD19+ B-lymphocytes from whole blood. Sens Actuators B Chem 276:107–113
23. Otsu N (1979) A threshold selection method from gray-level histograms. IEEE Trans Syst Man Cybern 9(1):62–66
24. Kamentsky L, Jones TR, Fraser A, Bray MA, Logan DJ, Madden KL, Ljosa V, Rueden C, Eliceiri KW, Carpenter AE (2011) Improved structure, function and compatibility for CellProfiler: modular high-throughput image analy-sis software. Bioinformatics 27(8):1179–1180
25. Wiesmann V, Franz D, Held C, Münzenmayer C, Palmisano R, Wittenberg T (2015) Review of free software tools for image analysis of fluorescence cell micrographs. J Microsc 257(1):39–53