Effectiveness of ICT Programme on Teacher Self-Efficacy
(TSE) among Pre-service Teacher Educators
Hemant Lata Sharma
Leena Sharma
Abstract
The rapid development of Information and Communication Technology (ICT), particularly the Internet, is one of the most exciting developments of the Information Age. Today Information and Communication Technologies (ICT) is being used as a tool for improving the quality of life by improved efficiency and enhanced effectiveness. Teachers’ perceptions of self-efficacy are oriented to their understanding of education that changes and develops depending on the technology. In present study the researcher has made an attempt to investigate the effectiveness of ICT Programme on Teacher Self-Efficacy among Pre-service Teacher educators. For this purpose, the TSE Scale by Albert Bandura 1997 was adapted in Indian conditions. A sample of 90 pre-service teacher educators studying in Haryana Institute of Education, Bahadurgarh (Haryana) participated in the study. It has been found that ICT Programme positively affected the Teacher self-Efficacy (TSE) of pre-service teacher educators. In this regard, Effect Size, Variable Importance and Decision Tree were also made.
Keywords: ICT Programme, Teacher Self-Efficacy, Pre-service Teacher Educators.
1.1 Introduction
“ICT is a generic term referring to technologies which are being used for collecting, storing, editing and passing on information in various forms. A personal computer is the best known example of the use of ICT in education, but the term multimedia is also commonly used. Multimedia can be expounded as a combination of data carriers, for example video, CD-ROM, floppy disc, internet and software in which the probability for an interactive approach is offered. ICT is used for communication between students and teachers, in which internet, laptops and simulation are being used and as a result a variety of learning environments are possible. Teacher-centred and whole-class instruction is no longer the dominant teaching method” (Sharma & Sharma, 2018; Sharma & Madan, 2018).
1.2 Teacher Self-Efficacy
The theoretical foundation of Self-Efficacy is found in Social Cognitive Theory, developed by former American Psychological Association’s president (1974) and Stanford professor Albert Bandura (1977-1997). The term ‘self-efficacy’ is a common subject of psychological studies and tends to be used as a short hand for the beliefs that human beings have in their own ability and capacity to take action and succeed. The concept of self-efficacy is not a straightforward one (Tschannen- Moran, and Woolfolk Hoy, 2001). It is however an essential part of a theory of human development, the most prominent exponent of which is Albert Bandura. Social Cognitive Theory assumes that people are capable of human agency or intentional pursuit of courses of action, and that such agency operates in
a process called triadic reciprocal causation. Reciprocal causation is a multi-directional model suggesting that our agency results in future behaviour as a function of three interrelated forces: a) Environmental Influences; b) Behaviour and c) Internal Personal Factors such as cognitive, affective and biological processes.
Consistent with the general formulation of self-efficacy, Tschannen-Moran and Woolfolk Hoy (2001) defined “Teacher Self-efficacy as a teacher’s “judgment of his or her capabilities to bring about desired outcomes of student engagement and learning, even among those students who may be difficult or unmotivated”. The study of Teacher Self-efficacy is a little over two decades old and began with RAND researchers’ evaluation of whether teachers believed that they could control the reinforcement of their actions or not. Teacher self-efficacy cannot be easily defined, because teaching is complex and constantly evolving, and self-efficacy involves a great many traits and factors. Ashton argued that the teacher influences students, and that the intensity and ability of teachers represents their self-efficacy. Teacher Self-Efficacy includes three aspects: 1) Teaching effectively; 2) Learning abilities and 3) Professional knowledge.
Sherman and Howard (2012) further emphasize the importance of teachers’ belief for making decisions to integrate ICT in their educational activities. However, merely encouraging teachers to use ICT in daily educational practices does not realize ICT integrated education. The several internal factors of teachers should be considered, such as knowledge and skills, self-efficacy, and belief in its pedagogical value. Ertmer and Ottenbreit-Leftwich (2010) stress that having knowledge and skills is not enough to change teachers’ behaviour, unless they feel confident to facilitate student learning through those gained ICT knowledge and skills. They further claim that Teacher Self-Efficacy may be more important factor to implement technology in their classrooms. For these reasons, enhancing teachers’ self-efficacy, especially ones related to ICT use, can play important roles to bring about the change in the education practice.
Formulating research objectives in an appropriate manner is one of the most important aspects of any study. This is because research objectives determine the scope, depth and overall direction of the research. Research objectives divide the aim into several parts and address each part separately. In order to achieve the aim ‘Effectiveness of ICT Programme on Teacher Self-Efficacy (TSE) among Pre-service Teacher Educators’ following objectives were framed which would facilitate the achievement of the research goal.
1.3 Objectives of the Study
1. To compare the pre-test mean scores of control and experimental group with respect to their Teacher Self-Efficacy (TSE).
2. To compare the post-test mean scores of control and experimental group with respect to their Teacher Self-Efficacy (TSE).
3. To compare the mean gain scores of control and experimental group with respect to their Teacher Self-Efficacy (TSE).
4. To find the Effect Size of ICT on Teacher Self-Efficacy (TSE) of pre-service teacher educators of both experimental (E) and control (C) group after experimental treatment.
5. To find Variable Importance of Teacher Self-Efficacy (TSE) of pre-service teacher educators after experimental treatment.
1.4 Hypotheses of the Study
1. There exists no significance difference in pre-test mean scores of control and experimental group with respect to their Teacher Self-Efficacy (TSE).
2. There exists no significance difference in post-test mean scores of control and experimental group with respect to their Teacher Self-Efficacy (TSE).
3. There exists no significance difference in mean gain scores of control and experimental group with respect to their Teacher Self-Efficacy (TSE).
2. Methodology
2.1 Method of Research: The investigator used Experimental Method of research to conduct this study.
2.2 Design of the Study: In the present study, Non Randomized Control Group Pre-test Post-test Quasi Experimental Design was used with a purposive sample in the form of intact sections of B.Ed. class of the same college of Education.
2.3 Variables Involved: The dependent variables or the criterion variables for this study is
Teacher Self-Efficacy (TSE). Information and Communication (ICT) Programme named ICT-Enabled Instructional Package (ICT-EIP) is independent variable, which is being manipulated to study its effect on Teacher Self- Efficacy (TSE).
2.4 Population and Sample: In the present study Pre-service Teacher Educatorsof Jhajjar district studying in Teacher Training Institutes will constitute the population.
In the present study 90 pre-service teacher educators (45 in control group and 45 in experimental group) studying in two sections of Haryana Institute of Education, Bahadurgarh (Jhajjar) were taken as sample.
2.5 Tools Used: Teacher Self-Efficacy (TSE) Scale developed by Albert Bandura (1997) was adapted by the investigator in Indian Conditions. A 9-point Likert Scale is taken in the test. There are 9 choices for each item out of which only one has to be chosen; which are varying from nothing (1), very Little (2,3), Some Influence (4,5,6), quite a bit(7,8) to a Great Deal (9). There are total 38 items in the scale. Each item response is scored with a value of 1 for nothing, to all the way to 9 For a Great deal. For each construct the participants’ responses are averaged. Firstly, all items relating to different domains were framed. The initial draft contained 43 items. It was administered on a sub sample of 110 pre-service teacher educators. On the basis of Item Analysis no item was rejected and the suggestions of experts were incorporated accordingly. The draft thus contained the same 43 items. The scale then exposed to a sample of 400 pre-service teacher educators. After Item analysis, Total Correlation and Exploratory Factor Analysis 05 items were deleted. The final selected set thus contained 38 items. The final draft of the scale was administered to 400 pre-service teacher educators selected from Rohtak and Jhajjar district of Haryana by following random purposive Sampling technique. For Internal Consistency, Cronbach’s Alpha was calculated which was found to be .983. The Factorial Validity of the scale was also determined by factor analysis. The scale accounted for 74.641% of the total variance with their Eigen Values being greater than unity. The time for completing the whole test was 25 minutes only. Each item response is scored from 1 to 9. For each construct, participants’ responses are averaged. The averaged score of each construct is then added up to give the final score of Teacher Self-Efficacy (TSE) Score.
3.Results & Discussion
Objective- 1, 2 & 3 To Compare the Pre-test, Post-Test and Mean Gain Scores of Control and Experimental Group with respect to their Teacher Self-Efficacy (TSE)
To test the hypothesis that TSE score of control group (M=20.9406, SD= 1.9046) and TSE score of experimental group (M= 21.2768, SD= 2.1048) were equal before experimental treatment, a t-test was performed. Prior to conducting the analysis, the assumption of normally distributed difference score of TSE was examined. All the assumptions were considered satisfied. It was also be noted that the t(44) = 1.471, p > 0.05. Thus the null hypothesis that “There exists no significant difference between TSE scores of control and experimental group before experimental treatment” was retained. Which means the control and experimental group were same with respect to the TSE scores before the experimental treatment. To test the hypothesis that TSE scores of control group (M=14.9409, SD= 2.9084) and TSE scores of experimental group (M= 53.9070, SD= 1.8186) were equal after experimental treatment, a t-test was performed. Prior to conducting the analysis, the assumption of normally distributed difference score was examined. All the assumptions were considered satisfied. It was also be noted from the table that the t(44) = 80.225, p < 0.01. Thus the null hypothesis that “There exists no significant difference between TSE scores of control and experimental group after experimental treatment” was rejected. Which means the control and experimental group differ significantly with respect to TSE Score after experimental treatment. To test the hypothesis that mean gain score of TSE control group (M= -5.999, SD=3.3325) and TSE experimental group (M= 32.6301, SD= 2.7723) were equal after experimental treatment, a t-test was performed. Prior to conducting the analysis, the assumption of normally distributed difference score was examined. All the assumptions were considered satisfied. It was also be noted from the table that the t(44) = 70.291, p < 0.01. Thus the null hypothesis that “There exists no significant difference between mean gain scores of TSE of control and experimental group after experimental treatment” was rejected. Which means the control and experimental group differ significantly with respect to mean gain scores of TSE after experimental treatment.
Table-1: t-values for Pre-test, Post-Test and Mean Gain Scores of TSE of Experimental and Control Group of Pre-service Teacher Educators
Objective-1 (Pre-test)
Group N Mean S.D. t-value p-value (sig. Value) Total TSE
(C)
45 20.9406 1.9046
1.471 .148
Total TSE (E)
45 21.2768 2.1048
Objective-2 (post-test)
Group N Mean S.D. t-value p-value (sig. Value) Total TSE
(C)
45 14.9409 2.9084
80.225 .000
Total TSE(E)
45 53.9070 1.8186
Objective-3 (Mean Gain)
Group N Mean S.D. t-value p-value (sig. Value) Total TSE
(C) 45 -5.9996 3.332
70.291 .000
Total TSE
The findings are supported by Mishne, Jenith (2012) who revealed that Technology Knowledge was a statistically significant predictor of Teacher Self-Efficacy. The findings of Adams, Susan Christine (2016) publicized that Tech Buddy Program is a viable option for increasing comfort and self-efficacy levels of ICT integration into curriculum. The above findings are in accordance with Wells (2000) who revealed that high users of technology were found to have higher sense of teacher self-efficacy. Anderson (2012) also showed that the self-efficacy of professional development in teaching was found to be positively correlated with the integration of technology. Further from the above finding it was found that there exists a negative mean gain of control group (before and after experimental treatment). This finding is also supported by Burton (1996). He revealed that there exists a statistically significant negative correlation between the use of instructional methods (without computers) and teacher self-efficacy. He further added that two-third of the teachers did not use computers during instructions. Therefore, it is safe to conclude that the sense of teacher self-efficacy gets lower in the absence of integration of technology during instruction.
Objective-4 Effect Size of ICT-EIP on TSE Scores of Experimental and Control Group of Pre-service Teacher Educators
“Effect Size is a straightforward method for measuring the difference between two groups that has much recompense over the utilization of some treatment of statistical significance alone. Effect size underlines the extent of the difference as contrary to significant difference only. It is easy to understand and comprehended and can be connected to any deliberate result in Education or Social Science. It is especially significant for evaluating the efficacy of a specific intervention (treatment), in respect to some experimentation. Effect size is a standardized, scale free measure of the relative size of the impact of an intervention (treatment). Understandings of Effect size for the most part relies upon the suppositions that “control” and “experimental” group values are normally distributed. Cohen (1969) depicts an impact size of 0.2 as 'little'; an impact size of 0.5 is portrayed as "medium" and is 'sufficiently substantial to be noticeable to the bare eye'. Cohen further portrays an effect size of 0.8 or more noteworthy as ‘largely noticeable’ and hence magnanimous” (Sharma & Sharma, 2018).
Table-2: Effect Size of ICT-EIP on TSE Scores of Experimental and Control Group of Pre-service Teacher Educators after Experimental Treatment
Group N Mean S.D. d-value or
Effect Size
Type of Effect
Total TSE (C) 45 14.9409 2.9084
11.959 Large
Total TSE (E) 45 53.9070 1.8186
educators in control group were below to the average pre-service teacher educators in experimental group.
Objective-5 Variable Importance of TSE of Pre-service Teacher Educators
“A data set can contain a large number of predictors. Some predictors are useful for predicting the response variable, and others are not. Variable importance is an indication of which predictors are most useful in predicting the response variable. The variable importance percentage reflects the contribution of each variable in predicting the target variable” (Sharma & Sharma, 2018).
Table-3: Variable Importance of TSE of Pre-service Teacher Educators after Experimental Treatment
Variable
R-square
Df F-value p-value Variable
Importance
Decision Making Efficacy 0.441022 1 33.92605 <.0001 44%
Efficacy to Create Positive
Institutional Climate 0.329998 1 60.52881 <.0001 33%
Disciplinary Self-Efficacy 0.108816 1 37.12788 <.0001 11%
Efficacy to Parental
Involvement 0.071314 1 58.39304 <.0001 7%
Efficacy to Community
Involvement 0.016426 1 19.75752 <.0001 2%
Instructional Self-Efficacy
0.020145 1
62.33718 <.0001 2%
Efficacy for Motivation 0.01228 1 . . 1%
Total TSE 100%
From above table, it is clear that Decision Making Efficacy (DM) is the most significant in predicting the Total Teacher Self-Efficacy (target variable). It has a variable importance of 44%. Also, it can be interpreted from the same table that Efficacy for Motivation (EM) is the least significant predictor of Total Teacher Self-Efficacy. The variable importance of all the predictors of Total Teacher Self-Efficacy in descending order is as follows:
Decision Making Efficacy (44%) > Efficacy to Create Positive Institutional Climate (33%) > Disciplinary Self-Efficacy (11%) > Efficacy to Enlist Parental Involvement (7%) > Efficacy to Enlist Community Involvement (2%) > Instructional Self-efficacy (2%) > Efficacy for Motivation (1%)
Objective-6 Development and Interpretation of Results from Decision Tree of Teacher Self-Efficacy (TSE) at Post-test Stage
quantitative and subjective information can be suited in choice tree development. Choice trees transform crude information into an expanded learning and they empower you to convey the learning in a straightforward, yet effective arrangement of comprehensible standards. Decision Tree of Teacher Self-Efficacy (TSE) at Post-test Stage is shown below:
Fig.- 1Decision Tree of TSE
The figure-1 depicts the Decision Tree of Teacher Self-Efficacy (TSE). Node-1 represents the root node (Total TSE). It is clear from the above diagram that Decision Making Self-Efficacy and Self-Efficacy to Create Positive Institutional Climate are two main predictors that are contributing the most towards Total TSE. Also we can interpret from Node-2 of the diagram that if average DM < 7.5 then we can predict that Total TSE Score will be 52.4451. Node-3 represents the otherwise condition and predicted value of Total TSE will be 55.1862. Node-4 represents that if avg. DM< 7.5 and avg. ECPS < 7.675then the predicted value of Total TSE will be 51.6873. Otherwise condition is represented bybNode-5 which predicts a Total TSE of 53.2787. Node-6 represents that if avg. DM >= 7.5 and avg. ECPS < 7.725 then the predicted value of Total TSE will be 54. 2494 and the otherwise condition is represented by Node-7 which will predict a total of 55.9708.
Conclusion
References
Adams, Susan Christine (2016)Improving Teacher Comfort Levels and Self-Efficacy with Technology Integration and Application of Technology into the Elementary Education Curriculum through the Tech Buddy Program by Ed.D., Lindenwood University, 2016, 150; 10120866
Anderson, C., (2012). The experience of power: Examining the effects of power on approach and inhibition tendencies. Journal of Personality and Social Psychology, 83, 1362–137.
Blurton,C (1996).,“New Directions of ICT-Use in Education”.Available online http://www.unesco.org/education/educprog/lwf/dl/edict.pdf;accessed 7 August 21996.
Edwards, J. L., Green, K. E., & Lyons, C. A. (2002). Personal empowerment, efficacy, and environmental characteristics. Journal of Educational Administration, 40(1), 67-86(20). Ertmer, P. A.,&Ottenbreit-Leftwich (2010). Technology-using teachers: Comparing perceptions of exemplary technology use to best practice. Journal of Research on Technology in Education, 33(5). Retrieved April 6, 2009, from http://www.iste.org/Content/NavigationMenu/Publications/JRTE/Issues/Volume_331/Num ber_5_Summer_2001/Technology_Using_Teachers_Comparing_Perceptions_of_Exemplar y_Technology_Use_ to_Best_Practice,_Part_I1.htm
Mishne, Jenith (2012), Mishne, Jenith. Pepperdine University, ProQuest Dissertations Publishing, 2012. 3503821. An investigation of the relationships between technology use and teachers' self-efficacy, knowledge and experience.
Sharma, H. and Sharma, L. (2018). Effectiveness of ICT Programme on Technological, Pedagogical & Content Knowledge (TPACK) among Pre-service Teacher Educators. International Journal of Research in Social Sciences, 8(6(1), pp.30-42.
Sharma, H.L. and Madan, M. (2018).Multi-Media Teaching Programme (MMTP) for Teaching of English: A Trenchant Tool for enhancing Student Achievement.International Journal of Research in Social Sciences, 8,7(1),121-130.
Sherman and Howard (2012) Sherman, K., & Howard, S. K. (2012, March, 05, 2012). Teachers’ Beliefs about First- and Second-Order Barriers to ICT Integration: Preliminary Findings from a South African Study. Paper presented at the Society for Information Technology & Teacher Education International Conference 2012, Austin, Texas. S
Tschannen-Moran & Hoy (2001), Tschannen-Moran M, Wool folk Hoy W,K (1998) Teacher Efficacy Its meaning and measure. Review of Educational Research, 68 (2), P (202-248)
Wells, E. C. (2010). Michigan State University Extension educators’ perceptions of the use
A study on awareness of organic food products with reference to
Trichirappalli City
Ms. Mary Suthanthira Malar
Abstract
Food is necessary to all human being and animals, animals fitting to eat another. Human beings need food but not fitting like animals. Human beings are knows the techniques to cultivate food for them. Population is increasing day by day, the human beings are living together with more comfortable. The data collected from the consumers during the month of September 2018 to November 2018. The researcher has been taken 150 samples in Trichirappalli city. the researcher adopted convenient sampling method. The researcher concluded that, all the organic products are not available in the cities, major cities in India only having the organic food products. Consumers are in the situation to consumer the organic products to live with good health. Consumers are turn to organic products for good health. The farmers should produce more organic food products and sell with organic logo; consumers should educate to identify the organic products. Government should support the farmers to cultivate organic products.
Introduction
Food is necessary to all human being and animals, animals fitting to eat another. Human beings need food but not fitting like animals. Human beings are knows the techniques to cultivate food for them. Population is increasing day by day; the human beings are living together with more comfortable. According to the population increase the cultivation increasing, but the normal cultivation was not enough to meet out the population. The research helps to cultivate more i.e. hybrid. The storage facilities are helps to get the fruits and vegetables in all periods. The transportation is helps to get the products from other states and other countries. The manufacturing products are more durable, it reaches the entire world. Agricultural products are also has limited durability and reach the all the places because of sound transportation and storage facilities. The agriculturalist using more fertilizers to cultivate more products, these fertilizers spoil the land and water, the consumers should wash the fruits and vegetable if they get these products. The hybrid and fertilized food products affect the human being health. Hybrid eatable products are not good to human beings. Now the entire world is turns to organic because of health issues because of hybrid products. The seeds and cultivation methods are available to go far organic. The organic cultivation takes more time the yield also less in the beginning and the cultivation period is long. The farmer has to wait for long time to take the entire yield; it is the major problem in organic. The farmer are fixing high price for the organic food products. The people those are having good income, come to organic food products. Organic food products has the license and logo, it helps the public to identify the organic products.
The awareness leads to consumption, it marketers major duty is to create awareness of their products. Media helps the marketers to create awareness; they spend more money for
advertisement and create awareness. The health issues of human being are also creating awareness, but it is not for products. This awareness spread by friends and relatives, it is because of love and affection. The social media helps to spread the news to their relatives and friends. The organic products also need more awareness; the consumers should demand the products, then only the shop keeper makes the products available. So, the awareness is major for all business. This study conducted by the researcher to find the level of awareness of organic food products with reference to Trichy.
Objectives of the study
The following are the importance of the study
1. To present the socio economic profile of the sample respondents
2. To measure the level of awareness of organic food products.
Score of the study
The marketers spend more money to create awareness; the awareness leads for more sales. The advertisement helps them to create awareness. But the farmers could not do the awareness, the socio media and organic logo helps the consumers to identify. This study conducted in Coimbatore city to measure the level of awareness of organic food products.
Period of the Study
The data collected from the consumers during the month of September 2018 to November 2018.
Sampling Design
The researcher has been taken 150 samples in Trichirappalli city. The researchers visit the organic shops to identify the customers, because it is very impossible to identify the customers at their residence. The researcher has given importance to all level of income group and gender. It will help the researcher to represent the sample as the entire population about the study area. With the above points the researcher adopted convenient sampling method.
Tools and techniques
The researcher applied percentage analysis to present the socio economic profile of the sample respondents and used five point likert scales to present
Analysis and interpretation
Table 1: Socio Economic Factors – Percentage Analysis
Variable
Number of Respondents
(%)
Variable
Number of Respondents
(%)
Age Up to 30 years
37 (24.67%) Gender Male 71 (47.33%)
31 years to 50 years
67 (44.67%) Female 79 (52.67%)
Above 51 years
46 (30.67%) Monthly income
Up to Rs. 20,000
32 (21.33%)
Family pattern
Joint 64 (42.67%) Rs. 20,001 to Rs. 40,000
73 (48.67%)
Nuclear 86 (57.33%) Above Rs. 40,000
45 (30.00%)
Educational Qualification
School level 12 (8.00%) Marital Status
Married 123 (82.00%) Under
graduate
84 (56.00%) Unmarried 27 (18.00%)
Post
graduate and others
54 (36.00%) Area of residence
Urban 94 (62.67%)
Sample 150 Rural 56 (37.33%)
Source: Survey data
The researcher collected the socio economic factors of the sample respondents to know the sample respondents. Thirty seven (24.67%) respondents are below 30 years old. Sixty seven (44.67%) respondents are between 31 years and 50 years and remaining forty six (30.67%) respondents are above 51 years old. Majority of the respondents are between 31 years to 50 years old.
Sixty four (42.67%) respondents are joint family and remaining eighty six (57.33%) respondents are nuclear family. Majority of the respondents are nuclear family.
Twelve (8.00%) respondents are studied school level. Eighty four (56.00%) respondents are undergraduates and remaining fifty four (36.00%) respondents are post graduates and other degree courses. Majority of the respondents are undergraduates.
Seventy one (47.33%) respondents are male and remaining seventy nine (52.67%) respondents are female. Majority of the respondents are female. It shows that the female only visit the shops and buy organic products than male. Majority of the respondents are female.
Thirty two (21.33%) respondents’ monthly income is up to Rs. 20,000. Seventy three (48.67%) respondents’ monthly income is between Rs. 20,001 and Rs. 40,000 and remaining forty five (30.00%) respondents’ monthly income is above Rs. 40,000. Majority of the respondents’ monthly income is between Rs. 20,001 and Rs. 40,000. Majority of the respondents’ monthly income is between Rs. 20,001 and Rs. 40,000.
Ninety four (62.67%) respondents are staying in urban and remaining fifty six (37.33%) respondents are staying in rural area. Majority of the respondents are staying in urban areas.
Table 2: Level of awareness of Commodity Level of Awareness
of Commodity
Number of respondents Percentage
Low 14 9.33
Medium 51 34.00
High 37 24.67
Total 150 100
Source: Survey data
The researcher has taken five organic products under commodity to find the level of awareness i.e. tea, coffee, rice, wheat and cereals. Out of one hundred and fifty sample respondents, fourteen (9.33%) respondents have low level of awareness of organic commodity. Fifty one (34.00%) respondents are have medium level of awareness of organic commodity and remaining thirty seven (24.67%) sample respondents are have high level of awareness of organic commodity. Majority of the respondents are medium level of awareness of organic commodity.
Table 3: Level of awareness of Spices Level of Awareness
of Spices
Number of respondents Percentage
Low 29 19.33
Medium 87 58.00
High 34 22.67
Total 150 100
Source: Survey data
The researcher has taken twelve organic products under spices to find the level of awareness. i.e. cardamom, black pepper, white pepper, ginger, turmeric, vanilla, tamarind, clove, cinnamon, nutmeg, mace and chili. Out of one hundred and fifty sample respondents, twenty nine (19.33%) respondents have low level of awareness of organic spices. Eighty seven (58.00%) respondents are have medium level of awareness of organic spices and remaining thirty four (22.67%) sample respondents are have high level of awareness of organic spices. Majority of the respondents are highly aware of organic spices.
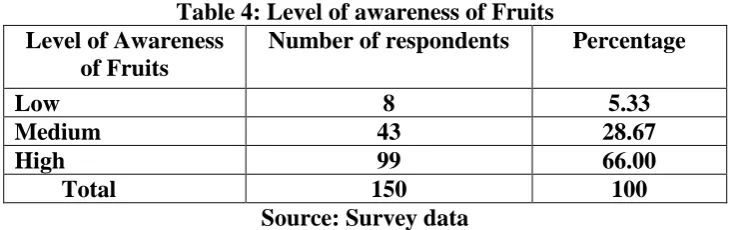
Table 4: Level of awareness of Fruits Level of Awareness
of Fruits
Number of respondents Percentage
Low 8 5.33
Medium 43 28.67
High 99 66.00
Total 150 100
Source: Survey data
awareness of organic fruits. Forty three (28.67%) respondents are have medium level of awareness of fruits and remaining ninety nine (66.00%) sample respondents are have high level of awareness of organic fruits. Majority of the respondents are high level awareness of organic fruits.
Findings
The following are the findings of the study, which are taken from percentage analysis and level of awareness.
1. Majority of the respondents are between 31 years to 50 years old.
2. Majority of the respondents are nuclear family.
3. Majority of the respondents are undergraduates.
4. Majority of the respondents are female.
5. Majority of the respondents’ monthly income is between Rs. 20,001 and Rs. 40,000. 6. Majority of the respondents are married.
7. Majority of the respondents are staying in urban areas.
8. Majority of the respondents are medium level of awareness of organic commodity.
9. Majority of the respondents are highly aware of organic spices.
10.Majority of the respondents are high level awareness of organic fruits.
Suggestions
The following are the suggestions given by the researcher from this study.
1. Selling products are business to the whole sellers and retailers, the seller may sell the hybrid food products in the name of organic. Consumers are in need of more knowledge to identify the organic products.
2. The farmers should be educates to cultivate the organic food products. The fertilizers are important to get more yields. The farmers should understand the types of fertilizers and utilization of fertilizers. It will help the farmers to cultivate the organic food products.
3. Consumers are in need of more knowledge to identify the organic food products, organic food products are has organic logo, and the consumers should educate to differentiate the organic and conventional food products.
Conclusion
Reference
1. Alam, Anwar and Wani Shafiq, A. (2003) Status of organic agriculture worldwide–An overview, In: Proceedings of National Seminar on Organic Products and their Future Prospects, Sher-e-Kashmir, University of Agricultural Sciences and Technology, Srinagar, pp. 95-103.
2. Cacek, Terry and Linda, Langer L. (2009) The economic implications of organic farming, American Journal of Alternative Agriculture, (June): 1-9.
3. Chhonkar, P.K. (2003) Organic farming science and belief, Journal of the Indian Society of Soil Science, 51(4): pp. 365-377.
4. Ramesh, P., Singh, Mohan and Subba Rao, A. (2005) Organic farming: Its relevance to the Indian context, Current Science, 88(4).
Economics of Redgram cultivation on mutually aided
cooperative society (MACS) and non-mutually aided
cooperative society (non-MACS) farms in Anantapur district of
Andhra Pradesh
D.RAFI
P.JOSHNA
Abstract
Credit is important for development and poverty alleviation. Agricultural co-operatives organise, promote and market, processing and storage of agricultural, horticultural and forest produce. The Andhra Pradesh Mutually Aided Co-operative Societies Act (APMACS) 1995 implemented in the state of Andhra Pradesh has rectified a number of restrictive provisions of the earlier co-operative law in Andhra Pradesh. Anantapur is the leading district in Rayalaseema regarding mutually aided cooperative societies (MACS) where 3472 mutually aided cooperative societies exists. The total cost of cultivation per hectare of redgram was Rs. 25,216 on MACS and Rs. 25,605 on non-MACS farms On an average, the yield of main product per hectare of groundnut was 14.02 and 15.69 Q. Return per rupee of expenditure was Rs. 1.44 and Rs. 1.41 for MACS and non-MACS farms respectively.
Keywords: credit, cooperatives, mutually-aided, development
Introduction
Addressing poverty is the most significant challenge in this millennium, as clearly reflected in the millennium development goals. Credit is important for development and poverty alleviation. It enables farmers and entrepreneurs to undertake new investments or to adopt new technology (Khandker and Faruquee, 2003) [2]. Agricultural co-operatives organise, promote and market, processing and storage of agricultural, horticultural and forest produce. They distribute agricultural machinery undertake wholesale, retail and foreign trade. Effectively, major agricultural processing, distribution, supplies and agro-marketing across India are carried on through cooperatives. The Co-operative Societies Act and its state counterparts did not provide a very enabling framework for emergence of business enterprises owned, managed and controlled by the members for their own development. Several state governments, therefore, have enacted the Mutually Aided Co-operative Societies (MACS) Act for enabling promotion of self-reliant and vibrant co-operative societies based on thrift and self-help. The Andhra Pradesh Mutually Aided Co-operative Societies Act (APMACS) 1995 implemented in the state of Andhra Pradesh has rectified a number of restrictive provisions of the earlier co-operative law in Andhra Pradesh. In the recent years, the focus of the Government of India, state governments and the various development agencies has been towards producer companies. The collectivization of producers, specifically marginal and small farm holders into producers’
organizations is emerging as the effective possible pathway to address improved access to investments, technologies, knowledge support, inputs and markets. Many of the non-governmental organizations (NGOs) in the country had been facilitating formation of co-operatives and farmer producer organizations. In the recent years some of them have graduated to facilitate formation of MACS and producer companies on behalf of state governments and developing funding agencies.
Against this background the present study has been taken up to estimate economics of redgram cultivation on MACS and non-MACS farms in Anantapur district of Andhra Pradesh.
Material and Methods
The present study was conducted in Andhra Pradesh state. Purposive-cum-random sampling technique was employed for the selection of sample in the present study. Anantapur is the leading district in Rayalaseema regarding mutually aided cooperative societies (MACS) where 3472 mutually aided cooperative societies exists. Hence, Anantapur district was purposively selected. The list of the mandals along with corresponding number of MACS farmers was prepared. One mandal from the district with maximum number of MACS farmers was selected purposively. The list of 25 villages covered by the MACS in selected mandal was prepared and 10 villages were randomly selected for the present study. From the selected villages 60 MACS and 40 non-MACS farmers were randomly selected. The required data for the study were collected from the selected farmer snusing a pre-tested schedule for the agricultural year 2017-18.
Tools and techniques of analysis
Simple arithmetic averages and percentages were worked out to arrive at costs, returns and farm efficiency measures.
Cost concepts
Cost A1: It includes: Value of hired human labour, value of hired and owned animal labour, value of hired and owned machine labour, value of seed (both farm seed and purchased), value of manures (owned and purchased) and fertilizers, depreciation on fixed assets, irrigation charges, land revenue, interest on working capital and miscellaneous expenses.
Cost A2: Cost A1 + rent paid for leased in land.
Cost B1: Cost A1+ interest of fixed capital (excluding land)
Cost B2: Cost B1 + rental value of owned land + rent for leased in land. Cost C1: Cost B1 + imputed value of family labour.
Cost C2: Cost B2 + imputed value of family labour.
Cost C3: Cost C2+ 10 per cent of cost C2 as management cost.
Farm efficiency measures
Farm business income = Gross income – Cost A1 Family labour income = Gross income – Cost B2 Net income = Gross income – Cost C3
Farm investment income = Farm business income – imputed value of family labour (or) Net income + imputed rental value of owned land + interest on owned fixed capital invested
Results and Discussions
depends up on the cost structure, output and returns. Costs include the expenditure on various inputs and input services employed in the production process.
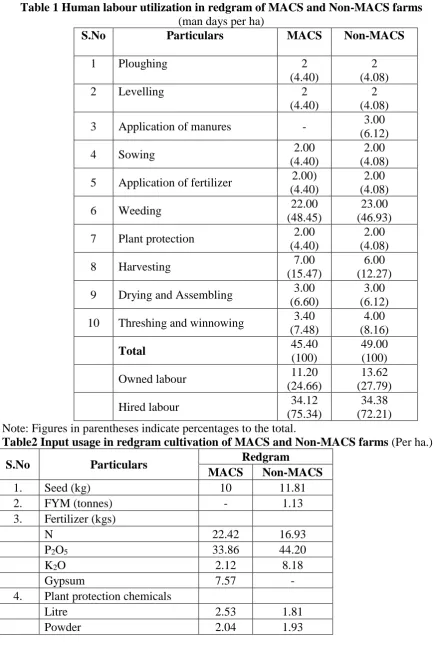
It is observed from Table1 that on an average 45.4 mandays were utilized per hectare by MACS and 49 mandays on redgram control sample. Among different operations of labour use, weeding and harvesting were the maximum labour absorbing operations. Weeding was undertaken by the farmers to keep the redgram field weed free employing 22 mandays per hectare on MACS farms and 23 mandays on control sample farms. In the study area redgram crop was harvested both manually and with machinery. This operation required 7 mandays per hectare for MACS farms, while 6 mandays were utilized by control sample farms. The ploughing and levelling of land was done by the machinery and the participation of human labour in this operation was found to be negligible. The application of farm yard manure to improve productivity of the soils required human labour to the extent of 3 mandays on control sample farms. The human labour required for sowing operation was 2 mandays each for MACS and non-MACS farms. For the application of fertilizers, 2 mandays each for MACS and control sample farms were needed. In order to control the pests and diseases, farmers had undertaken plant protection measures. For this activity 2 mandays each for MACS and non-MACS farms were used. Drying and assembling required 3 mandays for each of MACS farms and non-MACS farms.
It is seen from Table2 that the MACS farmers used 10 kg of seed per ha. While MACS farmers, 11.81 kg. FYM was not applied by the MACS members while in non-MACS members applied 1.13 kg. Coming to fertilizers usage, the quantity of N, P2O5 and K2O were to the extent of 22.42, 33.86 and 2.12 kg per hectare respectively by MACS members while the use of same on the non-MACS farms was of the order 16.93, 44.2 and 8.18 kg respectively. Gypsum was applied to an extent of 7.57 kg by MACS members while the same was not applied by non-MACS members. Application of pesticides was almost the same on the farms of MACS as well as non-MACS.
costs were land revenue, depreciation and interest on fixed capital.
It is clear from Table4 that there was no leasing in activity among the selected farmers and hence the cost A1 and cost A2 were the same. On an average, the total cost of cultivation (Cost C2) was more or less the same on MACS and non-MACS farms with Rs. 25,216 and 25,605 respectively.
The details of physical output and gross returns per hectare of redgram crop are presented in Table5. On an average, the yield of main product per hectare was 6.29 and 15.69 quintals on MACS and non-MACS farms respectively. The MACS and non-MACS farms realized a gross income of Rs. 34,264 and Rs. 29,091 respectively. The net income was higher on MACS with Rs. 9,048 compared to Rs. 3,486 on non-MACS farms. The higher income for MACS is due to more price per quintal i.e. Rs. 5,450 for their produce while for non-MACS it is Rs. 4,950. It was noticed that the productivity was more or less the same on both MACS to non-MACS farms. MACS farms realized higher net income in cultivation of rainfed redgram in the study area.
The average total costs (ATC) to produce one quintal of redgram were Rs. 4,010.95 on MACS farms, while it was Rs. 4,312.82 on non-MACS farms (Table6). The price per quintal was more on MACS farms with Rs. 5,450 compared to Rs. 4,900 on non-MACS farms. This is because the MACS farmers sell their produce through auction centers of A.F at the minimum support price, while non-MACS farmers sell their produce to middle men in the village itself. The returns per quintal were more on MACS farms with Rs. 1,440 compared to Rs. 588 on non-MACS farms.
The gross income realized on MACS farms was higher with Rs. 34,264 as against Rs. 29,091 on non-MACS farms (Table .7). This is because that the MACS farmers were paid Rs. 5,450 per quintal, while in non-MACS farmers it was Rs. 4,950. Net income too exhibited similar trend, with MACS recording Rs. 9,048 against Rs. 3,486 by non-MACS farms. Though the gross income was a measure to assess the efficiency of the farm business, but it alone does not help us to read the success of the farm business. Therefore another measure namely farm business income which indicates returns to owned resources like land, capital and labour was estimated. MACS farmers were distinctly superior to non-MACS farmers in getting maximum productivity out of these resources. It was Rs. 15,061 on MACS farms and Rs. 9,074 on non-MACS farms. MACS farms were able to secure Rs. 1.35 per every rupee spent, while non-MACS farm received Rs. 1.13.
Table 1 Human labour utilization in redgram of MACS and Non-MACS farms
(man days per ha)
S.No Particulars MACS Non-MACS
1 Ploughing 2
(4.40)
2 (4.08)
2 Levelling 2
(4.40)
2 (4.08)
3 Application of manures - 3.00 (6.12)
4 Sowing 2.00
(4.40)
2.00 (4.08)
5 Application of fertilizer 2.00) (4.40)
2.00 (4.08)
6 Weeding 22.00
(48.45)
23.00 (46.93)
7 Plant protection 2.00 (4.40)
2.00 (4.08)
8 Harvesting 7.00 (15.47)
6.00 (12.27)
9 Drying and Assembling 3.00 (6.60)
3.00 (6.12)
10 Threshing and winnowing 3.40 (7.48)
4.00 (8.16)
Total 45.40
(100)
49.00 (100)
Owned labour 11.20 (24.66)
13.62 (27.79)
Hired labour 34.12 (75.34)
34.38 (72.21) Note: Figures in parentheses indicate percentages to the total.
Table2 Input usage in redgram cultivation of MACS and Non-MACS farms (Per ha.)
S.No Particulars Redgram
MACS Non-MACS
1. Seed (kg) 10 11.81
2. FYM (tonnes) - 1.13 3. Fertilizer (kgs)
N 22.42 16.93
P2O5 33.86 44.20
K2O 2.12 8.18
Gypsum 7.57 -
4. Plant protection chemicals
Litre 2.53 1.81
Table3 Cost of cultivation of redgram component wise on MACS and Non-MACS farms (in rupees per ha)
S.No Particulars Redgram
MACS Non-MACS 1
a. Human Labour 6216
(25)
6755 (26)
Owned 1696
(7)
2044 (8)
Hired 4519
(18)
4711 (18)
b. Machine power 9073
(36)
8725 (34)
owned 1240
(5) -
Hired 7833
(31)
8725 (34)
c Seed 550
(2)
676 (3)
d Manures and fertilizers 2055
(8)
3615 (14)
Manure - 1137
(4)
Fertilizer 2055
(8)
2479 (10)
e Plant protection chemicals 1675
(7)
1642 (6)
f Interest on working capital 368
(1)
399 (2)
Total operational costs 19936
(79)
21812 (85)
2
Land revenue 150
(1)
150 (1)
rental value of owned land 3500
(14)
3500 (14)
depreciation 813
(3)
99 (0.3)
Interest on fixed capital 818
(3)
44 (0.1)
Total fixed costs 5281
(21)
3793 (15)
3 Total costs 25216
(100)
25605 (100)
Table4 Cost concepts in redgram production on MACS and Non-MACS farms
(Rupees per ha)
S.No Particulars Redgram
MACS Non-MACS
1 Cost A1/ A2 19203 20017
2 Cost B1 20021 20061
3 Cost B2 23521 23561
4 Cost C1 21717 22105
5 Cost C2 25216 25605
6 Cost C3 25873 25917
Note: Figures in parentheses indicate percentages to the total
Table5 Output and returns per hectare of redgram on MACS and non-MACS farms
S. No Particulars Units Redgram
MACS Non-MACS
1. Yield in Physical terms
a. Main Product Quintals 6.29 5.94
b. By-Product Cart Loads - -
2. Monetary Units
a. Main Product Rs. 34264 29091
b. By-Product Rs. - -
3. Gross Returns Rs. 34264 29091 4. Cost of Cultivation Rs. 25216 25605
5. Net Returns Rs. 9048 3486
6. Returns per rupee of
Expenditure Rs. 1.35 1.13
Table6 Costs of production per quintal of redgram in MACS and non-MACS farms
(rupee per quintal)
S.No Particulars Redgram
MACS Non-MACS
1. Costs
a. Average variable costs (AVC) 3170 3673 b. Average Fixed costs (AFC) 839 638 c. Average Total costs (ATC) 4010 4312
2. Price per quintal 5450 4900
Table7 Measures of farm income in redgram production on MACS and non-MACS farms (Rupee per ha)
S. No Particulars Redgram
MACS Non-MACS
1 Gross income 34264 29091
2 Net income 9048 3486
3 Farm Business Income 15061 9074 4 Family Labour Income 10743 5530 5 Farm Investment Income 12709 6718 6 Returns per rupee of expenditure 1.35 1.13
References
1. Asmatoddin M, Jawale SV, Perke DS. Economic analysis of pulses on medium farms in Marathwada region ofMaharashtra Agriculture update; 2009; 4: ¾:262-265.4.
2. Biradar B. Rajkumar. Economics of redgram based cropping in Bidar district M.Sc (Agri) Thesis (Unpublished), submitted to University of Agricultural Sciences, Dharwad, 2007.
3. Khandker SR, Faruquee RR. The impact of farm credit in Pakistan. Agricultural Economics. 2003; 28(3):197-213.
4. Thomber AP, Ghulghule JN, more. Constraints faced by pulse growers in production and marketing and suggestions made by them in Marathwada region of Maharastra. Department of Agri. Economic, Marathwada Agricultural University, Parbhani (M.S.), India.Agriculture. 2009; 4: ½:73-75.
5. Shiferaw B, Hellin J, Muricho G. Market access and agricultural productivity growth in developing countries: Challenges and opportunities for producer organizations. Economic Democratization. 2016; 5:103-124.
Role of Self Efficacy In The Job Satisfaction Of Employees
Dr. BinduAntoOllukkaran
Dr. Sunanda.C
Abstract:Satisfied employee is an asset to any organization. Job satisfaction is a way of
feeling of fulfilment that one gets on performing or doing one’s job. Hence the present study was conducted to study the role of self efficacy in improving job satisfaction. For this, data regarding the job satisfaction and also self efficacy were collected from the employee in service sector. In the present sample the employees are having high level of self efficacy and high level of job satisfaction. They are lacking in satisfaction about pay scales and the advices given by their supervisors. Significant positive correlation (r = 0.658**; p<0.001) between self efficacy and job satisfaction proves that self efficacy has a significant positive impact on the job satisfaction of the employees in an organisation.
Introduction
Nowadays, human resources are vitally and strategically important for organizations. An increased attention to human resources has made them as the first customers of organizations who fulfil their objectives. Skilled and efficient manpower is the most precious wealth of any organization. It can be said that employees with higher job satisfaction are in a good condition in terms of physical and mental abilities. Job satisfaction means the overall attitude of a person towards his/her job. Any organization should identify the factors causing job satisfaction of employees to create the necessary motivation in human resources to utilize their maximum effort, skill, knowledge and help the organization in achieving its goals. Self-efficacy is one of the factors influencing job satisfaction.
Self-efficacy is the core concept of Bandura’s social cognitive theory and refers to one’s perceived abilities in dealing with a problem and performing an appropriate action. The concept of self-efficacy suggests that the cognitive, motivational, emotional, and functional processes are controlled and managed by the professional belief. Evidence obtained by different analytical and methodological strategies as well as intercultural studies have shown that high self-efficacy positively related to positive thoughts. Self-esteem and higher goals, high motivation, high level of mental wellbeing, positive emotions and physical condition, while low self-efficacy is associated with anxiety, depression and low mental wellbeing. Self-efficacy can positively affects all aspect of life. People with strong sense of self-efficacy believe that they are able to effectively control the outcome of events in their lives.
A strong sense of self-efficacy is effective in achieving personal goals and how a person utilizes all his/her effort to achieve them and to what extent he/she copes with problems and responds to failures. Looking at the world in the 21st century and the challenges it
brings, it is clear that not all employees are self-efficient in their work; therefore this may
Associate Professor, MBA Dept., MESCE
result in the decline of job satisfaction of employees. Hence, this study focuses on the role of self-efficacy in job satisfaction of the employees. The main objectives of the study are
• To measure the satisfaction level of employees
• To measure the level of self-efficacy in employees.
• To know the role of self-efficacy in improving job satisfaction
Review of literature
Bandura (1977) hypothesised that self-efficacy affects choice of activities, effort, persistence, and achievement. Compared with person who doubt their capabilities, those with high self-efficacy for accomplishing a task participate more readily, work harder, persist longer when they en-counter difficulties, and achieve at a higher level.Zimmerman and Ringle (1981) observed that people acquire information to appraise self-efficacy from their performance, vicarious (observational) experience, forms of persuasion, and psychological relations ;one’s performance offer reliable guides for assessing self-efficacy. Success raise efficacy and failures lower it, but once a strong sense of self-efficacy is developed a failure may not have much impact (Bandura 1986)
According to the Social-cognitive theory of learning, a person’s self-efficacy depends on behavioural, environmental and cognitive factors (Bandura, 1986). Bandura and Wood (1989) supported the idea that a robust sense of personal efficacy to sustain the necessary attention on productivity and a constant effort to achieve goals is the key of success in many areas. Motivation and self-efficacy are enhanced when people perceive they are performing skilfully or becoming more competent. Lack of success or slow progress will not necessarily lower self-efficacy and motivation if individuals believe they can perform better by adjusting their approach (e.g. expand more effort, use effective task strategies) (schunk,1989).
Between the years, 1927 and 1932 Pr. Mayo of Harvard Business School investigated the relationship of productivity and job itself. Although numerous definitions have been given to job satisfaction, there is no consensus on how job satisfaction should actually be defined. The claim that a different meaning should be given to job satisfaction, depending on the research subject, seems reasonable (Kantas, 1998).Personal dedication, investment in one’s job, and commitment increase job satisfaction in clergy and religious order workers (Wittberg 1993).
Bogler (2001) defines job satisfaction using teachers’ perceptions of occupational prestige, self-esteem, autonomy at work and professional self-development.
The persistence of an individual for high-performance working practices (professional motivation) to achieve the objectives of the group has resulted in the increase of satisfaction (Robbins, 1984). According to Kanter (1977), an employee being satisfied with their present job’s contents does not guarantee the same level of satisfaction at the same time for their potential career development or internal mobility in organization. For instance, an employee being satisfied with current job contents means that the worker has many opportunities in their present career, receives unofficial professional training, and expects better long job prospects. In contrast, employees with fewer opportunities for career development are more likely to leave their unsatisfying job (Kanter, 1977).
Methodology
satisfaction. Data related to Self efficacy and job satisfaction was a collected by using five point likert scale questions. There are eight statements related to self efficacy and 12 statements related to Job satisfaction. Collected data were analysed by using statistical software SPSS version 21.0.
Percentage analysis was used a preliminary analysis and correlation coefficient followed t-test for testing the significance of the correlation was used for assessing the role of efficacy on job satisfaction.
Results and discussion
Data were collected form a total of 96 sample employees. Demographic profile of the respondents is given in Table 1. Out of 96 respondents majority (86%) were females which points out to the fact that the manual work proportion of male to female is
very less. Age group distribution shows that 57 per cent are belong to middle age group (30-45) and almost one third of the sample are younger age group. And it is also noted that 88 per cent are married. Results shows that majority of the employees in this private hospitals are females and married. And hence they have dual responsibility in their life which will reflect in their self efficacy and job satisfaction.
Self efficacy was measured in terms of eight variables namely risk taking, confident, self esteem, persistence, self-reliability, expertness, persuasion and problem solving. The analysis of above variable is shown in Table 2.
Table 2: Perception about self efficacy of the employees
Dimension Always Frequent Occasionally Rarely Never Risk taking mentality 22 (23) 50 (52) 18 (19) 6 (6) 0 Confidence exhibited 21 (22) 42 (44) 25 (26) 6 (6) 0 Self-esteem 24 (25) 48 (50) 18 (19) 6 (6) 0 Persistence 34 (35) 36 (38) 10 (10) 15 (15) 2 (2) Self reliability 31 (32) 36 (38) 24 (25) 4 (4) 1 (1) Expertness 34 (35) 36 (38) 16 (17) 10 (10) 0 Problem solving
capacity 22 (23) 40 (42) 22 (23) 12 (12) 0 Persuading ability 19 (20) 38 (40) 34 (35) 4 (4) 1 (1)
Values in the brackets are percentages
Results given in the Table 2 shows Out of 96 respondents 23 per cent are always able to solve difficult problems and 52 per cent can solve the problems frequently. Respondents who solve problems occasionally are 18 whereas those who rarely solve the difficult problems are numbered 6 out of 96. About 66 percent of the respondents can either frequently or always deal with unexpected events in an efficient manner. Almost three fourth of the respondents are able to stick to their aims and accomplish their goal. Whereas 19 per cent of respondents occasionally stick to their aims and only 6 per cent of respondents rarely stick to their aims and work. Out of 96 respondents, 71 per cent always
Table 1: Demographic profile of sample respondents
Characteristics Category Frequency Per cent
Gender Male 13 14 Female 83 86
Age group
<30 31 32
30-45 55 57
>45 10 11
find means to get what they want and get their things done and 10% respondents occasionally find their means to get thing done. About 70 per cent of them can usually handle whatever comes in their way. About 73 per cent find various solutions when confronted with a problem either always or frequently. About two third of them (65%) can solve most of the problem if they invest necessary effort. Whereas 23 per cent solved the problem occasionally and 12 per cent solved it rarely. Almost 60 per cent can persuade people to do thing for the wellbeing of the company. However, about 35 per cent can occasionally persuade people where as 4 respondents rarely persuade other for company’s wellbeing. Results show that employees in the present sample almost one third is having high self efficacy in their job.
An index to each dimension was worked out by using weighted average with frequency to each score as
weight and is given in Table 3. All scores are above three which is the median score percentage score is more than 66.7 indicating that they are having a high
level of self efficacy in all dimensions.
Job satisfaction of employees were assessed by using twelve variables such as responsibility, opportunity to use skill and abilities, variety of tasks, job security, salary packages, sick leave, provision, relationship with co-workers etc. and perception about that variables are given in Table 4.
Table 3. Factor Wise- Total Self-Efficacy
Factors Index Percentage score
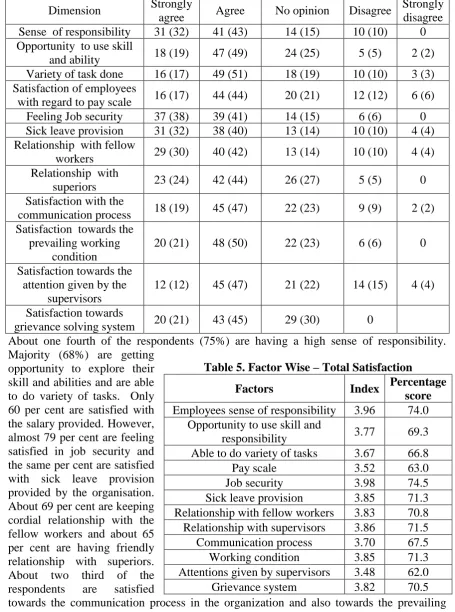
Table 4: Perception about Job satisfaction of the employees
Dimension Strongly
agree Agree No opinion Disagree
Strongly disagree Sense of responsibility 31 (32) 41 (43) 14 (15) 10 (10) 0 Opportunity to use skill
and ability 18 (19) 47 (49) 24 (25) 5 (5) 2 (2) Variety of task done 16 (17) 49 (51) 18 (19) 10 (10) 3 (3) Satisfaction of employees
with regard to pay scale 16 (17) 44 (44) 20 (21) 12 (12) 6 (6) Feeling Job security 37 (38) 39 (41) 14 (15) 6 (6) 0 Sick leave provision 31 (32) 38 (40) 13 (14) 10 (10) 4 (4) Relationship with fellow
workers 29 (30) 40 (42) 13 (14) 10 (10) 4 (4) Relationship with
superiors 23 (24) 42 (44) 26 (27) 5 (5) 0 Satisfaction with the
communication process 18 (19) 45 (47) 22 (23) 9 (9) 2 (2) Satisfaction towards the
prevailing working condition
20 (21) 48 (50) 22 (23) 6 (6) 0
Satisfaction towards the attention given by the
supervisors
12 (12) 45 (47) 21 (22) 14 (15) 4 (4)
Satisfaction towards
grievance solving system 20 (21) 43 (45) 29 (30) 0
About one fourth of the respondents (75%) are having a high sense of responsibility. Majority (68%) are getting
opportunity to explore their skill and abilities and are able to do variety of tasks. Only 60 per cent are satisfied with the salary provided. However, almost 79 per cent are feeling satisfied in job security and the same per cent are satisfied with sick leave provision provided by the organisation. About 69 per cent are keeping cordial relationship with the fellow workers and about 65 per cent are having friendly relationship with superiors. About two third of the respondents are satisfied
towards the communication process in the organization and also towards the prevailing work condition in the organisation. Only Below 60 per cent are satisfied in the attention
Table 5. Factor Wise – Total Satisfaction
Factors Index Percentage
score
Employees sense of responsibility 3.96 74.0 Opportunity to use skill and
given by the supervisors. Only 63 per cent are satisfied with grievance solving system in the organisation.
An index to each dimension to job satisfaction was worked out by using weighted average with frequency to each score as weight and is given in Table 5. All scores are above three which is the median score. Percentage score is more than 66.7 for all dimensions except satisfaction in pay scale, and attention given by supervisors indicating that they are having a high level of satisfaction in these dimensions. They are lacking in satisfaction in pay scale, and attention given by supervisors
From the above calculation correlation coefficient of self-efficacy and job satisfaction level is 0.658. t-test was done for
testing the significance and it was found to be significant at 0.01 level. Hence there exists a significant relationship
between Self efficacy and job satisfaction of the employees. Correlation coefficient was found to be positive indicating that self efficacy is positively correlated with job satisfaction. This proves that improvement in self efficacy improves the job satisfaction level of an employee.
The result of the present study reveals that the employees have a great sense of satisfaction in their respective jobs. In order to improve their satisfaction level the organization can adopt certain practices like,
• The organization can make employees more secured in their jobs by providing benefits and incentives.
• The organization has to fix a prospective pay scale for the salary payment since this factor is considered as a pull factor which makes employees more committed and loyal to the work.
• The organization can also make arrangements for the improvements in the prevailing working conditions.
• The organization should try to improve the risk taking mentality of the employees by giving them proper training.
• The organization should provide proper advices and guidelines for solving the problems faced by the employs.
Conclusion
A study was conducted to understand the role of self-efficacy in job satisfaction and to measure the prevailing satisfaction and self-efficacy level in the employees. From the study it was found that employees have a great sense of job satisfaction and their self-efficacy level was also high to an extent. The most influencing aspect in the satisfaction of employees is job security. Most of the employees have a high level of self-esteem and confidence. Significant positive correlation indicates that high self-efficacy can lead to high level of job satisfaction.
Table 6. Relations between self efficacy and job satisfaction
Variable Correlation t-value p-value Self efficacy vs job
References
Aswathappa (1997) Human Resource and Personnel Management, Tata-McGraw publishing co-Ltd (1997)
Robbins, S.P. (1984). Management: concepts and practices. Englewood Cliffs, NJ: Prentice Hall.
Subba Rao P. (1999) Human Resource Management and Industrial relations. Himalaya publishing house, New Delhi.
Bandura, A. (1986). Social foundation of thought and action: A social cognitive theory. Englewood cliffs NJ: Prentice-Hall
Bandura, A. (1994).self-efficacy.(V.S.Ramachandran,ED.) Encyclopedia of human behaviour 4, pp. 71-81.
Currivan, D.B. (1999). The causal order of job satisfaction and organizational commitment in models of employee turnover. HumanResource Management Review, *Bandura, A (1977). Self-efficacy: towards a unifying theory of behavioural change. Psychological review, 84(2), 191-215.
Kanter, R.M. (1977). Men and Women of the corporation. New York: Basic Books. 9(4), pp 495-524.
Schunk, D.H., & Gunn, T.P. (1989). Self-efficacy and skill development: Influence of task strategies and attributions. Journal of Educational Research, 79, 238-244
Wittberg, P. (1993). Job satisfaction among lay, clergy and religious order workers for the catholic church: a preliminary investigation [Electronic Version].Review of Religious Results 35,1,pp 19-33.
Wood, R. and Bandura, R. (1989) “Social cognitive theory of organizational management”, Academy of Management Review. Vol. 14, No(3).


![Table 1. Mechanical properties of different types of natural fibers [4]](https://thumb-us.123doks.com/thumbv2/123dok_us/1380247.1648613/64.595.141.469.215.419/table-mechanical-properties-different-types-natural-fibers.webp)
