International Journal of Multidisciplinary and Scientific Emerging Research
©2014 IJMSER, All Rights Reserved
Available at http://www.ijmser.com/ (ISSN 2349 – 6037)
RESEARCH ARTICLE
Optimum Site Selection Using GIS Analysis Techniques
Mahmoud Abdelrahim Abdelgiom 1 and Gar elnabi Ibrahim Mohamed 2
1Assistant Professor and Head
2
Associate Professor 1,2 UofK, Faculty of Engineering
1Department of Basics and Engineering Sciences, 2Department of Surveying Engineering, Sudan
Accepted 23 September 2014, Available online 05 October 2014, Vol.3, No.1 (October 2014)
Abstract
The application of geographic information system (GIS) in optimum site selection for investment projects and proposed projects will give solutions to most of the problems hindering the investment and customers regarding the selection of optimum sites for projects in accordance with feasibility studies and minimum costs. Moreover, GIS helps in setting plans for future needs. The core of this study is a computerized model based on the technology of geographic information systems.The types of software used were AutoCAD version 2012 for vectorization; editing and transformation; ArcGIS 9.3 for Topology, re topology, adding attribute database and performing the spatial analysis. In this paper, two study areas were selected: an urban area (see figure 1) and a rural area (see figure 2) from two topographic maps provided by Sudan Survey department at a scale of 1/100,000. The urban area includes an extensive area of greater Khartoum map, Khartoum province and Khartoum north province (Bahri). The urban study area equals (1315.364) km2. The rural area includes many villages of Jabel Awlia province. This area equals (1453.522) km2.
Keywords: The method of analysis used to select the ideal site is the intersection method. This method is like the
intersection method of Sets theory in linear algebra.
1. INTRODUCTION
Optimum site selection really changes our decision-making process, and helps in setting plans for future needs. Beyond the traditional use of site selection tools to save time and money, some companies are even using the software to target potential employees. In addition, the technology enables retailers to evaluate how opening multiple locations in a geographic region will impact the bottom line [1].
The role of the optimum site selection for each development project should be considered. The site selection processes based on the traditional techniques are tedious, costly, time consuming and lack, the integration of all the possible data layers related to the site selection processes.
The main intention here is not to create new functions but to reduce the circle (access to existing functions) through which non-GIS user will revolve around ArcGIS 9.3 software to carry out suitability analysis (modeling). The ability to describe complex geographic modeling with straightforward options for a greater number of users is well recommended by many researchers [2].
The main objectives of this paper is to investigate the potentiality of GIS analysis technology based site selection processes, that would be cost effective, time saving and above all integrate all the possible data layers related to the site selection process concerned.
2. MATERIALS AND METHODS
2.1Study Area
In this paper two study areas are selected: an urban area (Fig. 1) and a rural area (Fig. 2) from two topographic maps provided by Sudan Survey department at a scale of 1/100000.
Point Easting (m) Northing (m)
Top left corner 446284.9621 1768923.0767
Top right corner 470000 1768923.0767
Bottom left corner 446284.9621 1713457.6755
Bottom right corner 470000 1713457.6755
The urban area includes an extensive area of greater Khartoum map, Khartoum province and Khartoum north province. The urban study area equals (1315.364) km2.
The coordinates of the four corners of the urban study area are presented in Table 1.
Table 2: Corners of the rural study area.
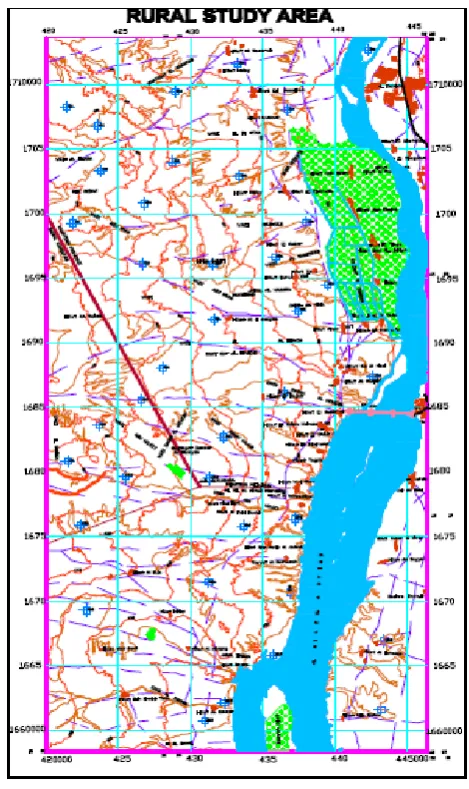
The rural area includes many villages of Jabel Awlia province. This area equals (1453.522) km2 .The coordinates of the four corners of the rural study area are presented in Table 2.
Figure 1: The Urban study area.
The main project data was derived from a 1:100,000 scale
topographical maps by digitization.
The topographic maps used in this paper are the standard National Survey Authority 1: 100,000 scale maps prepared in the year 1973 by the Directors of Overseas Survey (UN) IN CO-operation with the Sudan Government (Sudan Survey Department). These sheets were compiled based on Arial photography produced by Sudan Survey Department in 1963/1964 .The two topographic maps were produced using the Universal Transverse Mercator (UTM) coordinate system, zone 36
Figure 2: The Rural study area.
with scale factor 0.9996 at origin. The Transverse Mercator projection, Clark 1880 Spheroid and Adindan datum.
2.2 Materials
Two major software packages (ArcGIS 9.3 and AutoCAD 2012) were employed for the processing and analysis of the paper results.
ArcGIS 9.3 software packages (Arc Catalog, Arc Map) Point Easting (m) Northing (m)
Top left corner 420000 1713562.8212
Top right corner 446323.5251 1713562.8212
Bottom left corner 420000 1658345.2180
were used for the following:
- Database design and viewing metadata. (Arc Catalog).
- Mapping and editing tasks (Arc Map).
- Creation of a digital model of these services and performing spatial analysis of optimum site selection (Arc Map).
2.3 Methodology
The methodology adopted in this paper is made up of three stages. In the first stage, requirement analysis is done, in which the needed spatial and attribute data are identified. The information is gathered and entered to ArcGIS 9.3 software. In the second stage the input data is analyzed and the required information layers of the two study areas are made. In the last stage conclusions and necessary suggestions are made by examining the output information from the second stage.
The basic data used in this research are:
- Two topographic maps of two study areas that contains 51 information layers.
- The information related to soil urban area. - The information related to Price of cultivation
area in urban study area.
The method of analysis used to select the ideal site is the intersection method. This method is like the intersection method of Sets theory in linear algebra.
2.3.1Processing of Project Data
Before geographical data can be used in a GIS, the data must be converted into a suitable digital format. The process of converting data from paper maps into computer files is called digitizing. Modern GIS technology can automate this process fully for large projects using scanning technology; smaller jobs may require some manual digitizing (using a digitizing table). Today many types of geographic data already exist in GIS-compatible formats. These data can be obtained from data suppliers and loaded directly into a GIS. Transferring data from Raster to Vector data manually is very easy but takes long time. The software used to transfer the base maps from Raster to Vector data was AutoCAD version 2012. This program is efficient for putting graphic data on different layers directly. Using AutoCAD digitizing facilities including the line command, the maps were converted into digitizer manually.
There are some drawing errors that occur in the process of scanning and tracing raster data. The expected errors which may occur are:
a. Small lines created due to smudges. b. Under shoots incomplete lines or arcs. c. Over shoots or excess parts of lines or arcs. d. Duplicated lines.
The above mentioned errors should be topologically corrected before the analysis process is carried out.
The project data was transformed from AutoCAD system to UTM (Universal Transfer Mercator), Grid zone 36 for both the urban study area and Grid zone 36 for the rural study area, Adindan Datum to give the absolute locations of utilities.
3. RESULTS AND DISSCUSSION
The GIS analysis technique adopted for the project data is the intersection method in which the ideal site selection is based on the intersection between different geographic locations using their common space. This method offers the decision-makers suitable chance to take a decision based on the integration of the different project data layers. It creates buffer areas according to the requirements of a certain project. Five sample projects were used in the investigation; three of them are in the urban study area and two in the rural study area. The urban area sample projects are an agricultural project and sewerage station project. The rural area sample projects are a water supply station and a shopping center project.
3.1 An agricultural Project
A company plans to invest in greater Khartoum in an agricultural project to grow different crops and needs to select a specific site that meets the following requirements:
a) The agricultural area is at least 20 hectare (200000 square meters) in size.
b) The site should not be forested (eliminating the cost of cleaning the land).
c) The agricultural area must be a flat land. d) The soil should be suitable for both building
construction and agriculture.
e) The project area should be located near schools, universities, hospitals and petrol stations to reduce the total cost of the project. f) The distance of the agricultural project from
the main existing roads should not exceed 300 meters.
g) It should not be more than 2000 meters away from rivers and streams.
To perform an analysis for the fulfillment of the seven conditions required above, using ArcGIS 9.3, the Query facility was used to find the best location that meets the requirements of an area with suitable cost, flat land, suitable soil and near services (see Fig. 3).
A Buffer of 300 meters around the existing roads and a buffer of 2000 meters around the river Nile were created using ArcGIS 9.3 facility. The results are shown in Figures (4, 5):
Figure 4: Buffer 300 meters around main streets.
Figure 5:
Buffer 2000 meters around river Nile.
By intersect command the initial analysis made resulted in twelve options that satisfied the proposed project requirements (see Figures 6, 7 and Tables 3, 4 ).
Figure 6: Results of intersection values of an agricultural project.
Table 3: Summarization of the analysis options
This initial result were further refined by tabular analysis techniques, using the summarization zones and histogram by zones in Arc GIS 9.3 analysis facilities. The refine analysis results are presented in Table 3 and Fig. 7.
Figure 7:
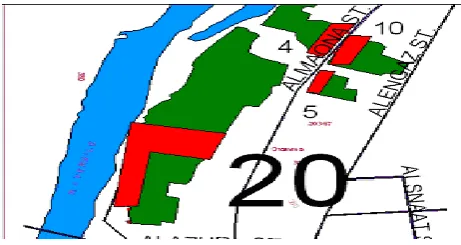
Histogram of the final result of an agricultural
project.In the above histogram, we find that the cultivation area whose ID number is 20 in Shambat farms is the most suitable area. Total cost of the area equals 206.7 million SG.
The following six points whose coordinates are shown in Table 4 represent the corners of the selected agricultural project area.
Point (No) Easting (m) Northing (m)
1 449551.16 1731989.84
2 448150.74 1732232.96
3 447907.61 1730239.31
4 448257.71 1730268.48
5 448442.49 1731542.48
6 449308.03 1731347.98
Table 4: Corners coordinates of an agricultural project.
3.2 Sewerage Station Project in the Urban Study Area
A company needs to construct a sewerage station that meets the following requirements:
and buildings. The station should contain a sewerage chemical treatment plant in addition to a reserve station.
b. The soil of the site must be suitable from the geological aspect.
c. The elevation of the site of the station must be at the minimum level so that the station shall operate under gravity.
d. The location of the sewerage station must be, at least, 500 meters away from the buildings (buffer distance of buildings =500 meters). This buffer distance depends on velocity and direction of wind.
e. The total cost of the sewerage station must be suitable.
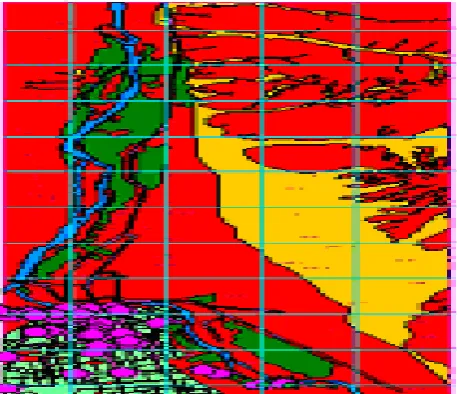
To select the optimum site of the sewerage pump station by analysis, convert all the study area from feature theme to grid theme, (see Fig. 8).
Figure 8: Conversion of the urban study area theme to grid theme.
A Buffer greater or equal 500 meters around the Khartoum building to avoid the present problems in Khartoum center of the sewerage network which create a
Figure 9: A buffer ≥ 500 m around Khartoum building.
Number of environmental problems like air and water pollution and transmission of communicable diseases, this buffer was created using ArcMap buffering facility. The results are shown in Fig. 9.
All themes were converted to grid themes before becoming overlaid. The spatial analysis was performed by using “map calculator” facility of ArcGIS 9.3 program. The initial analysis made resulted in four options that satisfied the proposed project requirements (see Fig. 10). These initial results were further refined by tabular analysis techniques, using the summarization zones and histogram by zones in ArcGIS 9.3 analysis facilities. The refine analysis graph results are presented in Fig. 11.
Figure 10: The result of sewerage station area selection.
Figure 11: Graph of map calculator of sewerage station project.
The following four points whose coordinates are shown in Table 5 represent the corners of the selected sewerage station area.
Point (No) Easting (m) Northing (m)
1 447138.88 1724662.91
2 446854.26 172466.91
3 446855.77 1723802.24
4 447139.64 1723803.75
Table 5: Corners coordinates of an agricultural project.
3.3 Shopping Center Project in the Rural Study Area
Trade companies can use GIS to determine the best location for a new outlet. A company needs to construct a shopping center selling all food supplies to the people in the White Nile villages and needs to select a specific area that meets the following requirements:
1.The area must be suitable for building. 2.The area must not be forested.
3.The location of the shopping center should not be more than 1000 meters away from the existing villages.
4.The distance between the shopping center location and any of the existing Wadis or Khors should not be less than 2000 meters.
5.The distance between the shopping center location and any of the existing roads should not exceed 400 meters.
Using ArcGIS 9.3 facilities, we can create Buffering of 1000 m. around villages, 2000 m. around wadi or khor and 400 m. around the existing roads. All themes were converted to grid themes before becoming overlaid. The spatial analysis was performed by using “Intersect command. (See Fig. 12).
Figure 12: overlaying grid themes by map calculator.
The initial analysis made resulted in seven options that satisfied the proposed project requirements (see Fig. 13). This initial result were further refined by tabular analysis
techniques, using the summarization zones and histogram by zones in ArcGIS 9.3 analysis facilities . The refine analysis results are presented in Table 6 and Fig. 14).
Figure 13: The result of Shopping center area selection.
Table 6: Summarization of the Shopping center analysis.
Figure 14: Histogram of shopping center area selection.
In the above histogram, we find that the shopping center area whose ID number is 1 and the area equals 534,855.25 m2. in Jabel awlia province. Among these sites, the one which is suitable and not forested is the area east of Hillat Alawaida.
The following four points whose coordinates are shown in Table 7 represent the corners of the shopping center area.
Point (No) Easting (m) Northing (m)
1 433792.27 1692617.45
2 432822.87 1692603.80
3 432804.66 1691962.08
4 433805.92 1691971.18
3.4 Water Supply Station in the Rural Study Area
Jabel Awlia province faces many problems concerning drinking water; in addition to that the wells water or ground water is not healthy. Some of the wells in the study area were known to be unusable as drinking water sources. For these reasons a company plans to construct a water supply station and needs to select a specific site that meets the following requirements:
(a) The area of the station should be, at least, 1000 square meters to satisfy future water needs. (b) The location of the station should not be more
than 2000 meters away from the White Nile. (c) The area of the station should not be forested. (d) The station should be located at the maximum
elevation of the site, so that the station shall operate under gravity.
(e) The station should be located at a distance of at least 1500 meters away from the surrounding villages.
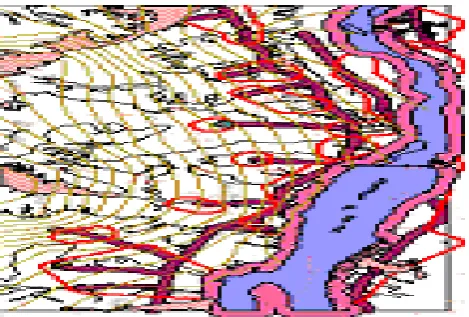
A Buffer of 2000 meters around the khor or wadi and a buffer of 1500 meters away from the surrounding villages were created using ArcInfo buffering facility. All themes were converted to grid themes before becoming overlaid. The spatial analysis was performed by using “ map calculator” facility of Arc GIS 9.3 program.( See Fig.15).
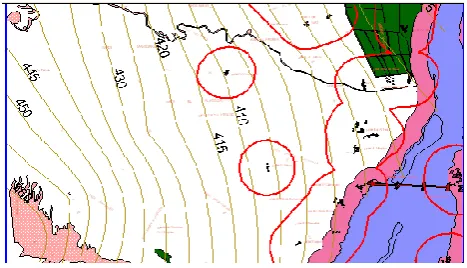
Figure 15: Display buffering layers and contour lines
The initial analysis made resulted in six options that satisfied the proposed project requirements (see Fig. 16).
Figure 16: The result of water supply station area selection.
These initial results were further refined by tabular analysis techniques, using the summarization zones and histogram by zones in ArcView GIS 3.2a analysis facilities. The refine analysis results are presented in Table 8 and Fig. 17.
Table 8: Summarization of the analysis of the water supply station.
Figure 17: Histogram of water supply station area.
From the above histogram, the optimum site of the water supply station the area whose ID=3 and area equals 184710.57 m2 between the two villages: Hillat Umm Marahi AL jadeda and Hillat al montazah. The company can utilize 1000m2 of this area to construct the required water supply station. The following four points whose coordinates are shown in Table 9 represent the corners of the water supply station area.
Point (No) Easting (m) Northing (m)
1 435955.98 1674075.19
2 43530.84 1674075.19
3 435524.77 1673637.90
4 435955.98 1673637.90
Table 7: Corners coordinates of the water supply station area.
5. CONCLUSIONS
paper clearly revealed the potentiality of applying modern GIS analysis methods for site selection in both rural and urban application areas. The role of the nature of some data also must be considered. In this study the source of data is an existing map and digitizing was carried out on screen using AutoCAD digitizing facilities. This contributed significantly to the overall difficulties experienced in the project data capture and manipulation. There is no doubt that the validity of these tests would be increased and such difficulties would be encountered if data is obtained in digital form.
The type of GIS system used should also be considered. In this study the tests were carried out using the user interface tools available in different GIS technology supposing programs. There is a possibility of creating a multi- purpose digital data base to be used for site selection applications in different fields and for different purposes. This avoids the duplication of effort in data capture and manipulation and introduces a more integrated decision making process based on the integration of all the data layers related to the site selection decision process involved.
The study has involved practical experience in digital data capture, manipulation, processing, and production of graphical output to assist in the analysis of results. Experience has also been gained in the understanding of the process of site selection, in the creation of the base models and using many GIS application software’s, such as AutoCAD, and ArcGIS 9.3.
The results can be useful for decision makers in two study areas. It must be mentioned that the presented strategy is a tool to help decision makers; it is not the decision itself.
REFERENCES
[1] Bilinn, C.R, L.P. Queen and L.W.Maki, (1993). Geographic Information Systems, 1st Edition, Skotlandi.
[2] Raper, J. And D. Rhind (1990). "UGIX (A):The design of spatial language interface for topological vector GIS", Proc. the 4th International symposium on Spatial Data Handling, Zurich, Switzeland,vol.1