Abstract— A software fault prediction is a proven technique in achieving high software reliability. Prediction of fault-prone modules provides one way to support software quality engineering through improved scheduling and project control. Quality of software is increasingly important and testing related issues are becoming crucial for software. This necessitates the need to develop a real-time assessment technique that classifies these dynamically generated systems as being faulty/fault-free. A variety of software fault predictions techniques have been proposed, but none has proven to be consistently accurate. These techniques include statistical method, machine learning methods, parametric models and mixed algorithms. Therefore, there is a need to find the best techniques for Quality prediction of the software systems by finding the fault proneness. In this study, the performance of the Density-Based Spatial Clustering of Applications with Noise (DBSCAN) is evaluated for Java based Object Oriented Software system from NASA Metrics Data Program (MDP) data repository on the basis of fault proneness of the classes.
Index Terms— DBSCAN, Software Quality, Fault Proneness, NASA fault dataset.
I. INTRODUCTION
Highly reliable software is becoming an essential ingredient in many systems. Public safety and the fabric of modern life depend on software-intensive systems. We can ill afford for important systems to fail due to inadequate software reliability. Software reliability engineering is one of the most important aspect of software quality [1]. A software fault prediction is a proven technique in achieving high software reliability. Prediction of fault-prone modules provides one way to support software quality engineering through improved scheduling and project control. Quality of software is increasingly important and testing related issues are becoming crucial for software. Although there is diversity in the definition of software quality, it is widely accepted that a project with many defects lacks quality. Methodologies and techniques for predicting the testing effort, monitoring process costs, and measuring results can help in increasing efficiency of software testing. Being able to measure the fault-proneness of software can be a key step towards steering the software testing and improving the effectiveness of the whole process. The interest of the software community in program testing continues to grow – as does the demand for complex, and predictively reliable programs. It is no
Supreet Kaur, Student (M.Tech. CSE Dept.), DAV Institute of Engineering & Technology, Jalandhar, India. Email: [email protected].
Dinesh Kumar, HOD CSE Dept., DAV Institute of Engineering & Technology, Jalandhar, India.
longer acceptable to postpone the assurance of software quality until prior to a product’s release. As the cost of removing bugs increases exponent means earlier the bugs detected lesser is the cost. Recent research in the field of computer program reliability has been directed towards the identification of software modules that are likely to be fault–prone, based on product and/or process–related metrics, prior to the testing phase, so that early identification of fault–prone modules in the life–cycle can help in channeling program testing and verification efforts in the productive direction. Hence, the quality prediction has become important.
Software metrics represent quantitative description of program attributes and the critical role they play in predicting the quality of the software has been emphasized by Perlis et al [3]. That is, there is a direct relationship between some complexity metrics and the number of changes attributed to faults later found in test and validation [4]. Many researchers have sought to develop a predictive relationship between complexity metrics and faults. Crawford et al [5] suggest that multiple variable models are necessary to find metrics that are important in addition to program size. Consequently, investigating the relationship between the number of faults in programs and the software complexity metrics attracts researchers’ interesting. There are several different techniques have been proposed to develop predictive software metrics for the classification of software program modules into fault–prone and non fault–prone categories. Hence, a metric based approach can be investigated for prediction of software quality by identification of fault prone modules.
The code metric, design metric and other metrics used in the literature for the quality prediction are shown in table 1. When the artificial neural network is applied to model software reliability, the invalid software time in the software mistake reports is adopted as the input of software quality prediction model [6-8], and the software quality metrics is used as the input of the neural networks [9-11].
Recently, the object-oriented software metrics has been adopted as the inputs of the neural networks in order to predict object-oriented software quality [12-16]. By applying the software quality metrics as the inputs of neural networks, Khoshgoftaar et al [17-18] proposed some software quality prediction models using neural network of BP (back propagation) and compared these models with the one using nonparametric discriminant, and they found that the software quality prediction models using neural network of BP obtained good prediction accuracy. Hu and Zhong [19] applied the learning vector quantization network to predict the software quality and proposed a software module risk
Quality Prediction of Object Oriented Software Using
Density Based Clustering Approach
model. With consideration of software fault severity, Zhao and Zhong et al [20] presented a software fault-proneness prediction model by support vector machine and the Chidamber-Kemerer (C&K) object-oriented metrics. In most of the literature of fault-proneness prediction the performance of the techniques are compared by Accuracy Percentage, Probability of Detection and Probability of False Alarms. The details of these performance criteria are given in the methodology section.
TABLE I: METRICS USED IN THE LITERATURE FOR THE QUALITY PREDICTION [46]
However, this necessitates the need to develop a real-time assessment technique that classifies these dynamically generated systems as being faulty/fault-free. A variety of software fault predictions techniques have been proposed, but none has proven to be consistently accurate. These techniques include statistical method, machine learning methods, parametric models and mixed algorithms. Therefore, there is a need to find the best techniques for Quality prediction of the software systems by finding the fault proneness.
II. LITEARATURE REVIEW
The following is the literature survey related with the prediction of faults in software systems:
Saida et al [21] surveyed that the basic premise behind the development of object-oriented metrics is that they can serve, as early predictors of classes that contain faults or that are costly to maintain. In their paper they have shown that size can have an important confounding effect on the validity of object-oriented metrics [21].
A critical review of the literature is given by Fenton & Neil [22] and they also made heroic contributions to the subject. In their study, most of the wide range of prediction models used size and complexity metrics to predict defects. Others are based on testing data, the “quality” of the development process, or take a multivariate approach. They also argued for research into a theory of “software decomposition” in order to test hypotheses about defect introduction and help construct a better science of software engineering. The comparison of Fault-Proneness Estimation Models and conclusion that software quality has become one of the most important requirements in the development of systems and fault-proneness estimation could play a key role in quality control of software products. The main objective was to find a compromise between the fault-proneness estimation rate and the size of the estimation model in terms of number of metrics used in the model itself [23].
With the existence of a correlation between a reasonable set of static metrics and software fault-proneness. Static metrics, e.g., the McCabe's cyclomatic number or the Halstead's Software Science, statically computed on the source code, try to quantify software complexity. Dynamic metrics, e.g., structural and data flow coverage measure the thoroughness of testing as the amount of elements of the program covered by test executions. Such metrics only partially reflect the many aspects that influence the software fault-proneness, and thus provide limited support for tuning the testing process [24].
The conclusion to remain competitive in the dynamic world of software development, organizations must optimize the usage of their limited resources to deliver quality products on time and within budget. The proposed fault prediction model used in his study was based on supervised learning using Multilayer Perceptron Neural Network and the results were analyzed in terms of classification correctness and based on the results of classification, faulty classes were further analyzed and classified according to the particular type of fault [25].
Yan Ma [26] suggested that accurate prediction of fault prone modules in software development process enables effective discovery and identification of the defects. Thomas Zimmermann and Nachiappan Nagappan [27] in their paper suggested that in the software development, the resources for quality assurance are limited by time and by cost.
empirical study detailing software maintenance for web based java applications can be performed to aid in understanding and predicting the software maintenance category and effort [33]. Software maintenance organizations are no exception. Visual approach [34] can be used to uncover the relationship between evolving software and the way it is affected by software bugs. By visually putting the two aspects close to each other, we can characterize the evolution of software artifacts. Software maintenance is central to the mission of many organizations. Thus, it is natural for managers to characterize and measure those aspects of products and processes that seem to affect cost, schedule, quality, and functionality of a software maintenance delivery [35].
Statistical, machine learning, and mixed techniques are widely used in the literature to predict software defects. Khoshgoftaar used zero-inflated Poisson regression to predict the fault-proneness of software systems with a large number of zero response variables. He showed that zero-inflated Poisson regression is better than Poisson regression for software quality modeling.
Munson and Khoshgoftaar [36] also investigated the application of multivariate analysis to regression and showed that reducing the number of “independent” factors (attribute set) does not significantly affect the accuracy of software quality prediction. Menzies, Ammar, Nikora, and Stefano [37] compared Decision Trees, Naïve Bayes, and 1-rule classifier on the NASA software defect data. A clear trend was not observed and different predictors scored better on different data sets. However, their proposed ROCKY classifier outscored all the above predictor models.
Emam, Benlarbi, Goel, and Rai [38] compared different case-based reasoning classifiers and concluded that there is no added advantage in varying the combination of parameters (including varying nearest neighbor and using different weight functions) of the classifier to make the prediction accuracy better.
Salah Bouktif et al [39] presented how the general problem of combining quality experts, modeled as Bayesian classifiers, can be tackled via a simulated annealing algorithm customization. The general approach was applied to build an expert predicting object-oriented software stability, a facet of software quality. The findings demonstrate that, on available data, composed expert predictive accuracy outperforms the best available expert and it compares favorably with the expert build via a customized genetic algorithm.
Ping Guo et al. [40] showed Expectation-Maximum likelihood (EM) algorithm to build the quality model. By only employing software size and complexity metrics, this technique can be used to develop a model for predicting software quality even without the prior knowledge of the number of faults in the modules. The technique was successful in classifying software into fault-prone and non fault-prone modules with a relatively low error rate, providing a reliable indicator for software quality prediction.
III. PROBLEM FORMULATION
Fault-proneness of a software module is the probability that the module contains faults. A correlation exists between
the fault-proneness of the software and the measurable attributes of the code (i.e. the static metrics) and of the testing (i.e. the dynamic metrics). Early detection of fault-prone software components enables verification experts to concentrate their time and resources on the problem areas of the software system under development. Software quality models ensure the reliability of the delivered products. It has become important to develop and apply good software quality models early in the software development life cycle, especially for large-scale development efforts. Software quality prediction models seek to predict quality factors such as whether a component is fault prone or not.
Faults in software systems continue to be a major problem. Many systems are delivered to users with excessive faults. This is despite a huge amount of development effort going into fault reduction in terms of quality control and testing. It has long been recognized that seeking out fault-prone parts of the system and targeting those parts for increased quality control and testing is an effective approach to fault reduction. A limited amount of valuable work in that area has been carried out previously. Despite this it is difficult to identify a reliable approach to identifying fault-prone software components. The aim of software metrics is to predict the quality of the object oriented software products. Various attributes, which determine the quality of the software, include maintainability, defect density, fault proneness, normalized rework, understandability, reusability etc.
In the literature density clustering based approach is not experimented. There are a number of advantages of Density based clustering approach particularly DBSCAN:
• It does not require you to know the number of clusters in the data a priori, as opposed to k-means.
• It can find arbitrarily shaped clusters. • The algorithm has a notion of noise.
• It requires just two parameters and is mostly insensitive to the ordering of the points in the database.
Hence, due to the advantages of Density based clustering approach, the proposed work is aimed at “Quality Prediction of Object Oriented software using Density Based Clustering Approach”.
IV. OBJECTIVES
Use The following are the objectives that are proposed to be covered in the study:
1. Studying the Code and Design attributes of Object oriented ware systems
2. Collection of metric and fault proneness data for the object oriented systems
3. Evaluates the worth of a subset of attributes by considering the individual predictive ability of each feature means finding the important subset of attributes.
4. Use Density clustering based modeling approach with Object Oriented metrics for predicting faulty classes.
V. PROPOSED METHODOLOGY
The proposed methodology will consist of the following steps:
1. First of all, find the structural code attributes of software systems.
2. Select the suitable metric values as representation of statement
3. Collect the metric data of structural code attributes 4. Analyze, refine metrics and evaluates the worth of a
subset of attributes by considering the individual predictive ability of each feature along with the degree of redundancy between them. Subsets of features that are highly correlated with the class while having low intercorrelation are preferred. 5. Apply the Density Based Clustering algorithm to find
the Fault Proneness:
Clustering is an approach that uses software measurement data consisting of limited or no fault-proneness data for analyzing software quality. In this study, Density based clustering algorithm is being used for predictive models to predict faulty/non faulty modules. Density-based approaches apply a local cluster criterion. Clusters are regarded as regions in the data space in which the objects are dense, and which are separated by regions of low object density (noise). These regions may have an arbitrary shape and the points inside a region may be arbitrarily distributed. Density based clustering is based upon two parameters.
• Eps: Maximum radius of the neighborhood
• MinPts: Minimum number of points in an Eps-neighbourhood of that point.
The key idea of a density-based cluster is that for each point of a cluster its Eps-neighborhood for some given Eps > 0 has to contain at least a minimum number of points, i.e. the “density” in the Eps-neighborhood of points has to exceed some threshold[23].
In a density based clustering a cluster is defined as maximal set of density connected points. The main feature of density based clustering is that it discovers features of arbitrary shape and it can handle noise.
6. Implementing the model and test the performance of the model.
7. Compare the result using the following Performance Criteria and deduce conclusions.
A. Performance Criteria
The set of evaluation measures that are being used in carried out the results are discussed below:
TABLE II: A CONFUSION MATRIX OF PREDICTION OUTCOMES [47]
As shown in Table 2, let a is the number of modules that actually have no fault and classifier predicts no defects in those modules, b is the number of modules that actually have defects and classifier predicts no defects in those modules, c
is the number of modules that actually have no defects and classifier predicts no defects in those modules, and d is the number of modules that actually have defects and classifier predicts defects in those modules.
• Accuracy: It indicates proximity of measurement results to the true value, precision to the repeatability or reproducibility of the measurement. The accuracy is the proportion of true results (both true positives and true negatives) in the population. As represented in equation below:
(
a d) (
a b c d)
Acc = + / + + + (1)
• Probability of detection: Probability of detection is the probability of system failure. That means that the probability of any component B failing given that a component A has already failed is the same as that of B failing when A has not failed. Probability of detection is calculated as shown below:
(
b
d
)
d
Pd
=
/
+
(2)• Probability of false alarm: Intuitively probability of false alarm is the fraction of buggy execution that raises an alarm. The formula for Probability of false alarm is given below:
( )
a
c
c
Pf
=
/
+
(3)VI. RESULTS AND DISCUSSIONS
The datasets used in this study come from the NASA Metrics Data Program (MDP) data repository [44] named as KC3. The KC3 software is written in Java programming Language for Storage management for ground data in the safety critical project.
There are 39 metrics values calculated for the 458 instances and for each exemplar the last column tells whether the fault exists in the module or not. There are 415 modules that are having no fault and 43 modules are faulty modules as shown in the table below:
TABLE III: COUNT OF FAULTY AND NON-FAULTY MODULE SIN THE DATASET
The following are the parameters used in the DBSCAN algorithm implementation in the WEKA as shown in figure 1:
• database_Type – It is the used database name and path • database_distanceType – It tells us the type of distance used. It is set to Euclidian Distance.
• epsilon – It is radius of the epsilon-range-queries. It is set to 0.9 value.
Fig. 1. Snapshot of the Parameters Set for DBSCAN
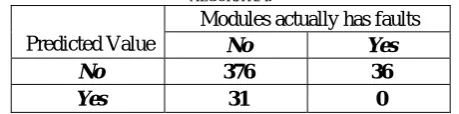
The DBSCAN clustering algorithm has created clusters numbered as 0 to 1 and assigned the 412 ( means 93%) examples to cluster number 0 and 31 ( means 7%) examples to cluster number 1. The confusion matrix calculated is shown below:
TABLE IV: CONFUSION MATRIX OF PREDICTION OUTCOMES OF DBSCAN ALGORITHM.
Predicted Value
Modules actually has faults
No Yes
No 376 36
Yes 31 0
As evidenced from the confusion matrix the incorrectly clustered instances are 67 means 14.6288% is the inaccurate percentage value and Accuracy of prediction is 85.3712%.
Thereafter, we have used the WEKA open source software for the attribute evaluation that evaluates the worth of a subset of attributes by considering the individual predictive ability of each feature along with the degree of redundancy between them. It is considered that subsets of features that are highly correlated with the class while having low intercorrelation are preferred [45].
The parameters used in the attribute evaluation are: • locallyPredictive -- Identify locally predictive attributes. Iteratively adds attributes with the highest correlation with the class as long as there is not already an attribute in the subset that has a higher correlation with the attribute in question. Set as true.
• missingSeparate -- Treat missing as a separate value. Otherwise, counts for missing values are distributed across other values in proportion to their frequency. Set as false.
The search method used in the attribute evaluation is BestFirst that searches the space of attribute subsets by greedy hillclimbing augmented with a backtracking facility. Setting the number of consecutive non-improving nodes allowed controls the level of backtracking done. Best first may start with the empty set of attributes and search forward, or start with the full set of attributes and search backward, or start at any point and search in both directions (by considering all possible single attribute additions and deletions at a given point).
The output of the attribute evaluation shows that the following 8 attributes/metrics are more important in prediction of the faulty modules:
• LOC_BLANK • BRANCH_COUNT
• LOC_CODE_AND_COMMENT • ESSENTIAL_COMPLEXITY • LOC_EXECUTABLE • HALSTEAD_LENGTH
• NORMALIZED_CYLOMATIC_COMPLEXITY • PERCENT_COMMENTS
The WEKA’s DBSCAN algorithm is run for the selected 8 attributes as mentioned above and the following confusion matrix is created:
TABLE V: CONFUSION MATRIX OF PREDICTION OUTCOMES FOR THE DBSCAN ALGORITHM WITH SELECTED ATTRIBUTES.
Predicted Value
Modules actually has faults
No Yes
No 415 43
Yes 0 0
As evidenced from the confusion matrix the incorrectly clustered instances are 43 means 9.3886% is the inaccurate percentage value and Accuracy of prediction is 90.6114%.
Probability of detection for Non-faulty modules is the ratio of the number of modules identified as non-faulty and those are actually non-faulty to the total Number of modules that are actually have no fault means the probability with which the system is able to detect the non-faulty modules out of total non-faulty modules present. Probability of detection for non-faulty modules is 1 means the system can perfectly identify the non-faulty modules. Probability of false alarm for the faulty modules is 0 means that the system has zero buggy execution that raises an alarm.
VII. CONCLUSION
In this study, the performance of the Density-Based Spatial Clustering of Applications with Noise (DBSCAN) is evaluated for Java based Object Oriented Software system from NASA Metrics Data Program (MDP) data repository on the basis of fault proneness of the classes. Here, the metric based approach is used for prediction. First, thirty nine metrics are used and later the worth of a subset of attributes is calculated and the number of metrics are reduced to eight. The metric values for the exmaplars is used as Input and clusters are formed using DBSCAN, thereafter 10 fold cross validation performance of the system is recorded. As deduced from the results it is clear that the performance of the proposed algorithm is better in case of reduced set of attributes. The Accuracy of prediction is improved from 85.3712% to 90.6114% with reduced set of attributes. With reduced set of the factors the density based clustering provides Probability of detection for non-faulty modules equal to 1 and Probability of false alarm for the faulty modules equal to 0 means the it is satisfactory enough to use the Density-Based Spatial Clustering of Applications with Noise (DBSCAN) technique for the prediction of the object oriented software components based on the fault proneness.
REFERENCES
[1] M. R. Lyu, Handbook of software Reliability Engineering IEEE Computer Society Press, McGraw Hill, 1996.
[3] F. G. Sayward A. J. Perlis and M. Shaw, Software Metrics: An Analysis and Evaluation, MIT Press, Cambridge, MA, 1981.
[4] V. Y. Shen, T.Yu, S. M. Thebaut, and L. R. Paulsen, “Identifying error-prone software—an empirical study,” IEEE Trans. on Software Engineering, vol. SE-11, pp. 317–323, April 1985.
[5] S. G. Crawford, A. A. McIntosh, and D. Pregibon, “An analysis of static metrics and faults in C software,” J. Syst. Sofyware, vol. 5, pp. 27–48, 1985.
[6] Liang Tian, Afzel Noore, “On-line prediction of software reliability using an evolutionary connectionist model”, Journal of System and Software, Vol.77, NO.2, pp.173-180, 2005.
[7] Liang Tian, Afzel Noore, “Evolutionary neural network modeling for software cumulative failure time prediction”, Reliability Engineering and System Safety, Vol.87, No.1, pp. 45-51, 2005.
[8] Q.P. Hu, M. Xie, S.H. Ng, G. Levitin, “Robust recurrent neural network modeling for software fault detection and correction prediction”, Reliability Engineering and System Safety, Vol.92, No.3, pp.332-340, 2007.
[9] T. M. Khoshgoftaar, E. B. Allen, Zhiwei Xu, “Predicting testability of program modules using a neural network”, In Proc. of 3rd IEEE Symposium on Application-Specific Systems and Software Engineering Technology, pp.57-62, 2000.
[10] Zhiwei Xu, T. M. Khoshgoftaar, “Software quality prediction for high-assurance network telecommunications systems”, Computer Journal, Vol.44, No.6, pp.557-568, 2001.
[11] Donald E. Neumann, “An Enhanced Neural Network Technique for Software Risk Analysis”, IEEE Transactions on software engineering, Vol.28, No.9, pp.904-912, 2002.
[12] S. Kanmani, V. Rhymend Uthariaraj, V. Sankaranarayanan, P. Thambidurai, “Object-oriented software fault prediction using neural networks”, Information and Software Technology, Vol.49, No.5, pp.483-492, 2007.
[13] Jon T. S. Quah, Mie Mie Thet Thwin, “Prediction of Software Readiness Using Neural Network”, In Proceedings of 1st International Conference on Information Technology & Applications, Bathurst, Australia, pp. 2312-2316, 2002.
[14] Mie Mie Thet Thwin,Tong-Seng Quah, “Application of neural networks for software quality prediction using Object-oriented metrics”, Journal of systems and software, Vol.76, No.2, pp.147-156, 2005.
[15] S.Kanmani, V. Rhymend Uthariaraj, V. Sankaranarayanan, P. Thambidurai, “Object oriented software quality prediction using general regression neural networks”, ACM SIGSOFT Software Engineering Notes, Vol.29, No.5, pp.1-6, 2004.
[16] Atchara Mahaweerawat, Peraphon Sophatsathit, Chidchanok Lursinsap,Petr Musilek, “Fault Prediction in Object-Oriented Software Using Neural Network Techniques”, Journal of Advanced Computational Intelligence and Intelligent Informatics, Vol.10, No.3, pp. 312-322, 2006.
[17] T. M. Khoshgoftaar, R. M. Szabo, “Using neural network to predict software faults during testing”, IEEE Transactions on reliability, Vol.45, No.3, pp.456-462, 1996.
[18] T. M. Khoshgoftaar, E. B. Allen, J. P. Hudepohl, S. J. Aud, “Application of neural networks to software quality modeling of a very large telecommunications system”, IEEE Transactions on neural networks, Vol.8, No.4, pp.902-909, 1997.
[19] Qiu-suo HU and Cheng Zhong, “Model of predicting software module risk based on neural network”(in Chinese), Computer Engineering and Applications, Vol.43, No.18, pp.106-110, 2007.
[20] Yan ZHAO, Cheng ZHONG, Zhi LI, Tie YAN, “Object-Oriented Software Fault-Proneness Prediction Using Support Vector Machine” (in Chinese), Computer Engineering & Science, Vol.30, No.11, pp.115-117,2008.
[21] Saida Benlarbi,Khaled El Emam, Nishith Geol (1999), “Issues in Validating Object-Oriented Metrics for Early Risk Prediction”, by Cistel Technology 210 Colonnade Road Suite 204 Nepean, Ontario Canada K2E 7L5
[22] Fenton, N. E. and Neil, M. (1999), “A Critique of Software Defect Prediction Models”, Bellini, I. Bruno, P. Nesi, D. Rogai, University of Florence, IEEE Trans. Softw. Engineering, vol. 25, Issue no. 5, pp. 675-689.
[23] Bellini, P. (2005), “Comparing Fault-Proneness Estimation Models”, 10th IEEE International Conference on Engineering of Complex Computer Systems (ICECCS'05), vol. 0, 2005, pp. 205-214.
[24] Giovanni Denaro (2000), ”Estimating Software Fault-Proneness for Tuning Testing Activities” Proceedings of the 22nd International Conference on Software Engineering (ICSE2000), Limerick, Ireland, June 2000.
[25] Mahaweerawat, A. (2004), “Fault-Prediction in object oriented software’s using neural network techniques”, Advanced Virtual and Intelligent Computing Center (AVIC), Department of Mathematics, Faculty of Science, Chulalongkorn University, Bangkok, Thailand, pp. 1-8.
[26] Ma, Y., Guo, L. (2006), “A Statistical Framework for the Prediction of Fault-Proneness”, West Virginia University, Morgantown.
[27] Thomas Zimmermann, Nachiappan Nagappan, “ Predicting Defects Using Social Network Analysis on Dependency Graphs”, International Conference on Software Engineering (ICSE 2008), Leipzig, Germany. [28] Audris Mockus, Nachiappan Nagappan and Trung T.Dinh-Trong “Test Coverage and Post-Verification Defects: A Multiple Case Study,” ACM-IEEE Empirical Software Engineering and Measurement Conference (ESEM), Orlando, FL, 2009
[29] Cagatay Catal & Banu Diri , “ A Systematic Review of Software Fault Prediction Studies” Journal of Expert Systems with Applications, Volume 36, Issue 4,May 2009.
[30] Jonas Boberg , “ Early Fault Detection with the Model-based Testing” , 7th ACM SIGNPLAN workshop on ERLANG, 2008.
[31] Bindu Goel & Yogesh Singh ,“Emperical Investigation of Metrics for Fault Prediction on Object Oriented Software” the Book series in Computational Intelligence, 2008.
[32] Khoshgoftaar, T. M., Allen, E. B., Ross, F. D., Munikoti, R., Goel, N. & Nandi, A., "Predicting fault-prone modules with case-based reasoning". ISSRE 1997, the Eighth International Symposium on Software Engineering (pp. 27-35), IEEE Computer Society (1997). [33] Min-Gu Lee and Theresa L. Jefferson, "An Empirical Study of
Software Maintenance of a Web-based Java Application", Proceedings of the 21st IEEE International Conference on Software Maintenance (ICSM’05), IEEE (2005).
[34] Marco D' Ambros and Michle Lanza, "Software Bugs and Evolution: A Visual Approach to uncover their relationship", Proceedings of IEEE Conference on Software Maintenance and Reegineering (CSMR' 06), IEEE (2006).
[35] George E. Stark, "Measurements for Managing Software Maintenance", IEEE computer Society (1996).
[36] Khoshgoftaar, T.M. and Munson, J.C., “Predicting Software Development Errors using Complexity Metrics”, Selected Areas in Communications, IEEE Journal on, Volume: 8 Issue: 2, Feb. (1990), Page(s): 253 -261.
[37] Menzies, T., Ammar, K., Nikora, A., and Stefano, S., “How Simple is Software Defect Prediction?” Submitted to Journal of Empirical Software Engineering, October (2003).
[38] Eman, K., Benlarbi, S., Goel, N., and Rai, S., “Comparing case-based reasoning classifiers for predicting high risk software components”, Systems Software, Journal of, Volume: 55 Issue: 3, Nov. (2001), Page(s): 301 – 310.
[39] Salah Bouktif, Houari Sahraoui, Giuliano Antoniol, "Simulated Annealing for Improving Software Quality Prediction", GECCO’06, July 8–12, 2006, Seattle, Washington, USA, pp. 1893-1900.
[40] Ping Guo and Michael R. Lyu, “Software Quality Prediction Using Mixture Models with EM Algorithm”, Proceedings of the First Asia-Pacific Conference on Quality Software,(APAQS 2000), Hong Kong, pp. 69-78.
[41] http://webdocs.cs.ualberta.ca/~zaiane/courses/cmput690/slides/Chapte r8/sld044.htm.
[42] Yue Jiang, Bojan Cukic, Tim Menzies, Nick Bartlow , “Comparing Design and Code Metrics for Software Quality Prediction”, Proceeding PROMISE '08 Proceedings of the 4th international workshop on Predictor models in software engineering, ACM New York, NY, USA ©2008
[43] Kaur, A. Brar, A.S. Sandhu, P.S, “An empirical approach for software fault prediction”, International Conference on Industrial and Information Systems (ICIIS), 2010, July 29 -Aug. 1 2010, Mangalore, pp. 261 – 265.
[44] Metric data program. NASA Independent Verification and Validation facility, Available from http://MDP.ivv.nasa.gov.
[45] M. A. Hall (1998). Correlation-based Feature Subset Selection for Machine Learning. Hamilton, New Zealand.
[46] Yue Jiang, Bojan Cukic, Tim Menzies, Nick Bartlow , “Comparing Design and Code Metrics for Software Quality Prediction”, Proceeding PROMISE '08 Proceedings of the 4th international workshop on Predictor models in software engineering, ACM New York, NY, USA ©2008