A Collective Methodology of Software Metrics
and Software Fault Exploration to Software
Dependability Approximation
1
T. Ravi Kumar,
2Dr. T. Srinivasa Rao
1Dept. of CSE, AITAM Engineering College, Tekkali, AP, India
2Dept. of CSE, GIT, GITAM University, Visakhapatnam, AP, India
Abstract
The accurate prediction of where faults are probably going to happen in code with coordinate test exertion, lessen costs and enhance the quality of software. Target of this paper is we research how the setting of models, the autonomous factors utilized and the demonstrating methods connected, impact the execution of fault prediction models. In this paper we have indicated compherensive assessment of various machine learning techniques for software imperfection predection. A thoughtful of quality viewpoints is pertinent for the software relationship to convey high software reliability. An accurate thought of metrics to forecast the quality characteristics is essential keeping in mind the end goal to procure understanding about the estimation of software in the primitive periods of software advancement and to guarantee restorative activities. We relate one measurable strategy and six machine learning system to anticipate the models. The proposed generation
are approved utilizing dataset unruffled from Open Source software.
The results are dissected utilizing Area under the Curve (AUC)
accomplish from Receiver Operating Characteristics (ROC)
testing. The results demonstrate that the imitation anticipated utilizing the arbitrary timberland and sacking strategies beat the various form. Henceforth, bolster on these results it is fair to guarantee that quality models have an impressive pertinence with
Object Oriented metrics and that machine learning associations
have a comparable execution with numerical strategies. It is test that the CBR routine utilizing the Mahalanobis separation likeness occupation additionally the reverse separation weighted arrangement calculation yielded the best fault prediction.
Keywords
Software Quality, Software Security, Confidentiality, Design Metrics, Software Fault Prediction
I. Introduction
With the fast advancement in size and intricacy of software
frameworks, quality confirmation exercises, for example, testing
and investigation have turned out to be more imperative for software designers and software buyers who are in charge of
acknowledgment testing. Fault prediction display can possibly
enhance the quality of frameworks and decrease the expenses related
with conveying those frameworks. Fault prediction demonstrating
has turned out to be fundamental for the early distinguishing proof of fault-inclined code. These investigations normally create fault prediction models which permit software architects to concentrate improvement exercises on fault-inclined code, in this way enhancing software quality and improving utilization of
assets. To organize quality confirmation endeavors, the systems
have been proposed for foreseeing fault inclined modules by their likelihood of having a fault, the quantity of expected faults [6],[9] or the fault thickness. In view of the prediction results, analyzer can allot constrained testing endeavors to fault inclined modules
in order to discover more faults with littler exertion. Our essential objective is to gauge the decrease of acknowledgment test exertion that fault prediction can accomplish. To accomplish this objective,
we have to dispense test exertion with suitable procedure to every module after prediction. We have to register the normal number of discoverable faults regarding test assets, asset designation technique, and set of modules to be tried. Tests right now directed
by the organization are not finished, and most software frameworks contain faults after discharge. The required test exertion finds the
same number of faults as genuine testing through reproduction. To survey the cost adequacy of prediction we have to quantify the exertion for metrics accumulation, information purging and
displaying. To discover the Software abandons in the Software improvement life cycle before the testing procedure, Software
metrics (strategy level, class-level, segment level, document level, process-level, quantitative esteems level) are utilized. Techniques utilized are measurements, machine learning, machine learning alongside factual strategies and measurable models versus master estimation. To foresee the fault inclined modules for the following arrival of software, industry utilizes past software metrics and fault
information. Software fault prediction approaches are significantly more financially savvy to distinguish software faults contrasted
with software surveys. As the size and unpredictability of software frameworks expands, software industry is exceptionally tested to convey high caliber, dependable software on time and inside
spending plan. Prediction demonstrate for software absconds
limits the cost and enhance the software quality.
II. Related Work
Parvinder S. Sandhu, et.al [1] have proposed the Genetic Algorithm based software fault prediction models with Object-Oriented
metrics. It has utilized Metric estimations of JEdit open source
software for era of the principles for the classification of source
software modules in the classes approval is performed. Result
demonstrates that Genetic calculation approach can be utilized for finding the fault inclination in question situated software segments. Faultproneness of a software modules is the likelihood that the
module contains faults. Yan Ma, et.al [2] have proposed the a technique for anticipating fault inclined modules utilizing an altered arbitrary timberlands calculation. Arbitrary backwoods enhance
classification precision by growing an outfit of classification trees and giving them a chance to vote on the classification choice. We connected the system to five NASA open space imperfection
informational indexes. These informational indexes shift in measure, yet all ordinarily contain few deformity tests in the
learning set. In the event that general precision amplification is the objective, at that point gaining from such information for the most part results in a one-sided classifier, i.e. the lion’s share
classifiers, and edge change in deciding the triumphant class.
Both are observed to be compelling in accurate prediction of fault inclined modules. Also, the paper introduces an intensive and factually solid correlation of these techniques against ten different
classifiers regularly utilized as a part of the writing. Precise
prediction of fault inclined modules in software advancement process empowers compelling revelation and recognizable
proof of the deformities. LanGuo, et.al [3] have proposed a
novel technique for foreseeing fault inclined modules, in light of irregular woodlands. Arbitrary woodlands are an augmentation of choice tree learning. Rather than creating one choice tree, this strategy produces hundreds or even a large number of trees
utilizing subsets of the preparation information. Classification
choice is gotten by voting. We connected irregular timberlands
in five contextual analyses in light of NASA informational
collections. The prediction accurateness of the proposed approach is by and large higher than that accomplished by strategic relapse, discriminant examination and the calculations in two machine
learning software bundles, WEKA and See5. Rubinderjit Kaur,
et.al[4] have suggested that assessment of the fault inclination
of modules in open source software framework utilizing k-NN bunching calculation in light of Object-Oriented metrics. It has
Metric estimations of JEdit open source software for era of the
guidelines for the classification of software modules and from
there on accurately approval is performed. Result demonstrate that
the proposed approach can be utilized tastefully to find the fault
inclination in protest situated software segments. MattewEvett,
et.al[5] have proposed the hereditary programming (GP) based
framework for focusing on software modules for dependability
upgrade. The GP framework ,and gives a contextual investigation
utilizing software quality information from two genuine modern
undertakings. The framework is appeared to be sufficiently
powerful for use in mechanical areas. Marshima M. Rosli, et.al[6] have proposed the software improvement industry is to convey an
application with 100% deformities free. In any case, this test is
hard to accomplish by the software ventures since it include people and is not a robotized procedure done by applications, which
having faults is a typical things. Fault prediction is recognized
as one noteworthy region to anticipate the likelihood that the software contains faults. The goal of the fault prediction is to order the software modules in the classes of faulty and non-faulty modules as ahead of schedule as conceivable in software
improvement life cycle. Fault prediction show utilizing object
situated metrics esteems from web application as information esteems to the hereditary calculation to foresee the fault likelihood.
The point of the proposed configuration display is to build up a robotized device for software improvement gathering to find the
in all likelihood software modules in web applications to be high hazardous later on.
III. Empirical Data Collection
This study makes use of an Open Source dataset “Apache POI” [5]. Apache POI is a pure Java library for manipulating Microsoft documents. It is used to create and maintain Java API for manipulating file formats based upon the office open XML standards (OOXML) and Microsoft OLE2 compound document format (OLE2). In short, we can read and write MS Excel files using Java. In addition, we can also read and write MS word and MS PowerPoint files using Java. The important use of the Apache POI is for text extraction applications such as web spiders, index
builders, and content management systems. This system consists
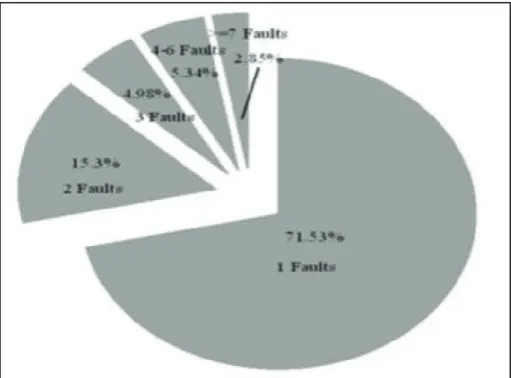
of 422 classes. Out of 422 classes, there are 281 faulty classes
containing 500 numbers of faults. It can be seen from fig. 1 that 71.53% of classes contain 1 fault, 15.3 % of classes contain 2 faults and so on. As shown in the pie chart, the majority of classes consist of 1 fault. Fig. 1 summarizes the distribution of faults and
faulty classes in the dataset.
Fig. 1: Distribution of Faults
IV. Software Fault Proneness
Software Fault Proneness is a key factor for monitoring and
controlling the quality of software. The effectiveness of analysis
and testing can be easily judged by comparing the predicted distribution of fault (Fault Proneness) and amount of fault found with testing (Software faultiness). Fault Proneness of a class
predicts the probability of the presence of faults in that class.
Software analysis and testing are complex and expensive activities.
Estimating and preventing the faults.
Early and accurately is better approach for reducing the testing efforts. If fault prone modules are known in advance, review, analysis and testing efforts can be concentrated on those modules.
V. Research Techniques
In this section, we summarize research techniques including logistic regression and machine learning techniques. The details on statistical and machine learning techniques can be obtained
from [1-3].
A. Descriptive Statistics, Outlier Analysis and Correlation Analysis
The statistics measures such as mean, median, standard deviation collected from the given data set can be used to obtain further information about the data that will help the researchers in data
filtering. Descriptive statistics provide summary about the data.
The measures having less than ten data points are removed from the analysis in this work.
Outliers are the data points located in an empty space of the total
data space. The outliers numerically lie far away from rest of the
data points. Data can be summarized by using measures of central
tendency (mean, median and mode) and measures of dispersion (standard deviation, variance, quartile).
There are two types of outliers: univariate and multivariate. Univariate outliers are those exceptional values that occur within a single variable and multivariate outliers are present within the
outlier must be made. The decision depends upon the reason why
the case is identified as outlier. In this paper univariate outliers
are determined by calculating the Z-score value of the data points
of the variable. The data values exceeding ±2.5 are considered to be outliers. Multivariate outliers are identified using Mahalanobis Jackknife [29] distance. Details on outlier analysis can be obtained
from [7].
Correlation analysis is used to provide information about
dependency amongst the variables. In this work we find correlation between OO metrics to gather information about redundancy amongst object oriented metrics. We use Pearson’s measure of correlation to test the correlation amongst object oriented
metrics.
1. Odds Ratio
It is defined as the probability of occurrence of an event divided
by the probability of occurrence of non-event. The event in this paper is faulty class and nonevent is probability of not faulty
class. An Odds Ratio with value 4 implies that dependent variable
(fault proneness) is multiplied by 4 when the independent variable
increases by 1 unit.
2. Coefficients (Ai’s) and Maximum Likelihood Estimation (MLE)
Coefficients in LR analysis are estimated by using MLE. The
likelihood function (L) maximizes Log(L) in order to compute the
coefficients. Large value of coefficients implies that independent variables (object oriented metrics) have stronger relationship with
the dependent variable (fault proneness).
3. Significance (sig)
The statistical significance implies that there is a significant
relationship between independent variables and the dependent
variable. In this paper we use 0.05 level as the significance
threshold.
B. Machine Learning Techniques
In this section the machine learning techniques used for feature selection and model prediction are described.
1. Correlation Based Feature Selection
In order to predict models using machine learning techniques, it is important to identify relevant and important features. A relevant feature is one that is correlated to the class and is less related to
other features. In this paper we use Correlation based Feature Selection (CFS) method to determine relevant object oriented
metrics and remove unwanted and noisy metrics. M.A Hall proved
in his research paper that “classification accuracy using reduced
feature set is equal or better than accuracy using complete feature
set”. CFS is based on correlation method and its advantages
include recurred dimensionality, improved predictive accuracy and reduced execution time.
2. Bagging
Bagging or Bootstrap Aggregating improves the performance of
classification models by creating various sets of the training sets. Leo Breiman proposed this technique in 1996. The aim is to create
numerous similar training sets and train a new function for each
of these sets. In the case of class prediction the result of majority
voting is considered. In order to construct multiple versions we create bootstrap duplicates of the learning set. These sets are then used as the new learning set. Bagging has the following
advantages [10]:
It can improve classification accuracy over other classification •
models.
It reduces variance.
•
It avoids overfitting. •
If we are given a training set Rn, with N samples from a population P, a bootstrap set Bi would also contain N samples. For each sample
of Bi we can draw any sample from R independently and with replacement from R. Hence we would obtain some samples being repeated in Bi and some samples being present in R but not in Bi. Hence the dataset Bi is as plausible as Rn but is drawn from R
rather than P. The bootstrap datasets are combined by taking the
average output and hence we get an aggregated prediction result
[10]. In this work we use Bag Size Percent of 100, 10 iterations and REP tree as classifier. These are the default setting provided
by the WEKA tool.
3. Random Forests
RF was proposed by Breiman and constructs a forest of multiple
trees and each tree depends on the value of a random vector.
For each of the tree in the forest, this random vector is sampled
with the same distribution and independently. Hence, random
forest is a classifier that consists of a number of decision trees.
The resultant output class is the mode of classes output by the
individual trees [10].
The algorithm for constructing the tree is as follows: For M training sets, N variables in the classifier and the variable n (n << N) where
n indicates the number of independent variables that determine the decision at the terminal node of the tree. A bootstrap training sample is selected. The best split is based on these n variables in the training set. Each tree is allow to grow fully and is not pruned.
RFs have the following benefits [10]: RFs are simple.
•
RFs are comparatively robust to outliers and noise. •
RFs provide give useful internal estimates of error, strength, •
correlation and variable importance.
RFs may produce a highly accurate classifier for various data •
sets.
RFs provide fast learning. •
In this paper, the number of decision trees in RF are taken as 10.
These were the default settings for WEKA tool.
4. Artificial Neural Networks
ANN uses Multilayer Perceptron (MLP) that is based on biological neurons, for model construction. ANN is used to model complex
relationships between inputs and outputs and is used to search
patterns in data set [3]. Multilayer feedforward network consists
of one input layer, one or more hidden layers and one output layer [4].
Each layer consists of nodes that are connected to their immediate preceding layers for input and immediate succeeding layers for output. Back-propagation is the most commonly used learning algorithm in order to train multilayer feed forward networks and consists of two passes (forward and backward) through the different layers of network. In the forward pass a training input data set is applied and a set of outputs are produced as the
actual response. In this pass weights of the network are fixed
and the effect is propagated through the network layer by layer
[34]. In the backward pass an error is calculated which is the
difference between the networks actual and desired output. The error calculated is propagated backward through the network and
to the desired response. The benefits of ANN are its non-linearity,
adaptivity, parallel architecture and fault tolerance.
5. Boosting Techniques
Boosting uses decision tree algorithm for creating new models. Boosting assigns weights to models based on their performance. There are many variants of boosting algorithms available in the literature. In this paper we evaluate the performance of two such
variants AB and LB designed for classification purpose. The
boosting algorithm works as follows:
Assign equal weights to all the instances in the data set.
•
For each iteration m do the following: •
i. Apply learning algorithm to weighted data and store results of the modes.
ii. Compute error err for each model.
iii. If value of err is zero or greater or equal to 0.5 stop model
prediction.
iv. For each instance in the data set do the following:
a. If instance is correctly predicted by the model multiply
instance by weight err/(1-err)
v. Normalize respective weights for each instance Classification
Assign zero weight to each class.
•
For each m models: •
a. Add –log(err/(1-err)) to previous weight of class.
Return class having highest weight.
•
LB uses additive LR for generating models and details can be obtained from.
6. Naïve Bayes and KStar
NB is a simple ad efficient algorithm for model prediction [38]. NB is based on probability based theorem and uses bayes theorem for classification purpose. KStar is an instance based learning algorithm that uses entropy distance measure [20]. It is based on
distance between instances. The details on both the techniques
can be obtained from [20, 38].
7. Performance Evaluation Methods
In order to validate the predicted models we use the following performance measures:
Sensitivity:
i. It is defined as the ratio of classes predicted as
faulty to the total number of classes actually faulty.
Specificity:
ii. It is defined as the ratio of classes predicted
as faulty to the total number of classes actually non-faulty.
Precision:
iii. It is defined as the ratio of classes predicted
correctly as faulty and non-faulty to the total number of classes.
ROC Analysis:
iv. The output of the predicted models can
be analyzed using ROC analysis. ROC curve is a plot of sensitivity (on the y-axis) and 1-specificity (on the x-axis). Many cut off points are selected between 0 and 1 while the construction of ROC curves. AUC is a measure obtained using ROC analysis. This gives optimal cut off point that maximizes both sensitivity and specificity. This measure is
very effective in measuring the quality of the predicted models
and is popularly being used in machine learning research [61].
The following rules can be used to categorize AUC:
If ROC = 0.5, then No discrimination •
If 0.7 <= ROC < 0.8, then Acceptable discrimination •
If 0.8 <= ROC < 0.9, then Excellent discrimination •
If ROC <= 0.9, then Outstanding discrimination •
In this paper, we use AUC as a measure to evaluate and assess the models predicted using machine learning techniques. We also use
ROC analysis to obtain optimal cutoff point that provides balance
between classes predicted as faulty and non-faulty.
8. Cross Validation Method
We use K-cross validation method in order to validate the predicted models. In K-fold cross-validation, the original data
set is partitioned into K subparts. The K-1 subparts are used as
training data and the single subpart is used as validation data. The cross-validation process is then repeated K times, with each of the K subparts used exactly once as the validation data. The result obtained from K folds results into a single estimation. This is popular method used in model validation. To obtain a realistic
estimate we use K=10 to validate the model.
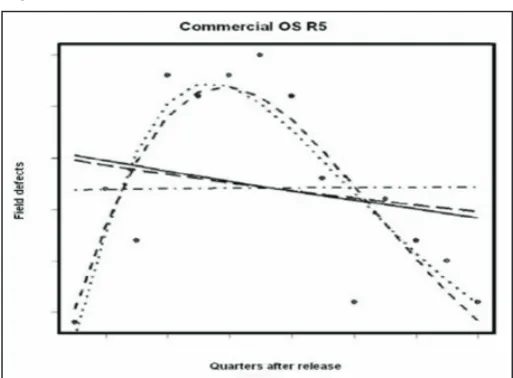
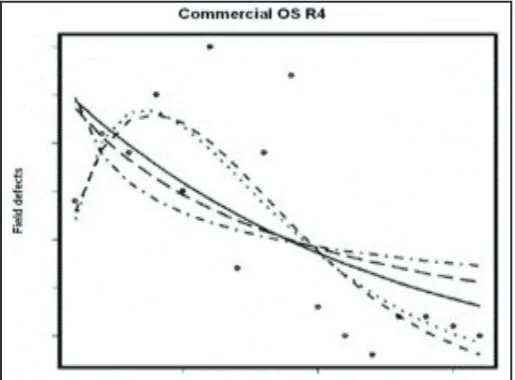
VI. Varying Field Defect Occurrence Patterns
The field defect occurrence patterns vary greatly between different releases. Figs. 4-7 provides a sample of four releases and their best post-facto fits.There are two implications. First, the diverse
patterns mean that the Weibull model is best suited to model
the field defect occurrence patterns since the Weibull is flexible enough to describe a wide range of patterns. This conjecture is
supported by the fact that top two prediction methods use the Weibull model. However, the model parameters of the Weibull are harder to predict. The errors in predictions are exaggerated by the Weibull model form; therefore, forecasts are not accurate.
This is the same conclusion reached by Li et al. in [1]. Secondly, since the field defect patterns vary greatly between releases, more
data are needed to distinguish between releases; however, we have limited data (at most 6 training data points) in our study.
Fig. 2: Actual Field Defects and Fitted Models for OS Release 3
Fig. 4: Actual Field Defects and Fitted Models for OS Release 5
Fig. 5: Actual Field Defects and Fitted Models for OS Release 6
Fig. 6: Legend for Figs. 4-7
VII. Conclusion
In this paper software fault prediction papers are analyzed future research on software fault prediction. We assessed papers with a particular concentrate on sorts of metrics, techniques, and datasets and did not portray all the prediction models in detail. The point was to characterize thinks about as for metrics, strategies, and datasets that have been utilized as a part of fault prediction papers. We assessed papers distributed previously, then after the
fact 2005 as for metrics, strategies, and datasets. We propose the
accompanying changes in software fault prediction look into: *Conduct more examinations on fault prediction models utilizing
class-level metrics. Despite the fact that object-oriented worldview
is broadly utilized as a part of industry, the use level of
class-level metrics are still past worthy class-levels. We require prediction models utilizing class-level metrics to anticipate faults amid
configuration stage and this kind of prediction is called early prediction. Notwithstanding classlevel metrics, the use rates of
segment level and process-level metrics are low. It is an open research zone to explore part level or process-level metrics for fault prediction issue.
Increase the utilization of open datasets for fault prediction
•
issue. It is exceptionally huge to utilize open datasets for fault prediction on the grounds that repeatable, refutable and obvious models of software designing must be worked with open datasets. Be that as it may, he use level of open datasets
is 31% for this audit and it is 52% for papers distributed after year 2005. In this way, we have to build the level of papers utilizing open datasets and 80% can be a perfect level.
Increase the models in view of machine learning systems.
•
As determined in this survey, machine learning models have preferred elements over factual techniques or master assessment based methodologies. In this manner, we should expand the rate use of the models in view of machine learning strategies.
References
[1] M. R. Lyu, Handbook of Software Reliability Engineering IEEE Computer Society Press, McGraw Hill, 1996. [2] B. W. Boehm, P. N. Papaccio,“Understanding and controlling
software costs,” IEEE Trans. on Software Engineering, Vol. 14, No. 10, pp. 1462–1477, 1988.
[3] F. G. Sayward A. J. Perlis, M. Shaw,"Software Metrics: An Analysis and Evaluation", MIT Press, Cambridge, MA, 1981.
[4] V. Y. Shen, T.Yu, S. M. Thebaut, L. R. Paulsen, “Identifying error-prone software: An empirical study,” IEEE Trans. on Software Engineering, Vol. SE-11, pp. 317–323, 1985. [5] S. G. Crawford, A. A. McIntosh, D. Pregibon,“An analysis
of static metrics and faults in C software,” J. Syst. Sofyware, Vol. 5, pp. 27–48, 1985.
[6] Liang Tian, AfzelNoore,“On-line prediction of software reliability using an evolutionary connectionist model”, Journal of System and Software, Vol.77, No.2, pp. 173-180, 2005.
[7] Liang Tian, AfzelNoore,“Evolutionary neural network modeling for software cumulative failure time prediction”, Reliability Engineering and System Safety, Vol. 87, No. 1, pp. 45-51, 2005.
[8] Q.P. Hu, M. Xie, S.H. Ng, G. Levitin,“Robust recurrent neural
network modeling for software fault detection and correction
prediction”, Reliability Engineering and System Safety, Vol. 92, No. 3, pp. 332-340, 2007.
[9] T. M. Khoshgoftaar, E. B. Allen, ZhiweiXu,“Predicting testability of program modules using a neural network”, In Proc. of 3rd IEEE Symposium on Application-Specific Systems and Software Engineering Technology, pp.57-62, 2000.
T. Ravi Kumar received M.Tech
degree in Computer Science and Engineering from Jawaharlal Nehru
Technological University Hyderabad,
A.P., India. And B.tech in computer Science and Information Technology from Jawaharlal Nehru Technological University Hyderabad, A.P., India. He is having 10 years of experience in teaching and presently working as Sr Assistant Professor in the Department of Computer Science and Engineering
at Aditya Institute of Technology and Management, Tekkali
[AITAM], A.P., India. His area of research includes Software Engineering, Fuzzy logic and Software Testing Methodologies.
Dr T. Srinivas Rao received B.Tech degree from GITAM, Andhra University, Visakhapatnam A.P., India.
Received M.Tech degree from Andhra
University, Visakhapatnam, A.P., India. Received Ph.D. degree from Andhra University, Visakhapatnam, A.P., India. Presently he is working as Associate Professor, Department of CSE, Gitam Institute of Technology, GITAM University, Visakhapatnam. He is having 17 years of Teaching
Experience. His research interest
includes wireless communication (WiFi, WiMax), Mobile Ad-hoc Networks, Sensor Networks, Neural Networks and fuzzy logic, Communication networks, Data mining, software engineering,