Classification of Complex UCI Datasets Using Machine Learning
Algorithms Using Hadoop
Mohit1, Rohit Ranjan Verma2, Sameeksha Katoch3 , Ashoka Vanjare4 and S N Omkar5
1
Computer Science department, NIT Srinagar, Srinagar, Jammu and Kashmir, INDIA 2
Information Technology ,NIT Srinagar, Srinagar, Jammu and Kashmir, INDIA 3
Electronic and communication department, NIT Srinagar, Srinagar, Jammu and Kashmir, INDIA 4, 5
Aerospace Engineering Department, IISc, Bangalore, Karnataka, INDIA
1
[email protected], [email protected], [email protected], [email protected], 5
ABSTRACT
Classification is one of the most researched questions in machine learning and data mining. Classification is a gradual practice for allocating a given piece of input into any of the known category. The Data Mining refers to extracting or mining knowledge from huge volume of data. In this paper different classification techniques of Data Mining are compared using diverse datasets from University of California, Irvine (UCI) Machine Learning Repository. Accuracy and time complexity for execution by each classifier is observed. Finally different classifiers are also compared and accordingly which classifier is best for respective datasets is observed.
Keywords: Data Mining, J48, Decision Table, Naïve Bayes, OneR, Random Forest, Hadoop, HDFS, R Environment.
1. INTRODUCTION
Machine learning evolved from the broad field of artificial intelligence [1]. It explores the construction and study of algorithm that can make predictions on data. It is used to optimize a performance criterion using example data or past experience. The algorit-hms are used to solve the optimization problem and to represent and evaluate the models for inference. Machine learning is the body of research related to automated large scale data analysis. Data mining is the computational process of discovering patterns in large data sets and in order to extract information from it and transform it into an under-standable structure for future use [2].
Classification which is considered as an instance of supervised learning is the problem of identifying to which set of categories a new observation belongs, it is considered as an algorithmic process by which data (observations, measurements etc.) are labeled with predefined classes. Classification is one of the widely
used supervised data mining techniques. It is the process of forming model that described the data classes and concepts. The main purpose is to predict the class of objects using the model for unknown class label. The classification model is generated using training data sets and the derived model can be present in many forms like table, trees or rules.
An algorithm that implements classification is known as classifier. Classification has many real life applications including computer vision, medical imaging, speech recognition, toxic genomics etc. In machine learning the observations which are to be classified are termed as instances, the explanatory variable are termed feature (grouped into feature vector) and the categories to be predicted are classes. This whole process has two steps including learning and testing. The former means learning a model using the training data and the latter means testing the model using unseen test data to assess the model accuracy.
2. CLASSIFIERS
The following work includes performance evaluation of Machine Learning Algorithms. The machine learn-ing algorithms used are
2.1 J48
label, a value or an action to describe or to elaborate its data points. At each node of the tree, C 4.5 chooses one attribute of the data that most effectively splits its set of samples into subsets enriched in one class or the other.
2.2 Decision Tables (DTs)
Decision tables are used as tabular representation for describing and analyzing situations. The decision i.e. action is taken depends upon number of conditions and their interrelationships. Various forms of interaction are used to make this visualization more useful than other static designs. Many decision tables include in their condition alternatives the don'tcare symbol, a hyphen. Using don'tcares can simplify decision tables, especially when a given condition has little influence on the actions to be performed. In some cases, entire conditions thought to be important initially are found to be irrelevant when none of the conditions influence which actions are performed [4].
2.3 Naïve Bayes
The Naive Bayesian classifier is based on Bayes’ theorem with independence assumptions between predictors. A Naive Bayesian model is easy to build, with no complicated iterative parameter estimation which makes it particularly useful for very large datasets. Despite its simplicity, the Naive Bayesian classifier often does surprisingly well and is widely used because it often outperforms more sophisticated classification methods.
2.3.1Algorithm
Bayes theorem provides a way of calculating the posterior probability, P(c|x), from P(c), P(x), and P(x|c). Naïve Bayes classifier assume that the effect of the value of a predictor (x) on a given class (c) is independent of the values of other predictors. This assumption is called class conditional independence.
P(c|x) is the posterior probability of class (target) given predictor (attribute).
P(c) is the prior probability of class.
P(x|c) is the likelihood which is the probability of predictor given class.
P(x) is the prior probability of predictor.
2.4 REPTree
REPTreeis a fast decision tree learner which builds a decision/regression tree
Using information gain as the splitting criterion, and prunes it using reduced error pruning.
It only sorts values for numeric attributes once. Missing values are dealt with using C4.5’s
Method of using fractional instances [5].
2.5 MULTILAYER PERCEPTRON
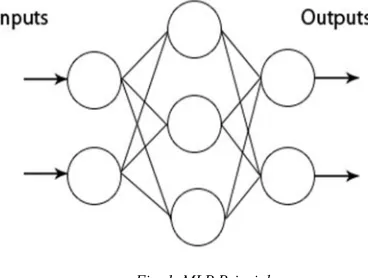
A multilayer perceptron (MLP) is a feedforward artificial neural network model that maps sets of input data onto a set of appropriate outputs. A MLP consists of multiple layers of nodes in a directed graph, with each layer fully connected to the next one. Except for the input nodes, each node is a neuron (or processing element) with a nonlinea-r activation model.MLP utilizes a supervised learn-ing technique called back propagation for training the network. MLP is a modification of the standard linear perceptron and can distinguish data that are not linear separable.
Fig. 1. MLP Principle
MLPs were a popular machine learning solution in the 1980s, finding applications in diverse fields such as speech recognition, image recognition, and machine translation software but since the 1990s have faced strong competition from the much simpler (and related) support vector machines.
2.6 AdaBoost
algorithms ('weak learners') is combined into a weighted sum that represents the final output of the boosted classifier. AdaBoost is adaptive in the sense that subsequent weak learners are tweaked in favor of those instances misclassified by previous classifiers. AdaBoost is sensitive to noisy data and outliers. In some problems, however, it can be less susceptible to the overfitting problem than other learning algorithm-s. The individual learners can be weak, but as long as the performance of each one is slightly better than random guessing (i.e., their error rate is smaller than 0.5 for binary classification), the final model can be proven to converge to a strong learner.
2.7 OneR
OneR, short for "One Rule", is a simple, yet accurate, classification algorithm that generates one rule for each predictor in the data, then selects the rule with the smallest total error as its "one rule". To create a rule for a predictor, we construct a frequency table for each predictor against the target. It has been shown that OneR produces rules only slightly less accurate than state-of-the-art classification algorithms while producing rules that are simple for humans to interpret
.
2.8 Random forest
Random forests are an ensemble learning method for classification, regression and other tasks, that operate by constructing a multitude of decision trees at training time and outputting the class that is the mode of the classes (classification) or mean prediction (regression) of the individual trees. Random forests correct for decision trees' habit of overfitting to their training set.
Each tree is grown as follows:
1. If the number of cases in the training set is N, sample N cases at random - but with replacement, from the original data. This sample will be the training set for growing the tree.
2. If there are M input variables, a number m<<M is specified such that at each node, m variables are selected at random out of the M and the best split on these m is used to split the node. The value of m is held constant during the forest growing.
3. Each tree is grown to the largest extent possible. There is no pruning.
3. DATASET DESCRIPTION
3.1 Iris
It has 150 instances, 4 attributes namely sepal length, sepal width, petal length and petal width and 3 classes namely iris setosa, iris virginica, and iris versicolor.
3.2 Soybean
It is the description of Soybean disease. It has 683 instances, 35 attributes and 19 classes.
3.3 Vote
This data set includes votes for each of the U.S. House of Representatives Congressmen on the 16 key votes identified by the CQA. The CQA lists nine different types of votes: voted for, paired for, and announced for (these three simplified to yea), voted against, paired against, and announced against (these three simplified to nay), voted present, voted present to avoid conflict of interest, and did not vote or otherwise make a position known (these three simplified to an unknown disposition). .It has 435 instances, 16 attributes and 2 classes namely democrat and republican.
3.4 Glass Identification Dataset
It has 9 attributes (Refractive index, Sodium, Pottasium, Magnesium, Aluminium, calcium, Silicon, Barium and iron content) and consist of 214 instances of 7 different classes namely Building windows Float proceesed glass, Vehicle windows float processed glass, Buliding windows non-float processed glass , vehicle windows non-float processed glass, containers non-window glass, table ware non-window glass and headlamps non – window glass
.
3.5 Connect-4
3.6 Covertype
Predicting forest cover type from cartographic variables only (no remotely sensed data). The actual forest cover type for a given observation (30 x 30 meter cell) was determined from US Forest Service (USFS) Region 2 Resource Information System (RIS) data. Independent variables were derived from data originally obtained from US Geological Survey (USGS) and USFS data. Data is in raw form (not scaled) and contains binary (0 or 1) columns of data for qualitative independent variables (wilderness areas and soil types). It has 581012 instances, 54 attributes and 7 Classes: namely 1:Spruce/Fir, 2:Lodgepole,Pine, 3:PonderosaPine, 4:Cottonwood/Willow, 5:Aspen, 6:Douglas-fir, 7:Krummholz
3.7 PENDIGITS
It has Pen-Based Recognition of Handwritten Digits. It has 3498 instances, 16 attributes and 10 classes.
4. Methodology
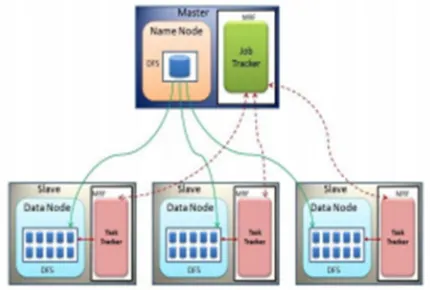
4.1 Hadoop
Its a software/library [6] of highly scalable frameworks that allows for distributed processing of large datasets across clusters of computers using a simple programming model. Internally Hadoop is a java implementation of map reduce[7] ,which is a popular software architecture that facilitates processing of large amount of data in a distributed fashion. The application creates its own mapper and reducer implementations, register the mapper and reducer classes into a Hadoop job, indicate the location of the input and output and preprocess it to the Hadoop framework .The framework takes care of reading the data from the input location, invokes the mapper and reducer application classes when needed in a concurrent and distributed fashion and writes the result to the output locations. Hadoop input and output are always read from the Hadoop Distributed File System (HDFS).
4.2 Hdfs
HDFS[8] is a distributed, scalable and handy file system written in java for the Hadoop framework. It is the file system component of Hadoop. It stores file system metadata and applications data separately. As in the other distributed file system such as PVPS,GFS, HDFS
stores metadata on a keen server called the namenode. The application data are stored on other machines called datanodes. All machines are totally connected with the
servers and communi-cate with each other using TCP-based protocols.
HDFS basically follows the “master-slave archite-cture” and has the following elements:
4.2.1 Datanode
These nodes manage the data storage of their system and perform the following operations:
Perform read-write operations on the file systems, as per client request.
Perform operations such as block creation, deletion, and replication according to the instructions of the namenode.
It also reduces the data loss and prevents corruption of the file system.
4.2.2 Namenode
The system having the namenode acts as the master server and it does the following tasks:
1.Manages the file system name space.
2.This node maintains the index and location of every data node.
3.Regulates client’s access to files.
4.It also executes file system operations such as renaming, closing, and opening files and directories.
4.2.3 Block
The data is stored in the files of the HDFS. This file in the file system will be divided into one or more segments and/or stored in individual data nodes. These file segments are called as blocks. In other words, the minimum amount of data that HDFS can read or write is called a Block. The default block size is 64MB, but can be increased as per the need to change in HDFS configuration.
HDFS stores 3 separate copies of each data block to ensure reliability, availability and performance. In large clusters, the three replicas are spread across different physical racks so HDFS is resilient towards too common failure scenarios, individual datanode crashes and failures in networking equipment that bring an entire rack offline. Replicating blocks across physical machines also increases opportunities to co-locate data & processing in the scheduling of Map-Reduce jobs, since multiple copies yield more opportunities to exploit locality.
4.3 Weka
Weka, formally called Waikato environment for knowledge learning is a computer program that was developed at the university of Waikato in new Zealand for the purpose of identifying information from raw data gathered from agricultural domains. Weka supports many different standard data mining tasks such as data preprocessing, classification, clustering, regression, visualization, feature selection etc. The basic premise of the application is to utilize a computer application that can be trained to perform machine learning capabilities and derive useful information in the form of trends and patterns. WEKA is an open source application that is freely available under the GNU general public license agreement [9-11]. Weka operates on the prediction that each data object is described by a fixed no of attributes that usually are of specific type, normal alpha-numeric or a tool to identify hidden information from database and file systems with simple to use options and visual interfaces.
Steps followed
Single node cluster
1. Installed Ubuntu 14.04
2. Installed Weka and then Distributed Weka Hadoop package.
a. For installing DistributedWekaHadoop, open Weka GUI, go to
Tools->Package Manager, there you will see DistributedWekaHadoop Package, install it and restart the GUI. Then open KnowledgeFlow from GUI and you will see Hadoop option in the Design panel of the KnowledgeFlow.
Installed Hadoop 1.2.1 as it is compatible with DistributedWekaHadoop package in Weka.
Installed and configured Hadoop-1.2.1 .
To perform the analysis, open KnowledgeFlow and copy the WekaClassifierHadoopJob option from Hadoop in Design panel to the KnowLedgeFlow layout. The WekaClassifierHadoopJob will be now displayed in the KnowLedgeFlow layout.
6.Similarly copy TextViewer option from Visualization in Design panel to the KnowLedgeFlow layout.
Now right click on the WekaClassifierHadoopJob and select text option and then click on the TextViewer so that an arrow is formed pointing towards the TextViewer which depicts that after performing analysis results are displayed through the TextViewer. Configure WekaClassifierHadoopJob according to the Single Node Cluster.
9.For configuring it double click on the WekaClassifierHadoopJob. A panel will pop up having three components namely Hadoop Configurations (for setting up the ports, HDFS path, outputPath, etc.), ARFF header/CSV Parsing (conversion of CSV dataset to ARFF dataset on which the analysis will be performed) and WekaClassifierHadoopJob (for selection of which algorithm to use, what filters to use, no of crossfolds etc.).
Set the values according to each field carefully. After configuring it run the analysis.
Note the accuracy given by it and time required for execution by double clicking on TextViewer.
Repeat steps 9, 10 and 11 for different algorithms on different datasets.
Compare the different accuracy provided by the dataset with different classification algorithms and identify the significant classification algorithm for particular dataset.
Facility, a suite of operators for calculations on arrays, in particular matrices, a large, coherent, integrated collection of intermediate tools for data analysis, graphical facilities for data analysis and display either directly at the computer or on hardcopy.
R is very much a vehicle for newly developing methods of interactive data analysis. It has developed rapidly, and has been extended by a large collection of packages. Graphical facilities are an important and extremely versatile component of the R environment. R plotting commands can be used to produce a variety of graphical displays and to create entirely new kinds of display. In results Ranking is done on the basis of accuracy and time complexity and is used to determine which algorithm performs better.
Experimental Setup
The Experiments are conducted in a system with configuration:
Processor: Intel(R) Core (TM) i7-3632QM CPU @ 2.20GHz.
5. Results
5.1 The “R” Environment
R is an integrated suite of software facilities for data manipulation, calculation and graphical display. Among other things it has an effective data handling and storage.
Table1: For IRIS Dataset
AlgoName Accuracy Time Ranking
Random forest 94.667 41 6
J48 96 41 3
Naïve Bayes 96 41 2
Multilayer Perceptron 96.667 41 1
Decision Table 92.667 41 7
REPTree 94.667 40 5
OneR 92 40 8
AdaBoost 95.3333 40 4
Graph. 1. IRIS ACCURACY VISUALIZATION
Graph. 2. IRIS TIME VISUALIZATION
Table2: For Soyabean Dataset
AlgoName Accuracy Time Ranking
random forest 93.883 41 2
J48 94.1489 41 1
Naïve Bayes 92.0213 41 4
Multilayer Perceptron 92.5532 91 3
Decision Table 81.383 40 6
REPTree 84.0426 41 5
OneR 44.1489 41 7
AdaBoost 30.8511 40 8
Graph. 3. SOYABEAN ACCURACY VISUALIZATION
Graph. 4. SOYABEAN TIME VISUALIZATION
Table3: For Vote Dataset
AlgoName Accuracy Time Ranking
random forest 96.3218 41 2
J48 96.3218 41 1
Naïve Bayes 95.1724 41 6
Multilayer Perceptron
94.9425 51 7
Decision Table 94.9425 41 8
REPTree 95.1724 41 5
OneR 95.6322 40 3
AdaBoost 95.4023 40 4
Graph. 6. VOTE TIME VISUALIZATION
Table4: For Glass Dataset
AlgoName Accuracy Time Ranking
random forest 98.1308 41 1
J48 97.1963 41 3
Naïve Bayes 84.1121 41 7
Multilayer Perceptron
94.8598 41 6
Decision Table 97.1963 41 4
REPTree 96.729 41 5
OneR 97.6636 41 2
AdaBoost 67.757 41 8
Graph. 7. GLASS ACCURACY VISUALIZATION
Graph. 8. GLASS TIME VISUALIZATION
Table5: For Connect-4 Dataset
AlgoName Accuracy Time Ranking
random forest 82.3926 541 1
J48 80.8428 61 2
Naïve Bayes 72.142 40 6
Multilayer Perceptron 80.6371 4451 3
Decision Table 73.5409 1181 5
REPTree 76.8551 51 4
OneR 66.1353 51 7
AdaBoost 65.8303 51 8
Graph. 9. CONNECT-4 ACCURACY VISUALIZATION
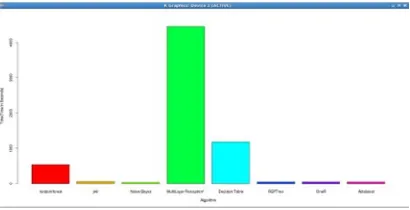
Graph. 10. CONNECT-4 TIME VISUALIZATION
Table 6: For Covertype Dataset
AlgoName Accuracy Time Ranking
random forest 91.673 952 1
J48 89.4916 541 2
Naïve Bayes 62.3693 151 7
Multilayer Perceptron
77.4197 7403 5
Decision Table 81.151 22945 4
REPTree 87.3271 101 3
OneR 67.1015 51 6
Graph. 11. COVERTYPE ACCURACY VISUALIZATION
Graph. 12. COVERTYPE TIME VISUALIZATION
Table 7: For Pendigits Dataset
AlgoName Accuracy Time Ranking
random forest 98.8279 51 1
J48 95.0257 41 2
Naïve Bayes 80.4174 41 5
Multilayer Perceptron 93.7965 181 3
Decision Table 72.6987 51 6
REPTree 92.5958 41 4
OneR 38.3934 41 7
AdaBoost 20.526 41 8
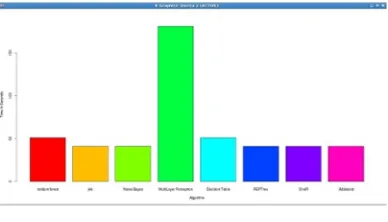
Graph. 13. PENDIGITS ACCURACY VISUALIZATION
Graph. 14. PENDIGITS TIME VISUALIZATION
Analysis of IRIS data set using Hadoop and R visualization revealed that MLP gave best accuracy while OneR performed worst. (Table 1 and Graph 1) Similarly for Soyabean data set J-48 showed best accuracy followed by Random Forest and MLP. (Table 2 and Graph 3)
For Vote data set both J-48 and Random Forest gave same accuracy followed by OneR which performed worst in case of IRIS data set. (Table 3 and Graph 5) When similar analysis was done for Glass data set it depicted that Random Forest gave the best accuracy followed by OneR while Adaboost performed worst. (Table 4 and Graph 7)
For Connect-4, Covertype and Pendigits data set Random Forest gave the best accuracy for all three followed by J-48. (Table 5,6,7 and Graph 9,11,13) Except for Vote and IRIS data set, Adaboost gave the worst accuracy in all the cases.
As far as Time Complexity is concerned it gave almost similar results for all data sets however since analysis is done in Hadoop, time complexity is much improved as compared to analysis in Sequential.
6. CONCLUSIONS AND DISCUSSIONS
In this study we have compared the performance of various classifiers. Seven data sets from benchmark data set (UCI) are used for experimentation. Numbers of cross-folds in each case are 10. In general it is found that the performance of classification techniques varies with different data sets. Factors that affect the classifier’s performance are:
1. Data set
2. Number of instances and attributes 3. Type of attributes
In terms of overall performance if we consider Accuracy and Time Complexity of Random forest , J48 ,Naïve Bayes , MLP , Decision Table , REPTree , OneR , AdaBoost according to the rankings, for IRIS, MLP performed best; for Soyabean and Vote, J48 performed best; for Glass, Random Forest performed best ; for Connect-4 , Covtype and Pendigits, Random Forest performed best; AdaBoost performed worst in almost all the cases . According to our results for Soyabean, J48 performed best; for Glass, random forest performed best whereas for Vote both J48 and Random Forest were equally good. For Glass and
Vote similar results
were reported however for Soyabean, it was
seen
that MLP performed best [12].As this work is focussed on single node cluster in Hadoop distributed environment, it can be concluded from results section that accuracy given by Hadoop single node cluster is appreciable in almost all datasets. In case of datasets accuracy given by Random Forest is the highest. The Time complexity of Random Forest increases as the number of instances increases in the datasets.
Time complexity charts for different datasets show similarity but when we compare with sequential then Hadoop is better in case of time complexity. The height of the bar for Random Forest is lowest in every graph. After Random Forest, J48 followed by MLP had excellent accuracy as compared to others in Distributed Weka Hadoop.
REFERENCES
[1] G. Ratsch. A Brief Introduction into Machine Learning, Friedrich Meischer Laboratory of the Max Planck Society, 2004.
[2] H. Witten and E. Frank "Data Mining: Practical machine leaming tools and techniques", 2nd Edition, Morgan Kaufmann, San Francisco, 2005.
[3] S. Wang, M Zhou and G. Geng, Application of Fuzzy cluster analysis for Medical Image Data Mining In proceedings of the IEEE International Conference on Mechatronics & Automation Niagra falls, Canada, July 2005.
[4] R. Kohavi, The Power of Decision Tables. In: 8th European Conference on Machine Learning, 1995 pp 174-189.
[5] Package-weka.classifiers.trees,
http://wiki.pentaho.com/display/DATAMINING/REPT ree”
[6] Z. Yang, Y. Zhu, and Y. Pu,“Parallel image processing based oncuda,” in Proceedings of the 2008 International Conference on Computer Science and Software Engineering - 2008, Volume 03, ser.CSSE ’08. IEEE Computer Society, pp. 198–201.
[7] "Hadoop programming model”
http://adcalves.wordpress.com/2010/12/12/a-hadoopprimer/
[8] K Shvachko, H Kuang, S Radia, R Chansler The Hadoop Distributed File System, IEEE 26th Symposium on Mass Storage Systems and Technologies (MSST), 2010 pp 35-40
[9] I.H. Witten, "Data Mining Practical Machine Learning Tools and Techniques with Java Implementation", Morgan Kautmann Publishers, 2000.
[10]Weka home page, http://www.cs.waikato.ac.nz/-mJ/weka/index.htmJ
[11]Banshad Mobasher, "Data Preparation and Mining with Weka - ATutorial", http://maya.cs.depaul.edul-classes/ect584/Wekal
[12]A Gupta, Classification of Complex UCI Datasets Using Machine Learning and Evolutionary Algorithms, International Journal of Scientific and Technology Research Volume 4, No. 05, 2015, pp. 85-94.
AUTHOR PROFILES:
Mohit is currently pursuing bachelor in Computer Science from National Institute of Technology, Srinagar (IN). Mohit interests include Big Data, Data mining, Data analysis, Machine Learning ,Data structures, Networks, Operating systems, Algorithms Design and Programming.
Rohit Ranjan Verma is currently pursuing bachelor in Information Technology from National Institute of Technology, Srinagar (IN). Rohit interests include Big Data, Database, Data structures, Algorithms Design and Programming.
Sameeksha Katoch has completed her bachelor in Electronics and Communication with distinction from National Institute of technology Srinagar (IN).Sameeksha interests include Wireless Communication, Data mining and Image Processing.
Ashoka Vanjare is currently Research Assistant at Department of Aerospace Engineering, Indian Institute of Science Bangalore (IN). Ashoka has received Gold Medal for excellence in Academics during his Masters in Computer Application. Ashoka interests include Data Mining, computational Imaging, Vision algorithms, Machine learning
and Remote Sensing.