11 | International Journal of Computer Systems, ISSN-(2394-1065), Vol. 05, Issue 05, May, 2018 International Journal of Computer Systems (ISSN: 2394-1065), Volume 05– Issue 05, May, 2018
Available at http://www.ijcsonline.com/
Survey in software Reliability Growth Models: Parameter Estimation and
Models Ranking
Prof. Amjad HudaibȦ, and Mahmoud MoshrefḂ
Ȧ Department of Computer Information Systems, the University of Jordan, Amman, 11942, Jordan Ḃ Computer Science Department, the University of Jordan, Amman, 11942, Jordan
Abstract
Reliability is the important critical issue in software quality because we use it to test the successful of the software project. In past few decades' number of software reliability growth models (SRGMs) proposed to improve the estimation of software reliability measures such as the number of residual faults, software failure rate, and software reliability. An optimal SRGM for use in a particular case has been an area of interest for researchers to increase error estimation and save time and money. There are several optimization techniques are used to estimate SRGMs parameters to accurately predict the number of faults in software early on the testing process. Other important issue in software reliability is how to select an appropriate SRGM to test the software project, the researcher in this filed use several techniques to do ranking for SRGMs. These paper study characteristics of each software reliability models, methodologies that are used to improve parameter estimation, and models ranking.
Keywords: T SRGMs, parameter estimation, models ranking.
I. INTRODUCTION
Nowadays software development become the most issue that affect our life. Because software is used in every field of our life. Nobody can think about a life without the devices controlled by software. But there is an emergent need to ensure reliability of developing software as early as possible [1].
Software quality has become more critical to deliver good software, software reliability is one of the highest concern by developers and project managers with the considerations of business profitability, user safety and preservation of the environment. Reliability consider an important factor to consider in the software development life cycle because unreliable software has high probability of containing some errors or bugs that may cause system failure to occur [2].
For measuring reliability many issue considered, such as the accurateness of time to failure, the time to failures sequence, and failure mode data. Evaluating and improving software reliability requires many techniques, and nearly all of these techniques depend upon constructing prediction models with the ability to predict upcoming faults under diverse testing situations. These models are generally named Software Reliability Growth Models (SRGMs), which is widely used in many different software domains such as telecommunications, embedded systems, military, banking and industrial control systems [2][3]. Many research proved that using Software Reliability Growth Models (SRGMs) more reliable than other models, because it used early during the software development life cycle.
Various software reliability growth models (SRGM) has been introduced for predicting the reliability of a software future faults under different testing conditions. These model such as Logarithmic model, Exponential (Goel-Okumoto model), Power model, S-shaped (Yamada Shaped model), and Inverse Polynomial model. But There is no acceptable model that can be trusted to give accurate results in all states, so users should not trust in any SRGM, every model has some advantages and some disadvantages, to choose an appropriate reliability model for suitable domain, several techniques are proposed these techniques for optimizing parameter estimation, and model selection ranking [1][3] [6] [18].
Some of these optimization technique such as Genetic Algorithm (GA), Ant colony algorithm (ACO), Particle Swarm Optimization (PSO), Cukoo Search (CS), Simulated Annealing (SA), Modified Genetic Swarm Optimization (MGSO), and Learning approaches used to estimate the optimal parameters for SRGMs.
II. SOFTWARE RELIABILITY GROWTH MODELS
Software Reliability can be defined as: “The probability that a system or product will perform in a satisfactory manner for a given period of time when used under specified operating conditions in a given environment". Over the past few years Software reliability growth models have been applied to portions of several releases to improve software reliability and help in estimating the reliability of software system before its release to market [3] [25].
There are two types of software reliability models: The defect density model which refer to those models that try to predict software reliability from design parameters, and use code characteristics such as nesting of loops, number of lines, input/output to estimate the number of defects in the software. The second type, Software reliability growth models, refers to those models that try to predict software reliability from test data. These models try to show a relationship between fault detection data (i.e. test data) and known mathematical functions such as logarithmic or exponential functions, Software Reliability Growth Model is a mathematical statistical expression used in software
reliability prediction. SRGMs can be classified as either
parametric or non-parametric models. The most famous parametric models are the Non-Homogeneous Poisson Process (NHPP) models. But using Non-parametric models have less restricted assumptions as they can predict reliability based only on defect data [3] [5] [7] [12].
Software reliability is the probability that software will not cause the failure of a product for specified time under specified conditions. Any software reliability model presents a mathematical function which illustrates defect detection rates. These models are classified in two categories: Concave and S-shaped models as in figure 1. Concave models are so-called because they bend downward. S-shaped models like S letter, on the other hand, are first convex and then concave. This reflects their underlying assumption that early testing is not as efficient as later testing [18] [19].
SRGMs are classified as the black box models and are used for removal of faults various types of SRGMs have been developed and implemented in many different industry sectors. These models are further classified into two types, namely: failure rate models which is calculated by m(t) function, and failure intensity models used (t) or as known as non-homogeneous Poisson process (NHPP) models [2].
Other consider Analysis methods of software reliability can either be white box or black box reliability analysis, in white box the reliability prediction in architecture information level to estimate failures. But in block box software reliability growth models the reliability assessment use real failure information to estimate the release time, this model depends on two parameters [3]. Discuss assumption of some of the SRGMs in the following [3] [5] [11] [12] [14] [18] [23]:
Fig 1. Concave and S-shaped models [18]
A. The exponential model (Goel-Okumoto Model)
The prediction of the model can be given as: (t)= a (1− e-bt
) (1) [2] [3] [5] [18] [23] (t) = a b e−bt (2) [2] [3] [5] [18] [23]
(t) represent the mean failure function and (t) represent failure intensity function, the parameters (a) is the initial estimate of the total failure recovered at the end of the testing process. (b) represents the ratio between the initial failure intensity and total failure. This model is known as finite failure model which modeled as NHPP. In this model all fault in the software are independent from the failure detection point of view. And the number of failures detected at any time is proportional to the current number of faults in the software. This means that the probability of the failures or faults actually occurring, being detected, is constant [3].
B. The Power Model:
The This model has the objective of computing the reliability of hardware systems during testing process it based in NHPP. Equation (3), and (4) represent the prediction of these model:
(t) = a t b (3) [2] [3] [5] [18] [23] (t) = a b t eb−1 (4) [2] [3] [5] [18] [23] C. The Yamada Delayed S-Shaped Model
The Delayed S-Shaped Model is of the gamma distribution class. But the number of failures per time period is a Poisson type with the use of the classification scheme of Musa and Okumoto rather than considered as Binomial. The model represents a learning process since some improvement was added to the exponential model based the growing experience of the project team. This model is also a finite failure model. The system equation
for (t) and (t) are [3]:
(t) = a (1− (1 + b t) e−bt (5) [2] [3] [5] [18] [23] (t) = a b2 t−bt (6) [2] [3] [5] [18] [23]
This model based in the following assumptions: All faults in the software are independent from the failure detection point of view. The probability of failure detection at any time is proportional to the current number of faults in the software. And the proportionality of failure detection is constant [18].
D. Musa-Okumoto Logarithmic Model
This is continuous time-independently distributed inter failure time model. Means that there are N software faults at the start of testing, each is independent of others. This is a modification of the J-M model where a geometrically decreasing hazard function is introduced, considering that only one fatal error is removed during each debugging interval. Faults are not removed until the occurrence of a fatal one at which time the accumulated group of faults is removed. The hazard function after a restart is a fraction of the rate which was attained when the system crashed. The Prediction Model form is given as [3]:
(t) = a ln (l + b t) (7) [2] [3] [5] [18] [23]
(t) = a b / ( 1 + b t) (8) [2] [3] [5] [18] [23] Other SRGMs which depend on three parameters such as: Gompertz Growth.
E. Gompertz Growth Curve Model
The (t) = a kbt (9) [2] [3] [5] [18] [23]
(t) = a b ln(k) ke[-bt] e[-bt] (10) [2] [3] [5] [18] [23] where:
a: is the expected total number of faults to be detected. b, and k: parameters whose values estimated using regression analysis.
III. LITERATURE REVIEW IN PARAMETER ESTIMATION AND MODELS RANKING
Several techniques used to estimate SRGMs parameter such as:
A. Parameter Estimation Techniques
A software reliability model is a function that estimating its parameter from the data, there are several approaches or techniques that are used to estimate the parameters of SRGMs. The first one is to input the data directly in the equations for the parameters, such as maximum likelihood technique which is used for statistical models. The second approach is fitting the curve describe the function of the data and estimating the parameters from the best fit of the curve. The method that are used in this approach such as least squares estimation (LSE) technique. but most reliability models have nonlinear relationship between parameters, and the optimal parameter estimation by traditional method is difficult and suffer from many problems, so we can use other techniques to estimate the parameters such as searching techniques which can find minimum solution but not optimal. Final researchers in this field tend to use
evolutionary algorithms e.g Genetic Algorithm (GA), and Particle Swarm Optimization (PSO) to get an optimal estimation to SRGMs parameters, the purpose is to discover a set of parameters that provide the best fit to a measured data based on a function to be optimized [3] [18]. In these section after we discuss some of well-known parameter estimation techniques and methodologies we illustrate it in Table 1.
To compare or evaluate SRGMs after parameter optimization various criteria have been used such as equation 11, 12, and 13:
1- Accuracy of Estimation (AE)
1 1
1
( )
k k
i i
i i
k
i i
m m t
A E
m
(11) [2]
2-Mean Square Error (MSE)
2 1
(
( ))
k
i i
i
m
m t
MSE
k
(12) [2]3-Root Mean Square Error (RMSE)
2
1
(
( ))
k
i i
i
m
m t
RMSE
k
(13) [2]A.1 Parameter Estimation Using Particle swarm optimization (PSO)
PSO algorithm provided more accurate or better prediction quality compared to those estimated using LSE and BFO methods. This is because compared to numerical method LSE or the optimization method BFO.
A. Sheta [11] use Particle Swarm Optimization (PSO) algorithm to estimate SRGM parameters. And handling variety of modeling problems such as the exponential model (EXPM), power model (POWM) and Delayed S-Shaped model (DSSM). The objective of this research is to estimate the parameters such that the error difference, between the actual fault and the estimated faults based the parameter estimated using PSO, is minimal. They use Root Mean Square of the Error (RMSE) as evaluation criteria as in equation 14.
2
1
1
ˆ
(
)
N
i i i
RMSE
y
y
N
(14) [11]Where N represents the number of measurements used for estimating the model parameters. PSO use the RMSE criteria as fitness function to improve the parameter estimation. The domain of search for a parameter is [-1000,1000], and the domain of b parameter [-1,1]. They test three different datasets which are Test /Debug Data 1 which contains 870 kilo line of code (KLOC) of FORTRAN, Test Debug Data 2 which contains 200 modules with each having one kilo line of code of FORTRAN, and Test/Debug Data 3 including 46 measurements. The result show that Delayed S-Shaped model (DSSM) outperform over exponential model (EXPM), power model (POWM) in both training and testing data in Test /Debug Data 1, and Test Debug Data 2 by using PSO algorithm with each model. But exponential model (EXPM) outperform over Delayed S-Shaped model (DSSM), and power model (POWM) in Test/Debug Data 3 by using PSO algorithm.
Fig 2. PSO Technique for parameters estimation [2]
A.2 Parameter Estimation Using Ant Colony Algorithm (ACO)
L.Shanmugam, and L. Florence [13] use Estimation method based on Ant Colony Algorithm to estimate SRGMs parameters. Ant colony algorithm is a simulated evolutionary algorithm, which has been applied to many fields. It can be used in many fields, like scheduling, Travelling Sales man’s problem, Telecommunication Networks and Vehicle Routing Problem. The Ant Colony algorithm idea based on while ants are searching for food, they secret pheromone which will be a guide for other ants to follow the route. This pheromone is volatile in nature, so the ants will follow the route as long as signal is strong. The Ant Colony Algorithm method has been applied for the four software Reliability Models (G-O Model, Delay S Shape, Weibull Model, M-O Model) were chosen to calculate estimation accuracy. Out of which four models were compared with PSO algorithm. The Experimental data has been selected from Musa Data set for SYS1, SYS2, and SYS3. Fitness J represents the distance between the predicted failure number and the actual failure number represented in equation 15. The smaller J is, the better the predicted. The result show it is shown clearly that the fitting results by proposed algorithm are more closely to the actual data than PSO algorithm when J (Fitness) are used.
2
2
min(J)
b t
( )
be
k t (15) [13] A.3Parameter Estimation Using Cuckoo Search (CS)AL-Saati, and Abd-AlKareem [3] estimate the SRGMs parameters using Cuckoo Search (CS) which was developed by Yang and Deb in 2009, it gives more robust and precise results than PSO, and ACO (Ant Colony Optimization). This algorithm is described as following strategy:
1-In each time, every cuckoo lays one egg in a randomly chosen nest.
2-Only best nests having high quality eggs (solutions) will continue to the next generations.
3-The available host nests are fixed in number. A host can discover an alien egg with a probability pa ∈ [0, 1]. When discovered, the host bird can either throw the egg away or dump the nest to build a totally new one in another location.
Software Reliability Datasets which compiled to Project 2, Project 3, and project 4. The result show that Ex-ACO outperformed CS, and ACO in Project 2. But CS outperformed Ex-ACO, and ACO in Project 3, and Project 4.
AL-Saat, and Abd-AlKareem Alabajee [14] focuses on a comparison between the performances of two Cuckoo Search (CS) and Firefly Algorithm (FA), in estimating the parameters of Software Reliability Growth Models. Then reinforced their work by using Particle Swarm Optimization (PSO) and Ant Colony Optimization (ACO). They explain how CS algorithm work in [3]. Then they show how FA algorithm work in [14] as following: 1-All fireflies are unisex; therefore, each firefly is attracted to other fireflies irrespective of their sex.
2-Attractiveness and brightness are proportional to each other, so for any two flashing fireflies, the less bright one will move towards the brighter one. Attractiveness and brightness both decrease as their distance increases. If there is no one brighter than other firefly, it will move randomly.
3-The firefly’s brightness is determined by the view of the objective function.
They test the efficiency of CS, FA, and PSO in parameters estimation of SRGMS, by using three models. Goel-Okumoto (G-O), power (POW), Delayed S-Shaped Yamada Model (DSS). On datasets: Data1, Data2, and Data3. Then the results of CS, and FA algorithms are compared with results obtained using ACO on the three previous models with Musa-Okumoto (M-O) model, using the datasets from the Data Analysis Center for Software’s Reliability Dataset for Project2, Project3, and Project4. The Lower and Upper bounds for (a), and (b) parameters [0.00001 – 2000], and [0.00001 – 1] respectively for CS, and FA. They use type of evaluation criteria the first is the Root Mean Square Error (RMSE). The second measure is the Euclidean Distance (ED) as in equation 16.
2 1
(
)
N
i i i
ED
m
M
(16) [14]The result show for Dataset 1 FA was better than PSO and CS only for G-O model, but not for models as CS surpassed other search algorithms. But for Dataset 2 CS outperformed others in G-O and POW models. FA was better only for DSS model this time. In the other hand FA outdid both CS and PSO for POW and DSS models, but not for G-O model. then we compare CS, FA, with ACO the result show that for Project 2, FA outperformed ACO but not CS, except for the M-O model where the performance of ACO was the best. FA was better than ACO for all models for Project 3. But CS was still better than FA in all of the models except for POW. In project 4 the results were very close between CS and FA, but still FA was better than both ACO and CS for G-O, DSS and M-O models. For POW model, CS outperformed all.
A.4 Parameter Estimation Using Genetic Algorithm (GA)
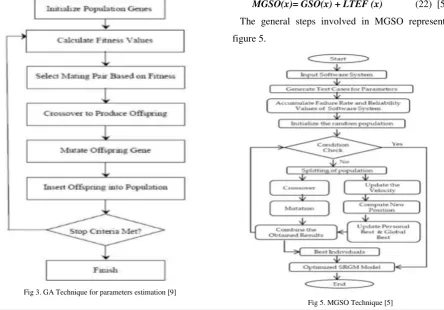
H. Aljahdali, and E. El-Telbany [9] explore Genetic Algorithms (GA) as an alternative approach to derive SRGMs. GA estimating optimal parameters through learning from historical data. Figure3, illustrate GA steps begin with initialize random population Gene, then calculate fitness value, based in these value selecting the mating pair, Reproduction is carried out by a “crossover” operation, similar to what happens in an animal embryo. Two chromosomes exchange portions of their code, a mutation operator will randomly change a bit or bits in some chromosome(s). The operation will still until we get best chromosome.
There are three major trends in software reliability research models: the use of Non Homogeneous Poisson Process (NHPP) models, Bayesian inference, and time series analysis uses an auto-regressive process and an auto-regressive integrated moving average (ARIMA) model. They adopted auto- regression models one of the most used time series models which represented as a set of
discrete values x1, x2, x3, …. etc. The AR model can be
represented in equation 17:
1
1
nj j
j
y
w y
n
(17) [9] Where y j -1 : is the previous observed number of faults w0, and wi are the model parameters.
n: the order of the model.
In the other hand they represent the average predictions of multiple models, and represent the weighted average predictions of multiple models in equation 18, and 19respectively.
1
1
nj j
y
y
n
(18) [9]
1
1
nj j
j
y
w y
n
(19) [9]
2
1 2
2
1
( ( ( ), ( ),....))
1
1 ( )
m
j j j
j
m j j
y v g u g u Q
m y
(20) [9] This function used as a comparison criterion between the three types of SRGMs auto- regression models. They implement their work in datasets form three projects which are Military, Real Time Control and Operating System. The results show that weighted average ensemble model gives better performance over average ensemble model, and single model in all datasets except Real Time Control it give the same value as average ensemble model.
M.Alweshah, W.Ahmad, and Aldabbas [6] Compare
between Auto-Regression and Genetic Programming Models. Proposed GP model is based on a recursive relation derived from the history of measured faults. The software reliability dataset used in this paper was compiled by John Musa of Bell Telephone Laboratories. Which include projects in real-time command and control, real-time commercial, military, operating systems, time sharing systems and word processing. They tuning the GP parameters that include population size, maximum number of generation, crossover and mutation. The variance- accounted- for performance (VAF) are used as a comparison criterion which measure the closeness between two carves or tow arrays as in equation 21. VAF = [ 1 – var (actual – estimated) / var (actual) ] * 100% (21) [6]
The Genetic Programing (GP) model represent little improvement over recursive model. They achieve their goal by implementing new and alternative SRGMs.
Fig 3. GA Technique for parameters estimation [9]
Mallikharjuna Rao, and K. Anuradha [5] implement a Modified Genetic Swarm Optimization algorithm, to optimize these parameters of (SRGM) with testing-effort function (TEF) SRGMTEF. And compared it with other existing models Genetic Algorithm (GA), and Particle Swarm Optimization (PSO). First they implement Genetic Swarm Optimization (GSO). Both PSO and GA show variances in an estimation of performance measures such as consistency and convergence speed. So they combinmng some of the features from both such as selection-crossover-mutation from GA and velocity update from PSO as represented in figure 4.
Then they proposed Modified Genetic Swarm Optimization (MGSO), the idea of this algorithm based on applying another technique on the obtained results from the first technique, means applying PSO results in GA and vis versa. The following equation 22 represents the equation for reliability enhancement Technique that are used:
Fig 4. A hybrid algorithm GA & PSO [5]
MGSO(x)= GSO(x) + LTEF (x) (22) [5] The general steps involved in MGSO represented in figure 5.
They use ten SRGMs in their compression which are Goel-Okumoto Model, Delayed S-shaped Mode, Huang Logistic Model, Yamada Exponential, Inflection S-shaped Model, Yamada Imperfect Debugging Model, Yamada Rayleigh Model, Yamada Imperfect Debugging Model, Two-Dimensional S-shaped Model, and P-N-Z Model. After estimate an optimal parameter for each one from this SRGMs, they use two datasets to do an evaluation experiment, the first is dataset (DS1) used hospital health care system application, the second is dataset (DS2) used in the banking application system. They compare between different states such as Before Optimization, PSO, GA, and MGSO technique using number of failures decreased at different time intervals, Reliability at different time intervals, Mean Value Function m(t), Fitness. The result show that MGSO outperform GA, and PSO. And the obtained values of Huang logistic model with modified genetic swarm optimization technique yields better results than the other software reliability growth models.
Z. Al-Rahamneh, M. Reyalat, A. Sheta, S. Bani-Ahmad, and S. Al-Oqeili [7] propose the Genetic Programming (GP) as an evolutionary computation approach to handle the software reliability modeling problem. Compare or evaluate the proposed model against other common growth models such as Yamada, Poisson, NHPP, and Schneidewind: all. Also study the efficiency of the proposed model in the reliability prediction process. The GP Tuning Parameters which are the set of used functions, determining the population size, determining the maximum number of generations, determining the crossover and mutation rate adapted. They use CASRE (Computer Aided Software Reliability Estimation) software reliability measurement tool, the comparison criteria depend on RMSE, and Normalized RMSE. The proposed model (GP) achieved a good level of estimation for the reliability of the software product.
A.5 Parameter Estimation Using the Grey Wolf Optimization Algorithm (GWO)
F. Sheta and A. Abdel-Raouf [12] explore the advantages of the Grey Wolf Optimization (GWO) algorithm in estimating the SRGM’s parameters with the objective of minimizing the difference between the estimated and the actual number of failures of the software system. The GWO algorithm is based on the wild behavior of the grey wolves during hunting. According to the dominant hierarchy leadership order. This algorithm work as following:
1- The GWO divides the animals’ population into four categories: alpha, beta, delta and omega.
2- The optimization process, the same as the hunting, is guided by the highest rank leaders: alpha, beta, and delta. 3- These three leaders represent the best three solutions in the search space.
4- The omega wolves, the lowest in the hierarchical rank, represent the rest of the solutions that must adjust their positions to follow the other dominant wolves.
They use three type of SRGMs Exponential Model (EXPM), Power Model (POWM), and Delayed S-Shaped
Model (DSSM). Then to compare between these three SRGMs they use four evaluation criteria such as Variance Accounted-For (VAF) equation 22, the Mean Magnitude of Relative Error (MMRE) represented in equation 23, the
correlation coefficient R represented in equation 24, and
the mean square error equation 12.
1
ˆ
| y
|
1
Ni
i i
y
MMRE
N
y
(23) [12]1
2 2
1
1
ˆ ˆ
ˆ
(
)(
)
ˆ
ˆ
(
)
(
)
N
i i
i
N N
i i
i
i
y
y
y
y
R
y
y
y
y
(24) [12]
They test three different datasets which are Test /Debug Data 1 which contains 870 kilo line of code (KLOC) of FORTRAN, the model parameters a and b based on the GWO method, are a [0,500] and b 2[0,1]. Then they use Test Debug Data 2 which contains 200 modules with each having one kilo line of code of FORTRAN, the data consists of 111 measurements, the model parameters are a [0,30] and b [0,2], finally they use Test/Debug Data 3 including 46 measurements with model parameters a [0,1000] and b [0,1]. The results show that Test /Debug Data 1 give the best results in terms of VAF with using DSSM model while the EXPM model’s MMRE was the minimum in comparison to other POWM and DSSM. In Test /Debug Data 2 the results show that the DSSM model provided the best performance using the GWO tuned parameters as it has the minimum MMRE and the maximum VAF compared to other proposed models. In the other hand Test /Debug Data 3 the results show that the DSSM model was able to provide the best results in terms of MMRE while both the EXPM and the POWM models have better VAF values.
A.6 Parameter Estimation Using Simulated Annealing (SA)
C. Diwaker, and P. Tomar [8] optimize the Goel’s - Okomtou models using Simulated Annealing (SA) algorithm which is a heuristic optimization modelling technique applied to solve many difficult problems in the various fields such as scheduling, modelling. Annealing process involves heating and cooling of a material to modify its physical properties due to change in inner structure. In comparison to GA the SA algorithm is less complicated and more effective, the mean features for this algorithm is: The failure rate is reduced. Increase the software reliability and efficiency of the software. And easy to implement than any other optimization technique. After they apply this algorithm the result gives good optimized parameters a, and b. the results show that estimated failure closed to actual failure after 14 weeks. A.7 Parameter Estimation Using Maximum Likelihood Estimation (MLE)
R. Garg, K. Sharma, R. Kumar, and R. K. Garg [15] proposed a matrix method for performance analysis of sixteen different NHPP software reliability models which are Generalized Goel, Goel-Okumoto, Gompert, Inflection S-Shaped, Logistic Growth, Modified Duane, Musa-Okumoto, Yamada imperfect debugging model 1, Yamada Rayleigh, Delayed S-Shaped, Yamada imperfect debugging model 2, Yamada exponential, P-N-Z Model, P-Z Model, Pham Zhang IFD, and Zhang-Teng-Pham, based on a set of seven contributing model selection criteria such as The Noise represented in equation 25, The mean absolute error (MAE) measures the deviation between the predicted values with the actual observations represented in equation 26, R square represented in equation 27, The Theil statistic (TS) is the average deviation percentage over all periods with regard to the actual values represented in equation 28, The predictive-ratio risk (PRR) represented in equation 29, The Root Mean Square Prediction Error (RMSPE) is a measure of the closeness with which the model predicts the observation represented in equation 30.
1
1 1
( )
(
)
|
|
(
)
k
i i
i i
t
t
Noise
t
(25) [15]
1
|
ˆ
( ) |
k
i i
i
m
m t
MAE
k
p
(26) [15]
2
2 1
2
1 1
(
( ))
1
(
)
k
i i i
k k
i j
i j
m
m t
R
m
m n
(27) [15]
2 1
2 1
ˆ
( ( ) )
100%
k
i i i
k i i m t m TS
m
(28) [15]1
ˆ
( )
ˆ
( )
k
i i
i i
m t
m
PRR
m t
(29) [15]
2
2
RMSPE
Variance
Bias
(30) [15]
They use Maximum Likelihood Estimation (MLE) technique to estimate parameters for sixteen NHPP SRGMs then they proposed to apply matrix methodology to analyze the performance and rank the SRGMs based on seven criteria. The result after take Permanent value and the ranking of the alternate SRMs based on the contributing criteria (We will discuss result in ranking section).
A.8 Parameter Estimation Using Machine Learning and Hamman learning
S. Ramasamy, and I. Lakshmanan [10] propose an infinite test effort function in conjunction with a classical Nonhomogeneous Poisson Process (NHPP) model. Using Artificial Neural Network (ANN) for training the proposed model with software failure data. Then they use machine learning approach to select the appropriate set of weights for the model which will describe both the past and the future data well. These new model called Proposed Software Reliability Growth Model with Log-Power Testing Effort Function. The proposed model building on the past good work done time transform the G-O model using log-power testing effort function. Equation 31 represent the log-power testing effort. And equation 32 represent the new SRGMs mean value function.
( )
*ln (1
c)
w t
n
t
(31) [10]( ( *ln (1 )))
( ) a(1 e
t
b n c t)
(32) [10] They evaluate the performance of the proposed model by using four practical software failure datasets:
DS-1: Release-1 from Tandem Computer Company. DS-2: Release-2 from Tandem Computers Company. DS-3: Release-3 from Tandem Computers Company. DS-4: Cited from Brooks and Motley.
To estimate parameters of the proposed model. they use feed-forward ANN with back-propagation algorithm, So the mean value function of the proposed SRGM with log-power TEF become as in equation 33:
1 3 2
( ( *ln (1 ))) 4
Y( )
t
(1 e
t)
(33) [10]Where 𝑤1,𝑤2,𝑤3, and𝑤4 are the weights of software reliability model and their values are determined using ANN. Then they use Machine Learning technique to select appropriate weights of the proposed model, the performance of the proposed model measured by using Mean Square Error (MSE) criteria. The results show that Proposed G-O SRGM with log-power TEF give less MSE value than G-O SRGM with Weibull TEF when it calculated for DS-1, DS-2, DS-3, AND DS-4.
Tao Li, and Kaigui Wu [16] say that demonstration of the G-O model considering both the fault introduction and the fault removal efficiency in the model based on imperfect debugging. They introduced classic G-O model and prove that the proposed model needn’t consider two aspects of imperfect debugging during the fault removal process on the basis of G-O model. Then they Proposed Software Reliability Model Considering Fault Detection Rate. During the process of software system testing phase testers will be gradually familiar with the software system with the time, which has a positive effect on the value of fault detection rate. This will generate b1 (t) is the fault detection rate incorporating the rise of human learning ability, and b2 (t) is the fault detection rate considering that it is more and more difficult to find the remaining faults with time in software system. Presented in equation 34, and 35 respectively.
2
1
( )
1 (1
)
k t
b t
b e
(34) [16]2
2
( )
k t
b
t
be
(35) [16]This led to get new proposed model represented in equation 36:
( ) ( )( | t) P
(t
)
(t) 0
m t m tR
N
N
e
(36) [16]The performance evaluation of software reliability growth model is generally measured with sum of square errors (SSE) represented in equation 37 and correlation index of regression curve equation (R-square) equation 27.
SSE= 2
1
(
(
))
n
i i
i
y
m t
(37) [16]They use Data set from literature. Then compare some classic models and new models such as G-O model, delayed S-shaped model, inflection S-shaped model and Bell-SRGM. The results show that the value of SSE is smaller and the value of R-square is more close to 1 in the experiment of the proposed new model compared with other models.
Javaid Iqbal [17] detailed analysis of some select SRGMs with learning effects. A unified framework for use of SRGMs with learning process and error generation in imperfect debugging environments presented, Chiu and Huang in proposed a learning-effect-based NHPP model that captures the learning effect gained by testing/ debugging staff from inspection and debugging of code presented in equation 38. Chiu proposes an improvement model under time-dependent learning effect. Iqbal, Ahmad and Quadri propose an SRGM that incorporates two types of learning effects autonomous learning and acquired learning, and then incorporate a negligence factor also into the SRGM with two types of learning effect represented in equations 39, and 40 respectively.
( )
1
( ) 1
( ) t
m t a
e
(38) [17]
Where autonomous error factor α > 0, and learning factor
η > 0.
1 2
2 1 ( ) 2 1
1
(
)
( )
1
(
)
tm t
a
e
(39) [17]Where autonomous learning η1 and acquired learning η2.
1 2
2 1
( )
2 1
1 ( )
( ) 1
( ) t
m t a
e
(40) [17]
Where
negligence factor.They use seven datasets to estimate the parameters. Failure Data of Misra System form Zhang and Pham, Failure Data of Misra System form Shuyr, Failure Data of NTDS System form Hossain and Dahiya, Failure data of Tandem Software form Pham and Zhang, Failure Data of Space program form Bai, Hu, Xie and Ng. Failure data of
real time control system form Pham. Failure Data of wireless data service system from Jeske and Zhang. The comparison criteria R2 used as coefficient of multiple determinations to measure the performance of G-O model, Chiu, (2TL1) Two-Type, and Two-Type with negligence factor (2TL2) learning model. The result shows converge in R2 over models.
A.9 Parameter Estimation Using Weibull Fault Detection Rate Function Subject to Operating Environments:
K. Yoon Song, I. Hong Chang, and H. Pham [21] propose a new software reliability model using Weibull function in the software development process and relate it to the error detection rate function with consideration the uncertainty of operating environments. This model takes in account that after software released to customer it can be used in different operating system environment so this model takes operating system averment as factor. The mean value function m(t), which is the expected number of faults detected at time t, with adding uncertainty of the environments, produce new NHPP software reliability model subject that can be used to determine the expected number of software failures detected by time t represented in equation 41.
(t)
(1
)
(at)
bm
N
(41) [21]They use program based on the least-squares estimate (LSE) method to estimate the parameters for eleven SRGMs, G-O Model, Delayed S-shaped, Inflection S -shaped, Yamada Imperfect Debugging Model, PNZ Model, Pham-Zhang Model, Dependent-Parameter Model1, Dependent-Parameter Model2, Testing Coverage Model, Three-parameter Model, and Proposed New Model, then they use five common criteria: namely the mean squared error (MSE) equation 12, the sum absolute error (SAE) equation 42, the predictive ratio risk (PRR) equation 29, the predictive power (PP) equation 43, and Akaike’s information criterion (AIC) equation 44.
0
|
( )
|
n
i i
i
SA E
m t
y
(42) [21]2
0
ˆ
(
(
)
n
i i
i i
m t
y
PP
y
(43) [21]AIC= - 2 log |MLF| + 2m
(44) [21]The software in the numerical example that are used runs on an element within a wireless network switching
center. Using Dataset #1, field failure data for Release 1,
and Data set #2, test data for Release 2. The results show that MSE, SAE, PRR, PP and AIC values for the proposed new model are the lowest values compared to all models.
Some of SRGMs are used to handle failures in software and give optimal measure for this software depending in SRGM parameter estimation technique, but it can't do the same with other software's. Still there does not exist any model that can be applied in all cases. Models that are good in general are not always the best choice for a particular dataset, and it is not possible to know in advance what model should be used in any particular case. Selection of optimal SRGMs for use in a particular case has been an area of interest for researchers in the field of software reliability because its often difficult to know which models are better to apply in a given context [4][15] [23][26]. Then after we discuss some of ranking techniques and methodologies we illustrate it in Table 2. B.1 Software Reliability Growth Models Ranking Using Distance Based Approach
Linag, Mohd, Dayang, and Shahliza [2] using Distance Based Approach (DBA) for model selection and ranking of NHPP SRGMs as in figure 6.
Figure 6: Process of DBA [2]
They test this approach after using PSO, LSE, and BFO to estimate an optimal parameter with applying Euclidean Composite Distance (CD) equation 45, to Compare between six SRGMs and rank it in an order manner. They apply this Ranking process using Tandam Computer Software Failure Dataset.
1 2 2
1
(Zopt
)
m
i i i ii
CD
z
(45) [2] The SRGM ranking that produced by using the parameter values of PSO, LSE and BFO parameter
estimation methods. The ranking of the model will be ranks higher with the lower CD value. The results show that Logistic Growth model get the best ranking, and Gompert model take almost the lowest ranking.
B.2 Software Reliability Growth Model Ranking Using proposed method (GOF)
N. Ullah, M. Morisio, and A. Vetrò [4] present an empirical method that applies various SRGMs iteratively on Open Source Software (OSS) defect data, and selects the model which best predicts the residual defects of the OSS. The goal of this study is, to support practitioners in characterizing the reliability (in terms of residual defects) of an OSS component or product based on goodness of fit (GOF). The characterized reliability of the OSS component/product is one of the factors for the decision of a project manager about using the component or not. The idea of the proposed method works as following steps: 1- The first step is to select the release of the OSS project of interest and collect the issues from the online repositories.
2- The second step is to extract defects from the issues collected in step 1. Depending on time interval.
3- he third step is to apply the SRGMs such as (Musa, Inflection, Goel, Delayed, Logistic, Yamada, Gompertz, and Generalized) to the defects data obtained from step 2, then choose model which give (GOF) for data after computing R2.
4- In this step models are passed through model rejection criteria.
5- In this step models are evaluated in term of prediction stability.
6- The sixth step is to select the best SRGM model. The model which gives the highest number of predicted defects among all stable models is selected.
7- In this step, using the selected SRGM, the residual defects of the OSS are computed.
They apply their method in seven OSS projects to show how this method work, this projects such as Apache, GNOME, C++ Standard Library, JUDDI, HTTP Server, XML Beans, and Enterprise Social Messaging Environment (ESME). They use PRE (Prediction Relative Error) equation 46, to measure and validate the prediction capability of models that they use and compare the result that they get from PRE with result that they get from their proposed method. The result show that there is big agreement between PRE and proposed method.
Predicted - Actual
PRE =
Predicted
(46)[4]B.3 Software Reliability Growth Model Ranking Using Matrix Method
matrix method for performance analysis of sixteen different NHPP software reliability models based on a set of seven contributing model selection criteria (mentioned before). They use Maximum Likelihood Estimation technique to estimate the parameter, then they use Criteria Rating Matrix: This is a diagonal matrix whose elements (aii’s or ai’s) represent the ratings of different comparison
criteria for a software reliability model. A real data set of middle size software project from published papers has been used for demonstration of matrix method. From this criterion they use Permanent Function Representation to find the permanent for each SRGM. The results show that P-Z Model get the highest ranking and Goel-Okumoto model get the lowest ranking.
B.4 Software Reliability Growth Model Ranking Depending on Real Dataset
N. Hung-Cuong, Huynh Quyet-Thang, Le Hai-Trieu
[20] apply a mathematics technique to calculate ranking measure based on real data sets. So SRGMs will be ranked
with two characteristics: the fit of calculated occurrence failure times with real occurrence failure times, and the fit
of the predicted time of next failure with the real one.
several approaches or criteria used to evaluate the fitting
between calculated values of SRGMs and a real data set such as, The mean square error (MSE) equation 12, The mean absolute error (MAE) equation 26, The mean difference error(MDE) equation 47, The accuracy of
estimation (AE) equation 11, The noise reflects the change
of failure intensity equation 25, The predictive-ratio risk (PRR) equation 29, The sum of squared errors (SSE) equation 37, and The sum of difference (SD) equation 48.
1
|
(
) |
k
i i
i
m t
m
MDE
k
(47) [20]
0
| ( )
|
k
i i
i
SD
s t
s
(48) [20] Then they make Ranking procedure with four-step scenario. First step Calculate measurements of every criterion of each SRGM and arrange it in matrix, in second step Calculate the weight of each measurement by calculate The smaller value of the criterion, the better quality of the SRGM in equation 49, and calculate The bigger value of the criterion, the better quality of the SRGM equation 50. The matrix elements are:
(Amax)j = maximum value of jth criterion. (Amin)j = minimum value of jth criterion. aij = value of jth criteria of ith model.
MaC V C CritertionRating
Mac Mic
(49) [20]
VC
Mic
CriationRating
Mac Mic
(50) [20] Where:MaC = the Maximum value of this Criterion.
MiC = the Minimum value of this Criterion VC = the Value of the Criterion
With considering Xij represents the rating of jth criterion of ith SRGM where Xij in equation 51.
max
max min
(
)
(
)
(
)
j ij ij
j j
A
a
X
A
A
(51) [20] In the third step Calculate weighted value of each measurement. Weighted criteria value is calculated by multiplying the weight of each criterion with the criteria value equation 52, in the fourth step Calculate generalized measure of each SRGM equation 54.
1
ij ij
W
X
(52) [20]
1
m
ij i
j
ij
A
Z
W
(53) [20] They use NTDS data set extracted from information about failures in the development of software for the real-time multi-computer complex of the US Naval Fleet Computer Programming Center of the US Naval Tactical Data Systems (NTDS). After they calculate Weight value of criteria of this Dataset, then calculate Model permanent value and ranking models, the result show that Delayed S-shaped model get the highest ranking, where is Musa- Okumoto get the lowest.
IV. CONCLUTION
Software reliability is an important issue we must take in consider before releasing a software to the market, from about 40 years there are many SRGMs that are used to improve the estimation of software reliability measures such as the number of residual faults, software failure rate, and software reliability. By optimize parameter estimation for this models using new methodology such as estimate parameters by PSO, GA, or other optimization technique. Other people goes to implement a new SRGMs to enhance parameter estimation approach. In the other hand some people work in ranking this models after parameter estimation to test the software using an appropriate SRGMs. In this paper we study some of this methodologies to see the characteristic for each one of these models under different techniques and to give an overview to people who interested in this field.
REFERENCES
[1] Syed Wajahat Abbas Rizvia,, Vivek Kumar Singh, and Raees Ahmad Khan, " Fuzzy Logic based Software Reliability
Quantification Framework: Early Stage Perspective (FLSRQF)",
ELSEVIER, Twelfth International Multi-Conference on Information Processing-2016 (IMCIP-2016).
[3] Najla Akram AL-Saati, Marwa Abd-AlKareem, " The Use of Cuckoo Search in Estimating the Parameters of Software Reliability Growth Models", (IJCSIS) International Journal of Computer Science and Information Security, Vol. 11, No. 6, June 2013. [4] Najeeb Ullah, Maurizio Morisio, Antonio Vetrò, " A METHOD
FOR SELECTING SOFTWARE RELIABILITY GROWTH
MODEL TO PREDICT OPEN SOURCE SOFTWARE
RESIDUAL DEFECTS",2014.
[5] Mallikharjuna Rao K, K. Anuradha, " A New Method to Optimize the Reliability of Software Reliability Growth Models using Modified Genetic Swarm Optimization", International Journal of Computer Applications (0975 – 8887) Volume 145 – No.5, July 2016.
[6] Mohammed Alweshah, Waild Ahmad, Hamza Aldabbs, " Evolution of Software Reliability Growth Models: A Comparison of Auto-Regression and Genetic Programming Models", International Journal of Computer Applications (0975 – 8887) Volume 125 – No.3, September 2015.
[7] Zainab Al-Rahamneh, Mohammad Reyalat, Alaa F. Sheta, Sulieman Bani-Ahmad, Saleh Al-Oqeilil," A New Software Reliability Growth Model: Genetic-Programming-Based Approach", Journal of Software Engineering and Applications, 2011, 4, 476-481 doi:10.4236/jsea.2011.48054 Published Online August 2011.
[8] Chander Diwaker, Pradeep Tomar, " Parameters Estimation of Goel’s Okumotu Model using Simulated Annealing", International Journal of Emerging Technologies in Computational and Applied Sciences (IJETCAS), 2014.
[9] Sultan H. Aljahdali, and Mohammed E. El-Telbany, " Genetic Algorithms for Optimizing Ensemble of Models in Software Reliability Prediction", ICGST-AIML Journal, Volume 8, Issue I, June 2008.
[10] Subburaj Ramasamy, and Indhurani Lakshmanan, " Machine Learning Approach for Software Reliability Growth Modeling with Infinite Testing Effort Function", Hindawi Mathematical Problems in Engineering Volume 2017.
[11] Alaa Sheta, " Parameter Estimation of Software Reliability Growth Models by Particle Swarm Optimization", AIML Journal, Volume (7), Issue (1), June, 2007.
[12] Alaa F. Sheta, and Amal Abdel-Raouf, " Estimating the Parameters of Software Reliability Growth Models Using the Grey Wolf Optimization Algorithm", (IJACSA) International Journal of Advanced Computer Science and Applications, Vol. 7, No. 4, 2016. [13] Latha Shanmugam, and Dr. Lilly Florence, " ACOMPARISON OF
PARAMETER BEST ESTIMATION METHOD FOR
SOFTWARE RELIABILITY MODELS", International Journal of Software Engineering & Applications (IJSEA), Vol.3, No.5, September 2012.
[14] Najla Akram AL-Saati, Marrwa Abd-AlKareem Alabajee, " A Comparative Study on Parameter Estimation in Software Reliability Modelling using Swarm Intelligence", International Journal of Recent Research and Review, Vol. IX, Issue 4, December 2016. [15] RajPal Garg, Kapil Sharma, Rajive Kumar, R. K. Garg, "
Performance Analysis of Software Reliability Models using Matrix Method", World Academy of Science, Engineering and Technology International Journal of Computer and Information Engineering Vol:4, No:11, 2010.
[16] Tao Li, Kaigui Wu, " A NHPP Software Reliability Growth Model Considering Learning Process and Number of Residual Faults", Journal of Convergence Information Technology(JCIT) Volume 7, Number 13, July 2012.
[17] Javaid Iqbal, " Analysis of Some Software Reliability Growth Models with Learning Effects", I.J. Mathematical Sciences and Computing, 2016, 3, 58-70 Published Online July 2016 in MEC. [18] Karambir Bidhan, Adima Awasthi, " A Review on Parameter
Estimation Techniques of Software Reliability Growth Models", International Journal of Computer Applications Technology and Research Volume 3– Issue 4, 267 - 272, 2014, ISSN: 2319–8656. [19] Zunana KRAJCUSKOVA, " A BRIEF SURVEY OF
RELIABILITY GROWTH MODELS ".
[20] Nguyen Hung-Cuong, Huynh Quyet-Thang, Le Hai- Trieu, " Different Ranking of NHPP Software Reliability Growth Models with Generalised Measure and Predictability", International Journal
[21] of Applied Information Systems (IJAIS) ISSN : 2249-0868 Foundation of Computer Science FCS, New York, USA Volume 7 - No. 11, November 2014.
[22] Kwang Yoon Song , In Hong Chang , and Hoang Pham, " A Software Reliability Model with a Weibull Fault Detection Rate Function Subject to Operating Environments", applied science MDPI Journal, 2017, 7, 983.
[23] Archana Kumar, Abhinav Juneja,Sapna Bajaj," HASSE DIAGRAM TECHNIQUE BASED RANKING OF SOFTWARE RELIABILITY GROWTH MODELS", JETIR (ISSN-2349-5162), November 2017, Volume 4, Issue 11.
[24] Mohd. Anjum, Md. Asraful Haque, Nesar Ahmad, " Analysis and Ranking of Software Reliability Models Based on Weighted Criteria Value", I.J. Information Technology and Computer Science, 2013, 02, 1-14 Published Online January 2013 in MECS. [25] Dalbir Kaur, Monika Sharma, " Software Reliability Models: Time
between failures and Accuracy estimation", (IJCSIT) International Journal of Computer Science and Information Technologies, Vol. 6 (4) , 2015, 3370-3373.
[26] Alan Wood, " Software Reliability Growth Model", Tandem Technical Report 96.1 Part Number 130056 © Tandem Computers, 1996.
[27] Neha Miglani, and Poonam Rana, " Ranking of Software Reliability Growth Models using Greedy Approach", Global Journal of Business Management.
Prof. Amjad Ahmad Hudaib: Amjad obtained his Bc in computer Science from Mutah University in 1991, then he completed his study in a master of computer science from The University of Jordan in 2000, and Ph.D. In Computer Science/ Software Engineering from University of Pisa, Pisa, Italy, he works as Professor in The University of Jordan, form 2016 until now. He interests in Software Engineering, Pattern Matching, Software Architectural Design, Systems Engineering and Tools, Requirements Engineering, Software Testing and Evaluation, Image Processing, Data Mining, Quality Assurance.
Mahmoud Moshref: Mahmoud obtained his Bc in
23 | International Journal of Computer Systems, ISSN-(2394-1065), Vol. 03, Issue 06, May, 2018
Table 1: Parameter Estimation Methodologies
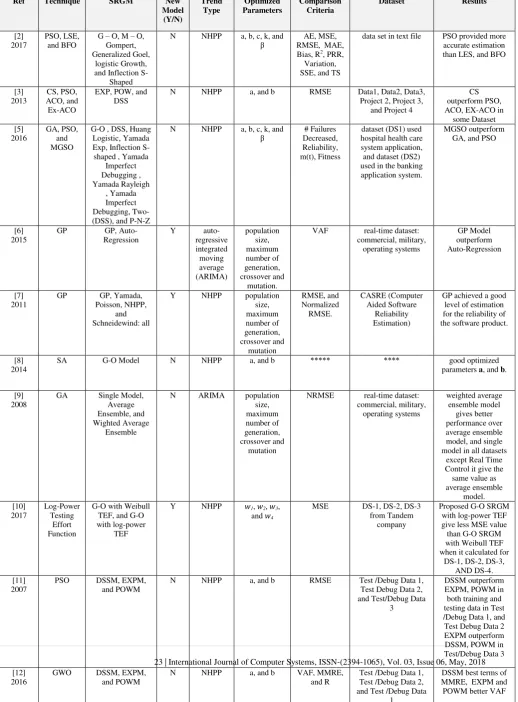
Results Dataset Comparison Criteria Optimized Parameters Trend Type New Model (Y/N) SRGM Technique Ref
PSO provided more accurate estimation than LES, and BFO data set in text file
AE, MSE, RMSE, MAE, Bias, R2, PRR, Variation, SSE, and TS a, b, c, k, and
β
NHPP N
G – O, M – O, Gompert, Generalized Goel,
logistic Growth, and Inflection
S-Shaped PSO, LSE, and BFO [2] 2017 CS outperform PSO, ACO, EX-ACO in
some Dataset Data1, Data2, Data3,
Project 2, Project 3, and Project 4 RMSE
a, and b NHPP
N EXP, POW, and
DSS CS, PSO, ACO, and Ex-ACO [3] 2013 MGSO outperform GA, and PSO dataset (DS1) used
hospital health care system application, and dataset (DS2) used in the banking application system. # Failures
Decreased, Reliability, m(t), Fitness a, b, c, k, and
β
NHPP N
G-O , DSS, Huang Logistic, Yamada Exp, Inflection S-shaped , Yamada
Imperfect Debugging , Yamada Rayleigh , Yamada Imperfect Debugging, Two-(DSS), and P-N-Z GA, PSO, and MGSO [5] 2016 GP Model outperform Auto-Regression real-time dataset: commercial, military, operating systems VAF population size, maximum number of generation, crossover and mutation. auto-regressive integrated moving average (ARIMA) Y GP, Auto-Regression GP [6] 2015
GP achieved a good level of estimation for the reliability of the software product. CASRE (Computer Aided Software Reliability Estimation) RMSE, and Normalized RMSE. population size, maximum number of generation, crossover and mutation NHPP Y GP, Yamada, Poisson, NHPP, and Schneidewind: all GP [7] 2011 good optimized parameters a, and b.
**** *****
a, and b NHPP N G-O Model SA [8] 2014 weighted average ensemble model gives better performance over average ensemble model, and single model in all datasets
except Real Time Control it give the same value as average ensemble model. real-time dataset: commercial, military, operating systems NRMSE population size, maximum number of generation, crossover and mutation ARIMA N Single Model, Average Ensemble, and Wighted Average Ensemble GA [9] 2008
Proposed G-O SRGM with log-power TEF give less MSE value than G-O SRGM with Weibull TEF when it calculated for
DS-1, DS-2, DS-3, AND DS-4. DS-1, DS-2, DS-3
from Tandem company MSE
𝑤1, 𝑤2, 𝑤3,
and 𝑤4
NHPP Y
G-O with Weibull TEF, and G-O with log-power TEF Log-Power Testing Effort Function [10] 2017 DSSM outperform EXPM, POWM in both training and testing data in Test /Debug Data 1, and Test Debug Data 2 EXPM outperform DSSM, POWM in Test/Debug Data 3 Test /Debug Data 1,
Test Debug Data 2, and Test/Debug Data
3 RMSE
a, and b NHPP N DSSM, EXPM, and POWM PSO [11] 2007
DSSM best terms of MMRE, EXPM and Test /Debug Data 1,
Test /Debug Data 2, VAF, MMRE,
and R a, and b
ACO more closely to the actual data than PSO Musa Data set SYS1,
SYS2, and SYS3
J (Fitness)
a, b, and α
NHPP N
G-O, DSS, Weibull , and
M-O ACO, PSO
[13] 2012
CS outperform PSO, ACO, EX-ACO in some
Dataset Data1, Data2, Data3,
Project 2, Project 3, and Project 4 RMSE, and
ED a, and b
NHPP N
G-O, POW, DSS CS, FA,
PSO, and ACO [14]
2016
In ranking Table *****
Noise, MAE, TS, R2 and
RMSPE a, b, c, d, k
NHPP N
G-G, G-O, Gompert, ISS, L
G, M D, M-O, Yamada model 1, Yamada Rayleigh, DSS, Yamada model 2, Yamada exp, P-N-Z , P-Z , IFD, and Z-T-P, MLE
[15] 2010
SSE is smaller and the value of R2 is more close
to 1 Dataset from Tandem
company SSE, and R2
a, b, c, and k NHPP
Y G-O, delayed SS, inflection SS and Bell-SRGM. SRGM
Learning Process [16]
2012
converges in R2 over models Zhang and Pham,
Misra, NTDS, Tandem, Failure form
Bai, Hu, Xie and Ng. Failure form Pham, Failure from Jeske and
Zhang R2
a, b, α, η2, ς NHPP
Y G-O, Chiu
2TL1, and 2TL2 [17]
that MSE, SAE, PRR, PP and AIC values for the proposed new model
are the lowest values compared to all models Dataset #1, Dataset #2
MSE, SAE, PRR, PP and
AIC
a, b, α, and β
NHPP Y
G-O, DSS, ISS, Yamada Imperfect
Debug, PNZ l, P-Z, D-P, DP Model
1,2, Testing Coverage Model,
Three-parameter Model, and Proposed New LSE
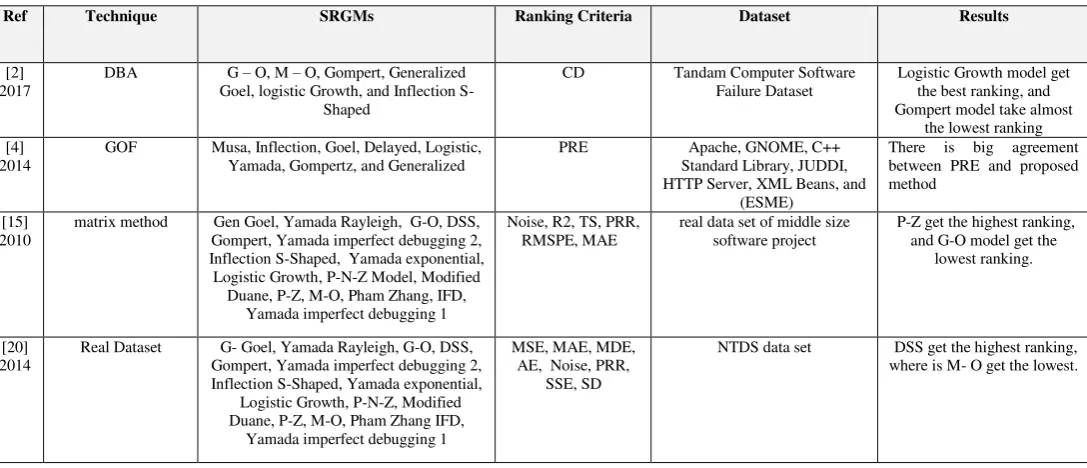
Table 2: Models Ranking Methodologies
Results Dataset
Ranking Criteria SRGMs
Technique Ref
Logistic Growth model get the best ranking, and Gompert model take almost
the lowest ranking Tandam Computer Software
Failure Dataset CD
G – O, M – O, Gompert, Generalized Goel, logistic Growth, and Inflection
S-Shaped DBA
[2] 2017
There is big agreement between PRE and proposed method
Apache, GNOME, C++ Standard Library, JUDDI, HTTP Server, XML Beans, and
(ESME) PRE
Musa, Inflection, Goel, Delayed, Logistic, Yamada, Gompertz, and Generalized GOF
[4] 2014
P-Z get the highest ranking, and G-O model get the
lowest ranking. real data set of middle size
software project Noise, R2, TS, PRR,
RMSPE, MAE Gen Goel, Yamada Rayleigh, G-O, DSS,
Gompert, Yamada imperfect debugging 2, Inflection S-Shaped, Yamada exponential, Logistic Growth, P-N-Z Model, Modified
Duane, P-Z, M-O, Pham Zhang, IFD, Yamada imperfect debugging 1 matrix method
[15] 2010
DSS get the highest ranking, where is M- O get the lowest. NTDS data set
MSE, MAE, MDE, AE, Noise, PRR,
SSE, SD G- Goel, Yamada Rayleigh, G-O, DSS,
Gompert, Yamada imperfect debugging 2, Inflection S-Shaped, Yamada exponential,
Logistic Growth, P-N-Z, Modified Duane, P-Z, M-O, Pham Zhang IFD,
Yamada imperfect debugging 1 Real Dataset
![Fig 1. Concave and S-shaped models [18]](https://thumb-us.123doks.com/thumbv2/123dok_us/1333331.1641740/2.595.305.521.82.202/fig-concave-and-s-shaped-models.webp)
![Fig 2. PSO Technique for parameters estimation [2]](https://thumb-us.123doks.com/thumbv2/123dok_us/1333331.1641740/4.595.57.269.512.735/fig-pso-technique-for-parameters-estimation.webp)
![Figure 6: Process of DBA [2]](https://thumb-us.123doks.com/thumbv2/123dok_us/1333331.1641740/10.595.60.266.323.615/figure-process-of-dba.webp)