Submittedin:June2013
Acceptedin:October2013 Publishedin:January2014
Recommended citation
López, F.A. & Silva, M.M. (2014). M-learningpatternsinthevirtualclassroom. MobileLearning Applica -tionsin HigherEducation [SpecialSection]. Revista de Universidad y Sociedad del Conocimiento (RUSC).
Vol. 11, No 1. pp. 208-221. doihttp://dx.doi.org/10.7238/rusc.v11i1.1902
Abstract
Keywords
m-learning, mobiledevices, webusagemining, Moodle, learningmanagementsystems
Patrones de
m-learning
en el aula virtual
Resumen
Los dispositivos móviles se han vuelto omnipresentes en los campus universitarios, lo que ha cambiado la naturaleza de la educación superior y ha proporcionado una nueva forma de aprendizaje electrónico
móvil (m-learning). El objetivo de este trabajo es evaluar la penetración que tienen los dispositivos móviles
para el aprendizaje en la educación superior e identificar los principales patrones de uso. El estudio utiliza de forma complementaria dos metodologías. En primer lugar se realiza un ejercicio de minería web en la plataforma virtual de la universidad, a través del cual se exploran las tendencias del uso de esta nueva tecnología en los últimos cuatro cursos académicos y se identifican los principales patrones de compor-tamiento. En segundo lugar se lleva a cabo una encuesta a 460 estudiantes universitarios para conocer el
nivel de penetración del m-learning declarado por los estudiantes. Los resultados son concluyentes, el 25%
de las entradas al sistema LMS (Learning Maganament Systems) se realizan con dispositivo móvil y el 75% de los estudiantes utilizan estos dispositivos con fines de aprendizaje. Las implicaciones de este estudio son importantes tanto para investigadores y profesores como para las instituciones que pretendan implantar esta metodología de estudio.
Palabras clave
m-learning, dispositivos móviles, minería web, Moodle, Learning Maganament Systems
1. Introduction
Mobiledevicesare everywheretobefoundonuniversitycampuses owingtotheirlowcostand improvedtechnicalcapabilities, andtofallingInternetservicecharges. Thishaschangedtheway inwhichstudentsbehave, interactwiththeirenvironmentandapproachtheirlearningtasks. This reality, whichlecturersperceiveonadailybasisonuniversitycampuses, hashadamajorimpacton highereducation, givingrisetoanemergentteaching/learning conceptbasedonuser mobility,
which is increasingly widespread in society: mobile e-learning or m-learning. A wide range of m-learningdefinitionscanbefoundintheliterature(Park, Nam, & Cha, 2012; Hwang & Tsai, 2011), yet theyallhavethesameideaincommon:mobiledevicesplayanimportantroleinlearningactivities,
irrespectiveofwheresuchactivitiesarecarriedout.
Furthermore, it is now very usual to find courses that blend the traditional face-to-face methodologywithanonlineplatform, mainlybasedontheuseofalearningmanagementsystem (LMS). LMSshavemodularfeaturesthatenablelecturerstodelivercontentandpracticalactivitiesto students, aswellasmultipleconfigurationoptionsforonlinecoursemanagement.
ThethreemostcommonlyusedLMSsbySpanishuniversitiesare1Sakai, BlackboardandMoodle.
Thedevelopersofthethreesystemsareawareoftheimpactthatm-learninghasonstudents, and
havethereforeevolvedtheirsystemsbyincorporatingnewtechnicalfeaturestoenableadaptation
tomobile technology. Thus, Sakai, which comesunderProject Keitai, has beendeveloping new
functionstoenableadaptationtomobiletechnologiessince2011(SakaiMobile). Blackboardhas
developedtheBlackboardMobileapplication(app), aninterfacethatprovidesstudentsandlecturers
withthecontentoftheircoursesinawaythatiscompatiblewithawidevarietyofdevices, including
iOS, Android, BlackBerry and SmartphoneWeb OS. Moodle (Modular Object-Oriented Dynamic
Learning Environment), themost commonly usedLMS bySpanishuniversities, hasalsoadapted
tothis technology. InthelatestversionsofthisopensourceLMS, amobiledevice apphasbeen
incorporated toadapt the user interfaceto desktop and laptop computers, tablets and mobile
phonesinordertodisplayinformationinauser-friendlyway(Arjona & Sánchez, 2013).
AlthoughalloftheseLMSsusuallyprovidestatisticalreportssuchaslogsofcourseactivity, the
datathatthesereportsprovidedonothelptodrawusefulconclusionsaboutstudentbehaviouror
studyhabits(Zorrilla, Menasalvas, Marín, Mora, & Segovia, 2005), orevenaboutthetypeofdevice
thatstudentsusetoviewinformation. Thislimitationcanbeovercomebyincorporatingwebusage
miningtechniques. Thesetechniqueshavebeenusedmassivelyine-commerceandare nowan
emergent methodologyin education(Castro, Vellido, Nebot, & Mugica, 2007;Romero & Ventura,
2007). However, whilethemainobjectiveofwebusagemining(anddataminingingeneral)isto
increaseane-commerce firm’ssalesandprofits, theobjectiveinthe fieldofe-learningistoimprove
teachingandlearning. Someexamplesoftheuseofthisresearchmethodologyineducationarethe
studiesbyPahl(2004)and, inSpain, byCasanyetal. (2012).
Inordertoidentifypatternsofstudentbehaviour, survey-basedstudiesarebyfarthemostusual
because theyenablea direct evaluationof aconsiderable number ofimportant aspectsof this
technology.
Inthisstudy, bothmethodologieswereusedcomplementarilywiththeaimof findingoutabout
thepenetrationofmobiledevicesinhighereducationandofidentifyingpatternsofbehaviourwhen
thistechnology isused. Onthis point, itisimportanttohighlightthat, whilethestudents’useof
mobiledevicesisgenerallyassociatedwiththeterm ‘m-learning’, studentsdonotalwaysusethem
inauniversityenvironmentforlearningpurposes. Rather, theyalmostcertainlyusethemmoreoften
simplytoviewitemsliketheirnotes, forexample.
Withthisaim, webusageminingwasperformed firstofalltoexaminethemonitoringlogsofbasic
activitiesundertakenbythestudentsontheLMS, withafocusonidentifyingpatternsofbehaviour
regardingaccessesmadefrommobiledevicesandcomparingthemwithaccessesmadefromclassic
devices. Thenasurveywasconducted, inwhichtheuniversitystudentswereaskeddirectlyaboutthe
adoptionofthistechnologyasalearningmethod.
1.1. Increased research into m-learning
M-learningisahottopicintheeducationaltechnology-relatedliterature. Astheimplementationof
thesetechniquesisrelativelynew, mostcontributionsareveryrecent. Nevertheless, ahighnumberof
articlesonthistopiccanbefound. Onaninternationalscale, threeveryrecentlypublishedliterature
coupleofeditorialsinoneofthehighestimpactjournalsinthe fieldofeducation(Rushby, 2012;Pachler,
Ranieri, Manca, & Cook, 2012)havehighlightedthescientificcommunity’sgrowinginterestinthistopic.
InSpain, thelevelofresearchintothepenetrationofthesedevicesinSpanishuniversitiesisvery
limitedwhencomparedtothatofothercountries, despitehavingsimilarlevelsofstudentdemands
andhigh, sustainedgrowthintermsofboththepercentageofclassroomswithWi-Ficonnections
(morethan85%)andthenumberofmobileInternetconnections.
Nevertheless, itispossibleto findsomeinitiativeswherecertainuniversitieswithanonface-to
-faceorientationstandout, suchastheOpenUniversityofCatalonia(UOC), Spain, andtheNational
UniversityofDistanceEducation(UNED), Spain, whicharepavingthewayfortheincorporationof
m-learningintohighereducationandconsideritasoneofthenewhorizons(Martín, Díaz, Plaza, Ruiz,
Castro, & Peire, 2011). TheSCOPEO(2011)reportalsopresentedacompleteviewofthem-learning
situationinSpain, asdidtherecent HESTELO(2013)reportthatfocusesonanalysingtheresultsofa
surveyof111studentsfromtheUniversityofValladolid(UVa), Spain. Inaddition, severalexperiences
orcasestudiesofvariousSpanishuniversitieshavebeenpublished.
2. Method
2.1. Population
Inorderto findoutaboutthepenetrationofmobile devicesinhighereducationandtoidentify
usagepatternsforthistechnology, thisstudyfocusedonstudentsenrolledatthe TechnicalUniversity
ofCartagena(UPCT), Spain. Foundedin2001, theUPCT isthemostmodernofSpain’sfourtechnical
universities. Besides15ofitsownbachelor’sdegreeormaster’sdegreecourses, 22Engineeringand
1Business AdministrationandManagementbachelor’sdegreecoursesaretaughtattheUPCT. Itis
asmalluniversitywithahighlytechnologicalprofile. Inthe2012/2013academicyear, ithad7,310
students, mostofwhomwereenrolledontechnicaldegreecourses(Engineering), althoughquitea
highpercentagewasenrolledonthebachelor’sdegreeinBusiness AdministrationandManagement
courseandasmallproportionontheuniversity’sownbachelor’sdegreeormaster’sdegreecourses.
2.2. Instruments Data collection
Firstly, astatisticalexplorationwasdoneontheaccessesmadetotheUPCT’sMoodle-basedLMS.
Theinformationwasorganisedintofourannualperiods, eachfrom1Septemberto31 August. Web
usageminingservedtoindirectlyidentifycertainbehavioursassociatedwiththeuseofthistypeof
device.
Secondlyandcomplementarily, aquestionnaire surveyof460universitystudentsenrolledon
thevariousdegreescoursestaughtattheUPCT inthe2012/2013academicyearwasconducted.
Conveniencesamplingwasusedtogatherrelevantdatafromthepopulation, suchasgender, degree
The questionnaire was divided into two sections. The firstsection was used toidentify the
demographicaspectsofthestudents;italsocontainedquestionsto findoutaboutthepenetration
ofmobiledevicesforlearningpurposes. Thesecondsectioncontainedthreequestionstoevaluate
levelsofsatisfactionregardingMoodleusewhenmobiledeviceswereused. Theanswersweregiven
onaLikertscalefrom1to7, where1=Stronglydisagreeand7=Stronglyagree.
3. Accesses to the LMS from mobile devices
ActivityontheUPCT’sLMShascontinuedtoincreaseowingtotheintensiveusemadeofitbythe
studentsandlecturers, anditisnowanessentialtoolinuniversityteaching. MonitoringthisLMS
since2009represents anexcellenttooltogetanin-depthknowledgeofchangesinm-learning
mobiledevice usageand of thepatterns of behaviour of studentsaccessingthe website from
suchdevices. Onceagain, itisimportanttonotethatnotallaccessesloggedontheLMSarefor
learningpurposes, asmanyaresimplyforviewingadministrativeitemsliketimetablesandnotes,
forexample.
Attentionshallbefocusedonthetypeofdeviceusedtoaccessthesystem, withthemainaimof
findingoutabouttheevolutionthathastakenplaceinrecentyears. Table1givesdetailsofvarious
relevantaccessdataforthelastfourperiodsinwhichdatawasavailable.
Table 1.General access data, by year and device type
Period
2009/10 2010/11 2011/12 2012/13
Total (includes mobile
devices)
Number of visits Number of pages visited
Pages per visit (mean) Time (mean) Bounce rate (%)
668,937 5,277,737
7.89 5 m 34 s
9.27%
1,031,478 7,509,552
7.28 5 m 50 s 10.14%
1,308,187 10,317,962
7.89 6 m 58 s 11.07%
1,584,192 12,297,842
7.76 7 m 15 s 14.38%
Mobiles (Smartphones)
Number of visits Number of pages visited
Pages per visit (mean) Time (mean) Bounce rate (%) Mobiles / Total visits (%) Mobiles / Total pages (%)
9,495 42,699
4.50 7 m 57 s 12.79% 1.42% 0.81% 49,090 240,766 4.90 5 m 14 s 12.05% 4.76% 3.21% 156,945 747,744 4.76 4 m 44 s 18.14% 12.00% 7.25% 309,720 1,376,974 4.45 4 m 26 s 12.96% 19.55% 11.20%
Tablets
Number of visits Number of pages visited
Pages per visit (mean) Time (mean) Bounce rate (%) Tablets / Total visits (%) Tablets / Total pages (%)
Thedatashownin Table1highlightanumberofpoints. First, theincreaseinthetotalnumberof
visitswasspectacular, almosttriplingintheanalysisperiod. Thus, inthe2012/2013period, theUPCT’s
LMS receivedatotal of1,584,192 visitswith12,297,842pages visited, whereas inthe 2009/2010
periodtherewereonly668,937visitswith5,277,737pagesvisited. Despitethisspectacularincrease,
themeanpagespervisitremainedconstantineveryperiodatnearly8. Alsoworthyofnoteisthe
increaseinthemeantimethatavisitlasted, whichrosefrom5minutes34secondsinthe firstperiod
to7minutes15secondsinthelastperiod. Thissustainedincreasemightbeduetothemultiplication
ofcontentthatthelecturersincorporatedintotheircourses.
Second, Table1breaksdownthedatabythetwomostcommonmobiledevices:smartphones
andtablets. Thesedataarethemostrelevanttothisstudy, astheyallowtheevolutionofaccesses
from thesemobile devicestobeobserved. Whileonly1.42%ofaccesses(9,495visits)werefrom
smartphonesinthe2009/2010period,2thepercentagehadrisento19.55%inthelastyear. Thesame
increasewasobservedforaccessesfromtablets, whichrosefrom0%to3.71%. Takingthetwotypes
ofmobiledevicetogether, thenumberofvisitsfromtheminthelastperiodaccountedfornearlyone
quarterofaccessestotheLMS.
WhencomparedtotheresultsobtainedinthestudybyCasany, Alier, Mayol, Galanis, andPiguillem
(2012)onanothertechnical university, thoseobtainedhereareverydifferent. Thus, inSeptember
2011, 96.21%ofaccesseswerefromdesktoporlaptopcomputers, while3.48%werefrommobile
devicesandonly0.28%fromtablets.
Thereareothercharacteristicsthatshouldbehighlightedwhenexploringaccessesfromdifferent
typesofdevice. First, themeannumberofpagespervisitwasmuchlowerwhenaccesstotheLMS
wasfromamobiledevicethanwhenitwasfromaclassicdevice(desktoporlaptop). Moreover, albeit
withminor fluctuations, thispatternwassustainedoverthefouranalysisperiods. Forexample, in
thelastperiod(2012/2013), themeannumberofpagespervisitwas7.76, irrespectiveofthedevice
used, comparedtoameannumberof4.45fromsmartphones. Itshouldalsobenotedthatthemean
numberofpagespervisitfromtabletswasbetweenboth figures(5.74). Second, themeantimethat
avisitlastedwasgreaterwhenadesktopwasused(7minutes15seconds)thanwhenasmartphone
ortabletwasused(4minutes26secondsand6minutes05seconds, respectively). Theimpressionis
thatthereisastrongrelationshipbetweenthesetwoindicators(meannumberofpages, meantime)
andthesizeofthescreenfromwhichtheLMSisaccessed. Thoseuserswhoaccessfrommobilestend
tolook fortherequiredinformation quickly, whereasthosewhoaccessfromclassicdeviceshave
longerandmorein-depthbrowsingsessionsasregardsthenumberofpagesvisited. Theseresults
coincidewiththoseobtainedfromotherstudies(Mödritscher, Neumann, & Brauer, 2012), including
thoseconductedonSpanishuniversities(Casanyetal., 2012).
Finally, thebouncerate, referringtothenumberofvisitsinwhichonlyonepageofawebsiteis
viewedbeforeleavingit, wasslightlyhigherformobiledevices. Thismaybeduetofactorssuchas
design(smallscreen)orthestudents, who, takingadvantageoftheubiquityoftheirmobiles, usethem
togetone-off piecesofinformation(notes, forexample)andleavethesiteafterviewingjustonepage.
3.1. Time patterns: m-learning study habits
Accessbehaviourfrommobiledevicesalsodisplaystimepatternsthatcanbedescribedbyassessing
accessestotheLMS. Inthissub-section, detailedinformationhasonlybeengivenforthelastperiod
(2012/2013).
Table2showsthepercentagedistributionofaccessesbydevicetype, takingintoaccountthe
most significantperiodsintowhichanacademicyearcanbeconsidereddivided:classes, exams,
holidaysandsummerbreak. Someimportantvariationswerefound. Thus, thehighestpercentageof
accessesfrommobiledevicesoccurredatexamtime, almostcertainlyduetoone-off accesswhen
studentswerelookingforspecificinformation. Inthisperiod, thedemandforinformationusingmobile
deviceswashigherthan30%, comparedtothe25%asanoverallindicator. Theresultsobtainedby
Casanyetal. (2012)werecomparable. A similarbehaviourwasalsoidentifiedinthedistributionof
accessesbydevicetypeinthesummerbreak. Thisincreasemightbeduetothesociodemographic
characteristicsoftheRegionofMurcia, aSpanishautonomouscommunitythathasahighnumber
ofsecondhomesthatdonothavelandlineInternetaccess, thusforcingthestudentstousetheir
smartphonedataconnections.
Table 2. Access, by period and device type (2012/2013)
Classes Exams Holidays Summer break Total
Desktop / Laptop 81.4% 69.1% 81.1% 68.1% 76.7%
Mobile 15.1% 27.2% 15.6% 29.1% 19.9%
Tablet 3.4% 3.7% 3.3% 2.8% 3.4%
Classes: 30 weeks of lectures; Exams: official times from February to June; Holidays: two official periods for Christmas and Easter; Summer break: no lectures.
Inaddition, otherstudieshavedocumenteddifferencesinthetimesofdaywhenaccessesoccur.
SelectingthesametimesasthoseinthestudybyCasanyetal. (2012), accesstotheLMSwasassessed
bythetypeofdevice. Table3showstheresults.
Table 3.Percentage distribution of accesses, by time and device type (2012/2013)
0-7am 8am-1pm 2pm-4pm 5pm-8pm 9pm-12am Total
Desktop / Laptop 71.3% 73.1% 87.7% 79.8% 76.2% 76.7%
Mobile 24.4% 23.1% 10.3% 17.3% 19.9% 19.8%
Tablet 4.3% 3.8% 2.0% 3.0% 4.0% 3.4%
Thishighlightstwopoints. First, mobiledeviceactivitywasslightlyhigheratnight, thuscoinciding
withtheresultsobtainedbyCasanyetal. (2012). Itwasalsohigherinthemorning(8am-1pm), and
lowerinthethirdtimespan(2pm-4pm)..
Finally, the percentagedistribution of accesses byday of theweek is shown in Table 4. No
Table 4. Percentage distribution of accesses, by day of the week and device type (2012/2013)
Mon Tue Wed Thu Fri Sat Sun Total
Desktop / Laptop 76.1% 75.8% 77.1% 76.5% 75.2% 77.7% 80.1% 76.7%
Mobile 20.7% 20.8% 19.7% 19.9% 21.3% 18.8% 16.3% 19.9%
Tablet 3.2% 3.5% 3.2% 3.7% 3.5% 3.5% 3.6% 3.4%
4. Questionnaire survey results
The second analysis tool was a questionnaire survey conducted on 460 students at the UPCT.
Themainobjectiveofthissecondanalysiswas toquantifythepenetrationofmobiledeviceuse,
understoodasthepercentageofstudentsusingamobiledeviceforlearningpurposes.
4.1. M-learning penetration
Table5showsthemaindemographiccharacteristicsofthesampleanalysed.
Table 5. Demographic data of the students and m-learning use
Number (N) Percentage (%)
Q1: Gender
Male 324 70.4%
Female 136 29.6%
Q2: Type of degree course
Engineering 337 73.3%
Business Administration and Management 93 20.2%
University’s own bachelor’s or master’s 30 6.5%
Q3: Year in which you are enrolled
First 160 34.8%
Second or higher 300 65.2%
Q4*: Do you have any of these mobile devices?
Smartphone 374 91.0%
Tablet 104 25.3%
iPod 56 13.6%
iBook 33 8.0%
None 30 7.3%
Q5: Have you ever used any mobile devices for studying?
No 115 25.0%
Yes 345 75.0%
Thestudentsweretechnologicallywell-equipped;91%hadsmartphonesandonly7%didnot
haveamobiledevicewithanInternetconnection. Alsoworthyofnoteisthat25%ofthestudents
hadatablet;ahighpercentagewhentaking intoaccountthenewnessofthesedevicesandthe
difficultyofgainingaccesstothemowingtotheircost.
Withthesedata, itwasnosurpriseto findthat75%ofthestudentssaidthattheyusedthese
devices forstudying. This percentageishigh when compared tothosepresented inthe recent
HESTELO(2103)study, inwhichnearly50%saidthattheyusedm-learning.
Inordertoworkoutwhethersociodemographicfactorshadaninfluenceonanyvariationsinthis
percentage, thefollowingsub-sectionanalysestheexistenceofdifferentialbehavioursbygender,
year, degreetypeandtheavailabilityornotofmobiledevices.
4.2. Sociodemographic factors
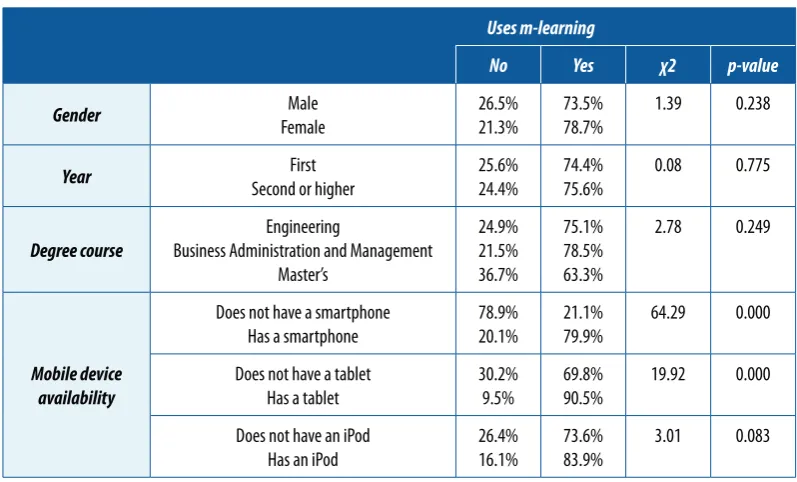
Table 6 shows the results for the relationship between demographic factors and m-learning
use. Gender, yearanddegreetypedidnotleadtoanysignificantdifferences. Inallcases, testsof
independencebasedonr2yieldednullhypotheses.
Table 6.Demographic factors and m-learning use
Uses m-learning
No Yes χ2 p-value
Gender Male Female 26.5% 21.3% 73.5% 78.7% 1.39 0.238 Year First
Second or higher
25.6% 24.4% 74.4% 75.6% 0.08 0.775 Degree course Engineering
Business Administration and Management Master’s 24.9% 21.5% 36.7% 75.1% 78.5% 63.3% 2.78 0.249 Mobile device availability
Does not have a smartphone Has a smartphone
78.9% 20.1%
21.1% 79.9%
64.29 0.000
Does not have a tablet Has a tablet
30.2% 9.5%
69.8% 90.5%
19.92 0.000
Does not have an iPod Has an iPod
26.4% 16.1%
73.6% 83.9%
3.01 0.083
However, mobiledeviceavailabilitydidleadtosignificantdifferences. Forexample, thepercentage
ofstudentsdoingm-learningreachedupto90%amongthosewithtablets. Ingeneral, thissuggests
apositiverelationshipbetweentheavailabilityoftherightdevicesandtheadoptionofm-learning. If
4.3. Attitudes towards mobile device use
Finally, to findoutaboutthestudents’perceptionsofusingtheLMS whentheyaccesseditfrom
mobiledevices, threequestionswereposedtorateaccessibilitytotheUPCT’svirtualclassroom. It
shouldbenotedthat, atthetimeofwriting, theUPCT’sLMSdidnothavetheappformobiles, soit
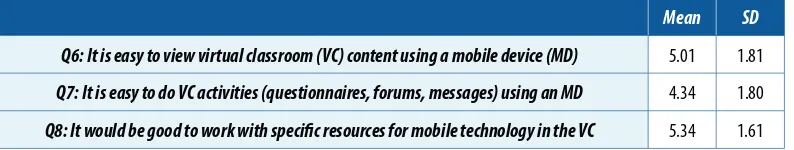
wastobeexpectedthatthestudentswouldratesomeaspectsnegatively. Table7showstheoverall
resultsonlyforthosestudentswhosaidthattheyusedm-learning. Regardingthe firsttwoquestions
(Q6andQ7), theratingsweresurprisinglypositive.
Table 7. Perception of accessibility to Moodle from mobile devices
Mean SD
Q6: It is easy to view virtual classroom (VC) content using a mobile device (MD) 5.01 1.81
Q7: It is easy to do VC activities (questionnaires, forums, messages) using an MD 4.34 1.80
Q8: It would be good to work with specific resources for mobile technology in the VC 5.34 1.61
The impressionisthat thestudentsarepreparedtousemobiledevicesdespite thefactthat
universitiesdonotfacilitateaccess.
5. Conclusions
MobiledeviceuseisincreasinglycommonplaceamongtheSpanishuniversitypopulation. Students
usethesedevicesforeverything, includingstudy. Thereisnodoubtthatm-learningisanemergent
learningtechniquethatistakingrootamonguniversitystudents.
TheMoodleaccessdataobtainedinthisstudyshowhowimportanttheuseofthesedevicesin
highereducationisbecoming. Inthe2012/13academicyear, 25%oftheUPCT’sstudentsaccessed
thisLMSfrommobiledevices. Inaddition, thesurveyresultsshowthat75%ofthestudentsused
themforlearningpurposes. TheyevenperceivedMoodle’susabilityasacceptable, despitethefact
that, at thetimeofwriting, the UPCT hadyet toadaptittomobiledevices. Thiswouldconfirm
thatcertainaccessesweremerelyanextensionofaccesstothee-learningplatformfromtraditional
devices, wherethepedagogicalmethodologyhadnotchangedbecauseitonlyprovidedaccessto
contentanytimeandanywhere. However, thehopeisthatm-learningwillprovidenewpedagogical
modelsthatcanonlybeimplementedbyusingthesetechnologies. Althoughthefutureisuncertain,
thetendencyisclear, andthese figureswill almostcertainly continuetoincreaseinthe2013/14
academicyear.
Theresultsofthisstudyshowthattherearevariousactionsthatuniversitymanagersoughtto
pursuetomeetthisgrowingdemandfromthestudents. First, itisessentialtoadaptLMSstofacilitate
accessfrommobiledevices. Atthetimeofwriting, veryfewuniversitieshadrolledoutthissystem.
toenablethemtoaccesstheminamore flexibleandefficientwayfrommobiledevices. Second, as
designersandcreatorsofcoursesonLMSs, itisimportantforlecturersnottooverlooktheimportance
ofprovidingaformatthatcanbeaccessedfromarangeofdevices, thusmakingtheircoursesmore
userfriendly.
Inaddition, mostlecturersareopposedtotheuseofmobilesintheirclasses. Despitetheubiquity
thatthesetechnologiespermitandtheuniquetypeoflearningthattheyfacilitate(Mobilla, 2011),
formaleducationsystems usuallybanthemorpaynoattentiontothem. Thisisindeedthecase
accordingtothelatest HESTELO(2103)report, whichassertsthat44%ofstudentsusemobiledevices
in class, thoughonly 2% do soat the lecturer’srequest. Moreover, 17%are bannedfrom using
them. Thisopportunityshouldnotbemissed. Thepotentialforlearningthatmobiledevicesofferis
enormous, andtheyhavethecapabilityofbeingasupporttoolforsolvingsomeoftheproblemsthat
highereducationisexperiencing.
References
Arjona, J. E., & Sánchez, V. (2013). Revisiónde opcionespara el usode la plataformaMoodle en
dispositivos móviles [Review of Different Options to Access Moodle Platform Using Mobile
Devices]. RED.Revista de Educación a Distancia, 37,1-15.
Blackboard(n. d.). Retrievedfromhttp://www.blackboard.com
Casany, M. J., Alier, M., Mayol, E., Galanis, N., & Piguillem, J. (2012). AnalyzingMoodle/LMSLogstoMeasure
Mobile Access. In Universidad Politécnica de Cataluña. UBICOMM 2012, The Sixth International
Conference on Mobile Ubiquitous Computing, Systems, Services and Technologies (pp. 35-40).
Castro, F., Vellido, A., Nebot, A., & Mugica, F. (2007). Applyingdataminingtechniquestoe-learning
problems. InL. C. Jain, T. Raymond & D. Tedman(Eds.). Studies in Computational Intelligence Series:
Vol. 62. Evolution of Teaching and Learning Paradigms in Intelligent Environment(pp. 183-221). Berlin,
Germany:Springer-Verlag.
HESTELO(2013). Encuestade HábitosdeEstudioyMovilidad2012 [2012SurveyofMobilityandStudy
Habits]. CátedraMovilidadyEducación. UniversidaddeValladolid. Retrievedfromhttp://ctme.
uva.es/wp-content/uploads/2013/05/encuestahestelo.pdf
Hung, J. L., & Zhang, K. (2012). Examiningmobilelearningtrends2003–2008: A categoricalmeta
-trendanalysisusingtextminingtechniques. Journal of Computing in Higher Education, 24, 1-17. doi
http://dx.doi.org/10.1007/s12528-011-9044-9
Hwang, G. J., & Tsai, C. C. (2011). Researchtrendsinmobileand ubiquitouslearning: A reviewof
publicationsinselectedjournalsfrom2001to2010. British Journal of Educational Technology, 42,
E65-E70. doihttp://dx.doi.org/10.1111/j.1467-8535.2011.01183.x
Martín, S., Díaz, G., Plaza, I., Ruiz, E., Castro, M., & Peire, J. (2011). Stateoftheartofframeworksand
middlewareforfacilitatingmobileandubiquitouslearningdevelopment. Journal of Systems and
Software, 84, 1883-1891. doihttp://dx.doi.org/10.1016/j.jss.2011.06.042
Mobilla, M. D. C. M. (2011). ExperienciasdeinclusióneducativaenColombia:haciaelconocimiento útil
and Knowledge Society Journal, 8(1), 43-54. Retrievedfrom http://www.uoc.edu/ojs/index.php/
rusc/article/view/v8n1-martinez/v8n1-martinez
Mödritscher, F., Neumann, G., & Brauer, C. (2012). ComparingLMSUsageBehaviorofMobileandWeb
Users. 2012 IEEE 12th International Conference on Advanced Learning Technologies (ICALT), 650-651.
doihttp://dx.doi.org/10.1109/ICALT.2012.42
Moodle(n. d.). Retrievedfromhttp://moodle.org
Pachler, N., Ranieri, M., Manca, S., & Cook, J. (2012). Editorial:SocialNetworkingandMobileLearning.
British Journal of Educational Technology, 43, 707-710. doi http://dx.doi.org/10.1111/j.1467
-8535.2012.01365.x
Pahl, C. (2004). Dataminingtechnologyfortheevaluationoflearningcontentinteraction. International
Journal of e-Learning, 3, 47-55.
Park, S. Y., Nam, M. W., & Cha, S. B. (2012). Universitystudents’behavioralintentiontousemobilelearning:
Evaluatingthetechnologyacceptancemodel. British Journal of Educational Technology, 43(4), 592
-605. doihttp://dx.doi.org/10.1111/j.1467-8535.2011.01229.x
Prendes, M. P. (2009). Plataformasdecampusvirtualde softwarelibre: Análisis comparativodela
situación actual en las universidades españolas. Informe del Proyecto EA-2008-0257 de la
Secretaría de estado de Universidades e Investigación [Open source learning management
systems: A comparativeanalysisofthecurrentsituationinSpanishuniversities. ReportofProject
EA-2008-0257oftheOfficeoftheSecretaryofStateforUniversitiesandResearch, Spain]. Retrieved
fromhttp://www.um.es/campusvirtuales/informe.html
Romero, C., & Ventura, S. (2007). Educationaldatamining: A surveyfrom1995to2005. Expert Systems
with Applications, 33, 135-146. doihttp://dx.doi.org/10.1016/j.eswa.2006.04.005
Rushby, N. (2012). Editorial: Anagendaformobilelearning. British Journal of Educational Technology,
43,355-356. doihttp://dx.doi.org/10.1111/j.1467-8535.2012.01313.x
Sakai, MobileSakaiProject(n. d.). Retrievedfromhttps://confluence.sakaiproject.org/display/MOBILE/
Home
SCOPEO. m-learningenEspaña, Portugaly AméricaLatina. Noviembrede2011. Retrievedfromhttp://
scopeo.usal.es/wp-content/uploads/2013/04/scopeom003.pdf
Wu, W. H., JimWu, Y. C., Chen, C. Y., Kao, H. Y., Lin, C. H., & Huang, S. H. (2012). Reviewoftrendsfrom
mobilelearningstudies: A meta-analysis. Computers & Education, 59, 817-827. doihttp://dx.doi.
org/10.1016/j.compedu.2012.03.016
Zorrilla, M. E., Menasalvas, E., Marin, D., Mora, E., & Segovia, J. (2005). Webusageminingprojectfor
improvingweb-basedlearningsites. InMoreno-Díaz, Roberto;Pichler, Franz;Quesada-Arencibia,
Alexis(Eds.), Lecture Notes in Computer Science, Vol. 3643. Computer Aided Systems Theory–EUROCAST