R E S E A R C H
Open Access
Performance characterization and analysis
for Hadoop K-means iteration
Joseph Issa
Abstract
The rapid growth in the demand for cloud computing data presents a performance challenge for both software and hardware architects. It is important to analyze and characterize the data processing performance for a given cloud cluster and to evaluate the performance bottlenecks in a cloud cluster that contribute to higher or lower computing processing time. In this paper, we implement a detailed performance analysis and characterization for Hadoop K-means iterations by scaling different processor micro-architecture parameters and comparing performance using Intel and AMD processors. This leads to the analysis of the underlying hardware in a cloud cluster servers to enable optimization of software and hardware to achieve maximum performance possible. We also propose a performance estimation model that estimates performance for Hadoop K-means iterations by modeling different processor micro-architecture parameters. The model is verified to predict performance with less than 5 % error margin relative to a measured baseline.
Keywords:Performance prediction, Performance analysis, Hadoop K-means Iterations
Introduction
Given the rapid growth in the demand of cloud comput-ing [1, 2] and cloud data, there is an increascomput-ing demand in storing, processing and a retrieving large amount of data in a cloud cluster. The data can be either stored to a cloud network such as scientific data (i.e. Climate modeling, Fusion, Bioinformatics…etc) or use the cloud network for data-intensive tasks such as collecting experimental data, dumping data on parallel storage sys-tems, run large scale simulations…etc. Cloud computing is an emerging technology used to deliver different types of resources known as services over the internet. Cluster computing [3–7] is a set of stand-alone computers con-nected together to form a single computing resource [8, 9]. This improves the performance and availability of a cloud cluster as compared to a single computer.
Hadoop was introduced as a solution to handle pro-cessing, storing and retrieving Big Data in a cloud envir-onment which usually runs on a cluster of commodity machines. This cluster is composed of a master and slave nodes that process and compute data in parallel. It is important for processor architects to understand what
processor micro-architecture parameters contribute to higher or lower performance. It is also important for benchmark developers to optimize the benchmark soft-ware for a given hardsoft-ware to achieve maximum perform-ance possible. Hadoop is an open-source framework with two main components: MapReduce [10], and Hadoop Dis-tributed File System (HDFS). HDFS is the primary storage for Hadoop; it is highly reliable and uses sockets for com-munications and is used for distributed storage [11, 12]. One important feature of HDFS is the partitioning of data and computation using thousands of hosts, and the execu-tion of applicaexecu-tion computaexecu-tions in parallel in a way it is close to their data [13–16]. Hadoop cluster scales with computation and storage capacity by adding more servers. For example, Yahoo Hadoop cluster uses 40,000 servers and stores 40 PetaBytes of application data. Hadoop HDFS is used for data protection and reliability by replicating the file content across multiple DataNodes. This replication increases the probability for locating computation near the needed data.
The MapReduce [17, 10] framework is used for paral-lel processing. MapReduce and HDFS are co-designed, co-developed and co-deployed. What this means is that we have a single set of servers where MapReduce and HDFS are deployed so there is no separate set of servers Correspondence:joseph_issa@yahoo.com
Department of Electrical and Computer Engineering, Notre Dame University, Zouk Mosbeh, Lebanon
for HDFS to store data and a separate set of servers for processing data. One important aspect of MapReduce is that it’s capability of moving compute to data (DataNode on which the data is located) and not the other way around. MapReduce knows where the data is placed in a cluster by working closely with HDFS. MapReduce con-sists of two main components, the JobTracker, and the TaskTracker. The JobTracker is the master and it is responsible for resource management such as tracking which nodes are up or down and how to deal with node failures. The TaskTracker is the slave, it gets direction from the JobTracker to run the tasks and report any fail-ures and scheduling tasks.
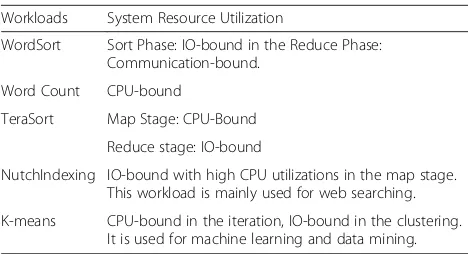
Hadoop framework consists of several micro-benchmarks developed using MapReduce algorithm, in other words, it is a framework used to process large data sets in a distributed computing environment. The resource utilization for the benchmarks is categorized as IO-bound, CPU-bound, or in between. Table 1 summa-rizes the system resource utilization for each workload.
In this paper, we present a detailed performance characterization for Hadoop K-means iterations using dif-ferent processor configurations. We also propose a per-formance projection model that projects and model performance by changing different processor architecture parameters such as the number of cores/threads, memory bandwidth, memory size, cycles-per-instruction (CPI) and memory latency [18, 19]. The remainder of this paper is organized as follows: In“Hadoop K-means Overview” sec-tion, we start with an overview of Hadoop K-means and Mahout K-means implementations. In “Related Work” section, compare our work to other published work of the same topic. In“Performance Characterization using Intel Xeon Based Platform”section we present a detailed per-formance characterization of Hadoop K-means for differ-ent key processor architecture parameters using Intel Xeon processor. In “Performance Characterization using AMD Interlagos Platform” section, we present a detailed performance analysis and characterization for Hadoop K-means using AMD Interlagos processor by analyzing the
performance sensitivity to key processor architecture pa-rameters. In“Performance Projection Model‴section we propose a performance projection model that projects processor performance and total runtime and finally we conclude and discuss future work.
Hadoop K-means overview
Hadoop is designed as a framework for processing (stor-ing and append(stor-ing) multi Petabytes of data sets in a dis-tributed computing cluster systems. There are several components of Hadoop architecture, the first compo-nent is known as the NameNode which is responsible for storing the file system namespace. The second com-ponent of Hadoop architecture is the DataNodes which is responsible for storing blocks and hosting Map-Reduce computation. The JobTracker component is responsible for tracking jobs; also it is responsible for detecting any failures. All applications in Hadoop are based on MapReduce which was introduced by Google. MapReduce means that a given application can be broken down into smaller blocks that can run on any node. The application can run on systems with thou-sands on nodes to achieve better performance. Hadoop is a framework which consists of several micro-benchmarks. Some of these benchmarks are Sort, Word Count, TeraSort, K-means, and NutchIndexing. The file system in Hadoop is organized in a way that maps all the local disks in a cluster into a single file system hier-archy known as HDFS. Hadoop K-means is basically used for machine learning as well as data mining. It is divided into two main phases, the first phase is the iter-ation phase and the second phase is the clustering phase. In the iteration phase, the performance is a CPU-bound, which means the performance will increase if there is an increase in processing power such as an increase in the number of cores. In the clustering phase, the perform-ance is IO-bound which means that the performperform-ance is limited and bounded by IO communication within a cluster. Clustering is a technique used to identify groups (clusters) within the input observation in such a way that the objects within each group will have high similarities and fewer similarities between other groups or clusters. The similarities metric in clustering algorithm uses dis-tance measured only, similarities by correlation is not used in the clustering algorithm. K-means clustering generates a specific number of disjoint (non-hierarchal) clusters. The K-means method is numerical, unsuper-vised and iterative. K stands for K number of clusters and must be manually supplied by the user based on the input data.
Hadoop K-means version 2.7.0 is a clustering algo-rithm in which the input is a set of data points such as K with a set of points X1, X2....Xn. The variable K refers to how many clusters it needs to find. The algorithm Table 1Workloads based on Hadoop framework: System
Resource Utilization
Workloads System Resource Utilization
WordSort Sort Phase: IO-bound in the Reduce Phase: Communication-bound.
Word Count CPU-bound
TeraSort Map Stage: CPU-Bound
Reduce stage: IO-bound
NutchIndexing IO-bound with high CPU utilizations in the map stage. This workload is mainly used for web searching.
starts by placing K centroids in a random location such as C1, C2…Ck. The algorithm will then repeat by exe-cuting the following steps below until convergence:
For each point X, find the nearest centroid C. This is done by computing the distance between Xi and Cj for every cluster centroid, then it pick the cluster J with minimum distance. It will then assign the point X to the cluster of the nearest centroid. For each cluster J = 1...K, the algorithm will take the distance for every point in the selected cluster and average out the distance by using the following relation: C að Þ ¼1nXcjxiX að Þ for a¼1…d , where C(a) is the new centroid for cluster J. The algorithm keeps running them one after the other until none of the cluster assignment changes, so no points change cluster membership. At this point, the algorithm has converged so it stops there. The complexity of the Hadoop K-means iteration algorithm is given as a factor of:
Oð#iterations#clusters#instances#dimensionsÞ
The number of iterations is determined by how many times it will run until the algorithm convergence. An-other implementation of K-means is Apache Mahout [20] which is used as a machine learning software that allows applications to analyze a large set of data. Mahout uses Apache Hadoop power to solve a complex problem by breaking them up into multi-parallel tasks. Mahout offers three machine learning techniques which are Rec-ommendation, Classification, and Clustering. Recom-mendations use user’s information with community information to determine the likelihood of user’s prefer-ence. For example, Netflix uses the Mahout Recommen-dation engine to suggest movies. Classification engine is used for example in classifying spam emails. It uses known data to determine how new data should be classi-fied into a set of existing categories. So every time a user mark an email as ‘spam’ it directly influences the email Classification engine for providing future email spams. The last Mahout engine is clustering which is used for example to group different news of similar article together. This is mainly used by Google and other search engines. Clustering forms a group of similar data based on common characteristics. Unlike classifications, clus-tering does not group data into an existing set of known categories. This is particularly useful when the user is not sure how to organize the data in the first place.
Related work
Analyzing cloud computing performance is an important research topic that leads to several published papers. Map-Reduce clusters are becoming popular for a set of applications [21–23] in which large data processed is stored and shared as files in a distributed file systems.
Emanuel V in [24] presents an analytical model that estimates performance for a Hadoop online prototype using job pipeline parallelism method. In comparison, the projection model proposed in this paper projects performance and runtime using different processor micro-architecture parameters that are important parameters for processor architects to model perform-ance. Furthermore, our model is verified to predict both performance and runtime with <5 % error margin for all tested cases. The performance projection model we present in this paper is flexible and can be implemented without the need for a simulator and sampling traces.
Dejun et al in [25], propose an approach to evaluate the response time and I/O performance. Ibrahim et al in [26], analyze Hadoop execution time on virtual ma-chines. Stewart in [27] compares the performance of sev-eral data query languages. All their work is focused on different aspects for analyzing Hadoop performance. Our work complements performance analysis for Hadoop. We also present a prediction analytical model for performance which is the main focus of the research presented in this paper. There are several performance monitoring tools for Hadoop K-means. Salsa [28] for example is a DataNode/TaskTracker log analyzer which provides data and control flow execution on each node. Mochi [29] extracts job execution view from a Data-Node/TaskTracker logs.
Therdphapiyanak et al in [30] proposed an imple-mentation using Mahout/Hadoop for a large data set by pre-determining the appropriate numbers of K-means clusters. This is done by describing the appropriate number of cluster and the proper amount of entries in log files.
Jiang in [31] conducted an in-depth performance analysis for MapdReduce. The research presented optimization methods to improve performance. However, his research does not present an estimation model to translate the opti-mized methods presented into a performance prediction model.
Esteves et al, in [32] presented detailed performance ana-lysis of Mahout K-means using large data sets running on Amazon EC2 instances. The performance gain in runtime was compared when running on a multi-node cluster.
Performance characterization using Intel Xeon based platform
Several measurements are conducted to analyze the per-formance sensitivity for Hadoop K-means iteration using Intel Xeon based platform.
1) Platform Configuration
configuration, we used 4 Intel platforms with the following setup:
2xIntel Core i7 CPU at 2.7GHz
32GB Memory (8x 4GB DIMMs) at 1066 MHz Network controller using onboard 1GbE Seagate disk at 1 TB 7200RPM
HDFS setup using 5x Intel 200GB SSDs on each system
The software configuration for the setup is as follows:
Disabled power management (including C-states) Disabled Hyper-Threading
Enabled Prefetchers
Operating System used is Red Hat Enterprise Linux with Apache Hadoop version 1.2.1
1:1 Map slots
1:1 Reduce Slots: 1:1 Heap Size is 2GB
2) Problem Size requirements
The workload input size must run and scale on differ-ent processor architecture. We have to model it in a way to scale across different processors architectures using the baseline configuration with Intel Core i7 processor. In order to do that, we need the workload input size to be based on the number of active logical threads with fixed memory size per thread. The problem size relation in GB can be stated as
Problem size¼ ð7=8Þ 2GB of threads ð1Þ
The populated memory should scale as close as pos-sible with JVM heap requirements. The metric used for measurement is the number of samples per unit time (seconds) per node. If the problem size varies, the run-time will not be consistent. So the problem size must have a fixed number of sample, for example, a problem size of 28GB is equal to 409.6 M sample.
3) Core and Socket Scaling
For socket scaling, we conduct measurements using one and two processor sockets for the same number of cores. For core scaling, we used two sockets but change the number of cores (4 cores and 8 cores) as shown in Fig. 1.
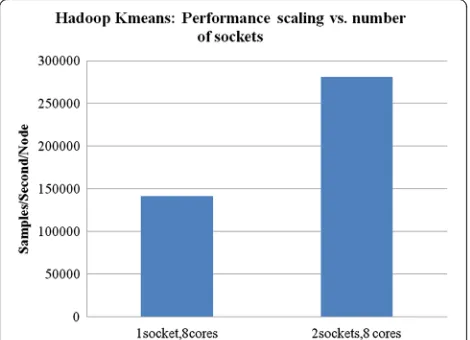
For core scaling, using four and eight cores, the per-formance scaling is linear; close to 2x going from four cores to eight cores. This means that Hadoop K-means performance scales linearly with a number of cores. Fig. 1Performance scaling vs. number of cores Hadoop K-means
For socket scaling, using one and two sockets with eight cores on both, the performance scaling (Sam-ples/Second/Node) shows a linear scaling is about 1.99x. We conclude that both socket and core scaling is 2x. The core scaling was adjusted accordingly using “Active Core Count” in BIOS while the socket scaling is achieved using the physical removal of a processor with associated memory. The Cycles-Per-Instruction (CPI) overall for the benchmark using different input sizes (14 GB and 28 GB) calculated is about 0.52 for 1 socket/8 cores, 2 sockets/8 cores, and 2 sockets/4 cores. The Execution Length (EL) for different config-urations is constant ~ 262,000. The EL is defined by the total number of instructions executed per differ-ent cores. In this case, it is constant and doesn’t change with respect to the change in the number of
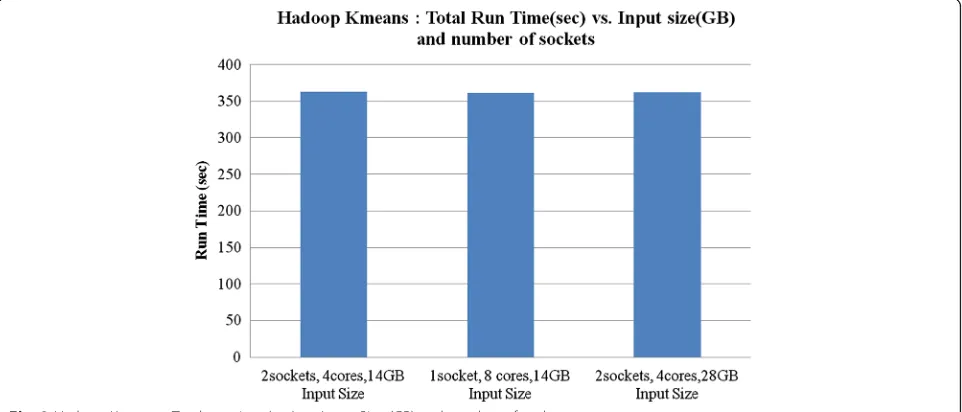
cores. The total runtime for different input sizes and different configurations is constant about 362 seconds as shown in Fig. 2.
This shows that the total runtime (seconds) is almost constant relative to a different number of sockets, the number of cores and the input data size. What change is the performance metric defined as Samples/ Second/Node for different configurations as previ-ously shown in Fig. 1 and Fig. 3. Next, we analyze core and socket scaling with respect to memory bandwidth (GB/sec) and performance as shown in Fig. 4.
From Fig. 4 we conclude that performance is corre-lated with memory bandwidth. That is the scaling in per-formance between 1 socket/8 cores/14GB input size to 2 sockets/4 cores/28GB is about 2x. Same is true for mem-ory bandwidth; the scaling for the same configurations is also about 2x.
4) Core Frequency Scaling
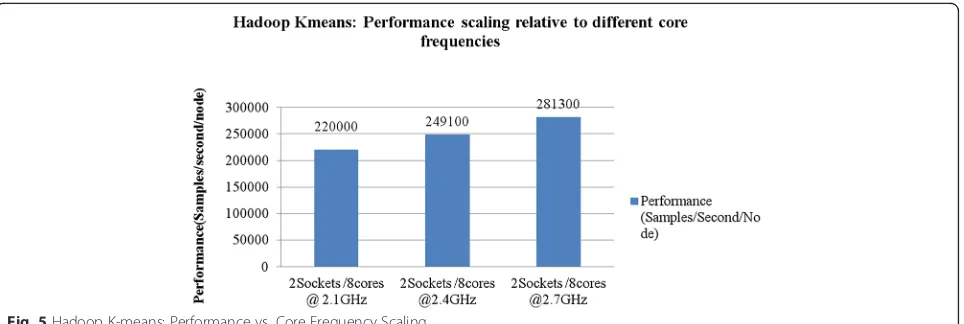
Core frequency scaling is required so we can analyze how performance behaves with respect to higher core frequencies as shown in Fig. 5. The scaling between two or three core frequencies will indicate the performance change between these measured data points; so that we can use to model the performance with respect to the frequency change.
From Fig. 5, the performance is measured as a number of samples per second per node (samples/second/mode). The performance scaling from 2.1GHz to 2.4GHz (2.4/ 2.1 = 1.14) is about 1.13x (249100/220000) in perform-ance, and from 2.4GHz to 2.7GHz (2.7/2.4 = 1.125) the performance scaling is about 1.12x (281300/249100). Fig. 3Performance scaling vs. number of sockets
However, the performance scaling from 2.1GHz to 2.7GHz (1.28) is about 1.27x (281300/220000). This shows that there is an excellent scaling between core fre-quency and performance so we can use this scaling fac-tor for core frequency in the performance model. Memory bandwidth scales almost linearly with core fre-quency as shown in Fig. 6.
The scaling rate from 2.1GHz to 2.4GHz is 1.14x while the scaling rate for memory bandwidth is 8670/7600 = 1.14x. Similarly, the scaling for 2.1GHz to 2.7GHz is 1.28x and the memory bandwidth scaling is 9600/7600 = 1.26x. This shows that the scaling factor for memory bandwidth with respect to the scaling factor for core frequency is linear.
5) Hyper-Threading/Simultaneous Multi-Threading Scaling
Enabling the processor Hyper-Threading (HT) feature will enable an active core to execute two threads per core instead of one thread or Single Thread (ST). In our per-formance characterization, we found that enabling Simul-taneous Multi-Threading (SMT) and scaling the workload with respect to thread count shows an average of 20 % in-crease in performance with all cores active.
In Fig. 7, SMT scaling for 2 sockets/4 cores shows 1.2x improvements in performance from Single Thread (ST) to HT with 1GB heap size. It also shows a 1.24x performance improvement from ST to HT with 2GB Heap size. For 2 sockets/8 cores, the improvement from ST to HT with 1GB heap size is 1.17x and for HT with 2GB heap sizes its 1.22x in performance improvement. Given that HT is en-abled, the CPI for the kernel increases with an average of 40 % as compared to HT off, but the overall CPI is 0.97 on average.
Fig. 5Hadoop K-means: Performance vs. Core Frequency Scaling
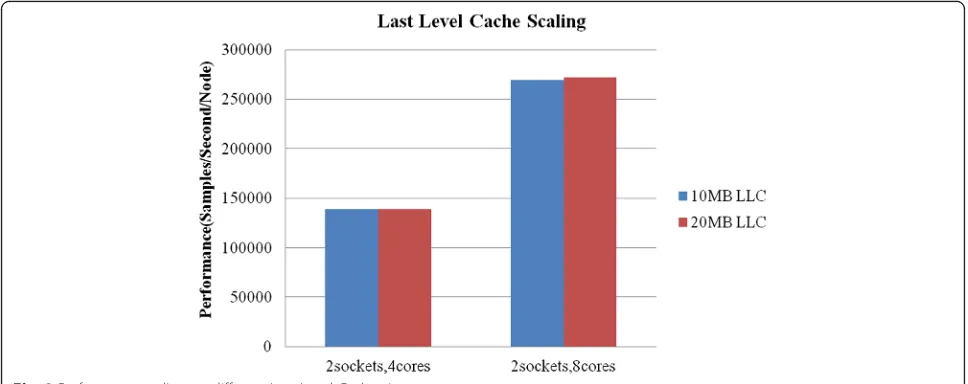
6) Last Level Cache Scaling
The capacity of Last Level Cache (LLC) does not have any impact on performance improvement. If the cache size is increased from 10 MB to 20 MB, the performance improvement is only 1.01x as shown in Fig. 8 using 2 sockets/4 and 8 cores processor configuration. So for Hadoop K-means workload it is not bounded by LLC. We conclude there is no performance improvement even if LLC size is increased above 20 MB.
The Message Passing Interface (MPI) is directly re-lated to the LLC size. For 10 MB LLC size, the over-all LLC MPI measured is 0.00111 using 2 sockets
with 4 cores. For 20 MB LLC size, the MPI mea-sured is 0.00097, this shows that MPI is affected by LLC size with about 14 % decrease with LLC 20 MB versus LLC 10 MB which is expected. For memory bandwidth, there is about 7 % lower in memory bandwidth utilization for the same performance with larger LLC.
7) Data Input Size Scaling
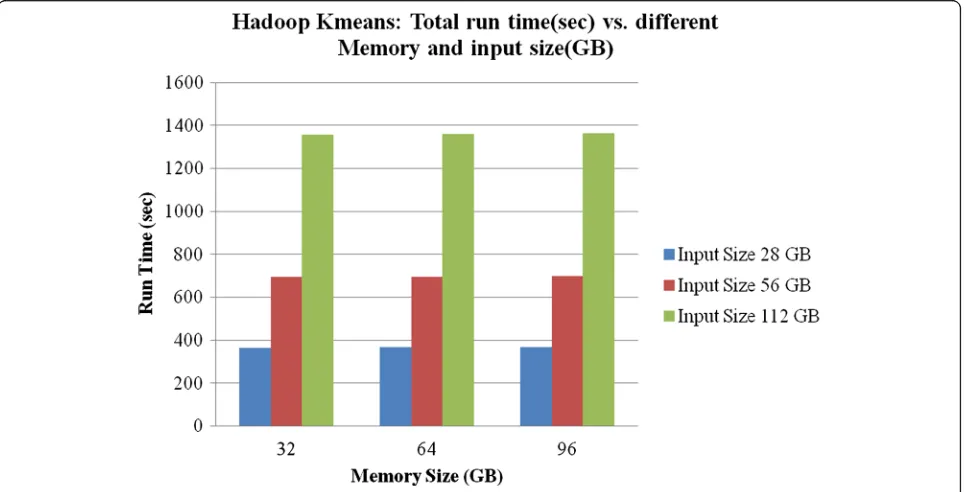
Data input size is a key factor that impacts perform-ance for Hadoop K-means. We scaled input size and analyzed the change in execution run-time. The result is Fig. 7Hadoop K-means: Performance vs. Simultaneous Multi-Threading scaling with different heap sizes
an increase of twice the input size results in about 1.9x increase in run-time. For example, the scaling factor for 56GB/28GB is 2x, and the scaling factor for run-time (695 sec/367 sec) is 1.9x. Figure 9 shows the input size scaling with respect to total run-time for different mem-ory sizes. In this case, the memmem-ory size does not have any impact on total run-time, with less than 1 % vari-ation for memory size 32GB, 64GB, and 96GB.
In summary, a 2x increase in input size will result in about 1.9x increase in execution time regardless of
memory size. Figure 9 shows even more linear scaling going from 56GB to 112GB input size.
8) Memory and Heap Size Scaling
For memory scaling, there is almost a 1 % run-time variation between different memory sizes. This indicates there is no performance and run-time variation for Hadoop K-means for these three memory sizes (32GB, 64GB, and 96GB) as shown in Fig. 10.
Fig. 9Total run-time (sec) vs. different input sizes (GB) for different memory sizes (GB)
The run-to-run variation for the run-time data col-lected for memory scaling is in the range of 1 %-3 % which is an expected run-to-run variation range. For heap size scaling, we used heap size of 1GB, 2GB, and 4GB. The run-time is almost the same for different input size as shown in Fig. 11.
Performance characterization using AMD interlagos platform
In this section, we implement performance analysis characterization for Hadoop K-means iteration using AMD Interlagos platform.
1) AMD Platform Setup
The slave node configuration consists of software and hardware configuration. For slave node hardware config-uration, the following setup is used:
4x AMD Interlagos platforms (Bulldozer core) Two different chassis: 2x HP Proliant and 2x Supermicro
CPU: 2x 2.60GHz ITL
Memory: Fixed at 1066 MHz for all configurations 32GB = 4x 8GB DIMMs (1-socket) and 64GB = 8x 8GB DIMMs (2-socket)
NIC: Onboard 1GbE (only 1 port in use)
For disk configuration, the System disk used is Seagate 1 TB 7200RPM (holds no HDFS data). The HDFS: 4x Intel 200GB SSDs on each system. All disks attached via an SAS controller.
For slave node software configuration, the following setup is used:
Power Now: Enabled, but frequency fixed via On Demand governor and Core Performance Boost disabled
Prefetchers: Enabled
Operating System: Red Hat Enterprise Linux 6.1 with Kernel version 2.6.32
Java: Sun 1.6.0_25
Hadoop distribution: 1.0.2 snapshot (based on Apache distribution)
Map Slots: 1:1 with active logical threads Reduce Slots: 1:1 with active logical threads Heap Size: 2GB
2) Problem Size Requirements
The workload needs to scale across all testing do-mains using different processor architectures. So the approach is to use a workload input size based on a number of active logical threads with fixed memory size per thread as indicated in Eq (1). The populated memory also scales as close as possible with JVM heap requirements. The metric used for measurement is samples/sec/node. The run-time is not a consistent metric if we are varying the problem size. A given problem size has a fixed number of samples (unit of work). Ex. 28GB problem size per node (without rep-lication) = 409.6 M total samples. The metric calcu-lated is Total Samples/Run-time/# of Nodes.
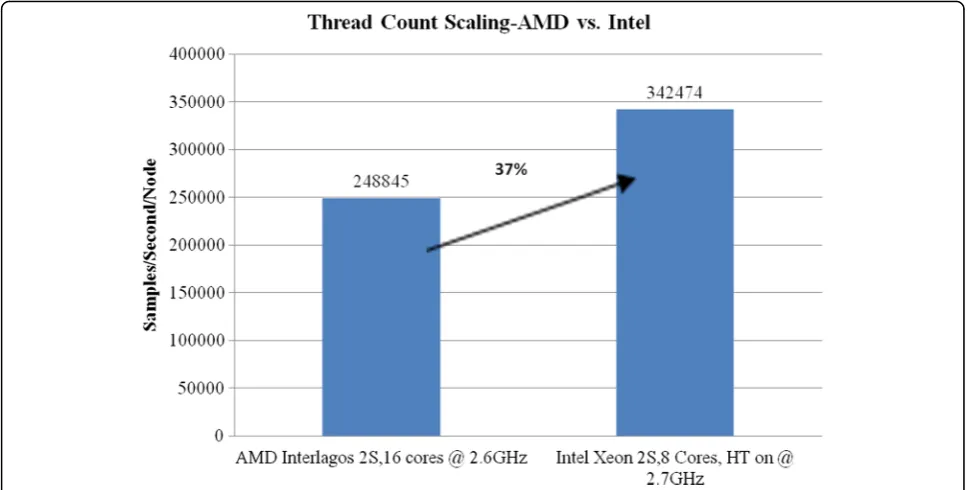
3) Hadoop K-means Performance Scaling with respect to thread Count
This experiment is implemented to scale performance with respect to thread count. The measurements were
taken using Intel Xeon processor (2 sockets, 8 cores, Hyper-Threading On, at 2.7GHz core frequency) which gives a total of 32 threads versus AMD Interlagos (2 sockets, 16 cores, at 2.6GHz core frequency) which also gives a total of 32 threads. Comparing the performance for these two configurations, we conclude that there is a ~37 % lead for Intel Xeon compared to AMD Interla-gos using the same thread count as shown in Fig. 12. Given the slight difference in core frequency (2.6GHz vs. 2.7GHz), our Hadoop K-means frequency scaling
assessment indicates that the performance will be close to 34 % instead of 37 %.
The total run-time for Intel vs. AMD shoes that Intel Xeon total run-time is 35 % less (smaller the better) compared to AMD run-time as shown in Fig. 13. This is implemented for the same number of threads (32).
The CPI for Intel Xeon is measured at 0.96 versus 1.26 for AMD which means Intel CPI is ~24 % lower as com-pared to AMD.
Fig. 12Thread scaling for AMD vs. Intel
4) Hadoop K-means Performance scaling with respect to thread count
Performance change with respect to a change in the number of sockets was implemented on AMD Interlagos system for one and two sockets.
From Fig. 14, we conclude that there is a linear scaling between one and two sockets on AMD Inter-lagos system. The performance rate change is 96 % going from one to two sockets. For Intel Xeon sys-tem, the performance is also about 98 % between one and two sockets configuration. This confirms the Hadoop K-means scales linearly with respect to the number of processor sockets. For the CPI scaling as
the number of sockets doubles, the CPI change from one to two sockets is relatively flat around 1.22 for one socket versus 1.26 for two sockets. We conclude that CPI does not change significantly as the number of sockets doubles.
5) Hadoop K-means Performance Scaling for AMD with respect to core count using 2 sockets
Hadoop K-means performance scaling for AMD Inter-lagos using 2 sockets processor shows a linear scaling with respect to a change in a number of cores as shown in Fig. 15. The performance almost doubles when the number of cores doubles (Fig. 16).
Fig. 14Socket scaling for AMD Interlagos
The same measurement was implemented on Intel Xeon processor, and a similar conclusion can be con-cluded for Intel Xeon as performance doubles when the number of cores doubles. There is a slight increase in CPI when the number of cores doubles.
We conclude there is a slight increase in CPI when the number of cores increases at a non-linear rate.
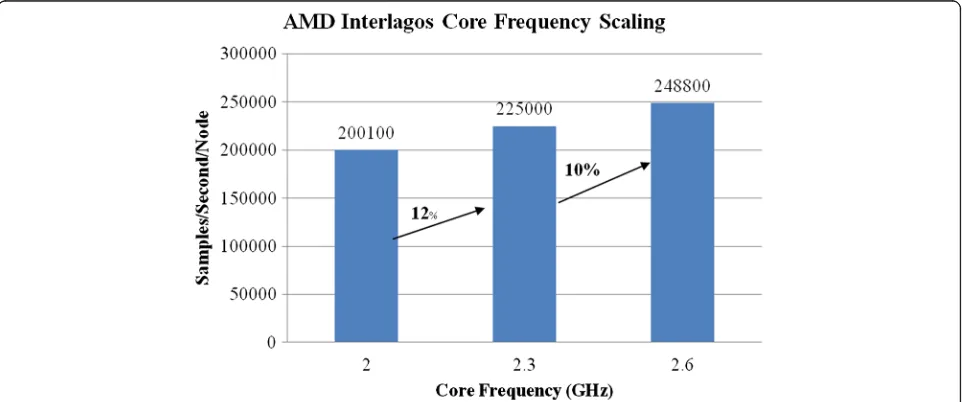
6) Hadoop K-means Performance Scaling for AMD with respect to core frequency
The performance for Hadoop K-means scales almost linearly with respect to change in core frequency as shown in Fig. 17. For example changing core frequency
from 2.0GHz to 2.3GHz (2.3/2.0 = 1.15 or 15 %) results in a 12 % increase in performance (225000/200100 = 1.12). Similarly changing the core frequency from 2.3GHz to 2.6GHz (2.6/2.3 = 1.13 or 13 %) will result in 1.105 change rate in performance (248800/225000 = 1.105 or 10.5 %). Note that the frequency scaling was achieved through Linux governor.
7) AMD Interlagos core and cluster scaling using one socket
The objective for analyzing performance with respect to a number of clusters and a number of cores is to under-stand the core-per-cluster impact on performance. From Fig. 16CPI scaling with respect to change in number of cores for AMD Interlagos
Fig. 18, we conclude there is a performance benefit for additional core per cluster. For example, in four cluster configuration, the change from one thread to two threads results in about 60 % increase in performance. Similarly for eight clusters, the performance benefits going from one thread to two threads is also about 60 %. However in one cluster configuration, the performance benefit going from one to two threads is almost doubled (>100 %). We can conclude that there is a performance benefit for additional core-per-cluster for most configurations.
There is an increase in performance going from one cluster to four clusters in a range of 4.4x, and the per-formance increases by ~2.2x going from four clusters to 8 clusters as shown in Fig. 18.
Performance model
In this section, we discuss a detailed processor perform-ance projection model for Hadoop K-means based on the performance characterization we did in Section IV is used to derive the performance model. We start with de-fining the general equation for performance, the per-formance (samples/second) relation is derived as
Performance ¼core frequencyTotal#of cores Execution LengthCPI ;
ð2Þ
and the total run-time in seconds is given by
Run Time¼ Input Size
#of nodesPerformance : ð3Þ
The Execution Length (EL) is defined by the total number of instructions executed divided by measured performance baseline given as
Execution Length¼ of instructions executed
measured performance : ð4Þ
The Cycles-per-Instruction is given as
CPI¼CoreCPIþ0:5MPI
Memory Latency; ð5Þ
where the core CPI is defined as the CPI without the memory stall cycles added. In other words, it is the CPI with no cache misses in the Last Level Cache. Given that this scenario is not realistic, we have to add the cycles generated from memory misses which is the MPI multi-plied by memory latency. The‘0.5’factor used in Eq (5) to multiply the memory latency and MPI, is caused by memory cache miss which is referred to as a memory blocking factor. We expect the memory blocking factor to range from 0 to 1 for most processors. In case it is equal to 0, this means there are no memory misses at all which means that the CPI is equal to the CCPI. This is not a realistic scenario for this workload. On the other hand, if the memory blocking factor is ‘1’, it means that there is 100 % miss rate, which is not a realistic scenario. Based on statistical analysis for memory a 0.5 value for blocking factor is used for Hadoop K-means. The model is verified to project performance (samples/second) and
run-time(seconds) with <5 % error margin for all tested cases as shown in Fig.19and Fig.20.
From Fig. 19, the performance measured is com-pared to performance projected by the model. We verified different processor configurations such as dif-ferent number of sockets, difdif-ferent number of cores, different core frequency, and different input sizes, with Hyper-threading set to off. All these variables are included in the performance model. The error variation is within expected range of < 5 %. Among all tested configurations in Fig. 19, the peak performance achieved is for 2 sockets, 8 cores, 2.7GHz core fre-quency with 28 GB input size.
For modeling run-time, the highest run-time is ex-pected for the configuration with lowest core frequency which in this case is 2.1GHz as shown in Fig. 20. All
tested cases for run-time (measured vs. projected) shows an error margin of <5 %.
Conclusion
In this paper, we presented a detailed performance characterization analysis for Hadoop K-means using Intel and AMD based processors. We also proposed a projec-tion model for Hadoop K-means workload. The projecprojec-tion model is verified to project performance and runtime with 5 % error margin for all tested cases. The model is flexible to accept any changes in processor micro-architecture parameters and estimate performance or runtime. The model does not require any simulation which in turn re-quires trace based sampling for the workload. In future work, we can implement the same approach for different Hadoop framework workloads such as word count and
Fig. 20Run-time: Projected vs. Measured
implement a full details performance characterization. The model can be expanded to include IO latency such as disk and network latency. The focus of this paper is on the processor performance excluding any IO latency, this is why the input size selected was 28GB which is less than the system memory size of 32GB. For AMD Interlagos versus Intel Xeon performance analysis, we conclude that there is about 38 % better performance for Intel Xeon as compared to AMD Interlagos. The socket and core scaling is almost linear in most measured cases, the sample con-clusion applied to Intel Xeon Processor. For cluster-per-core scaling, there is about 60 % increase in performance for AMD Interlagos processor.
Competing interests
The authors declare that they have no competing interests.
Authors’contributions
The research presented in this paper is the result of individual work. The author read and approved the final manuscript.
Authors’information
Joseph A. IssaDr. Issa joined the faculty of engineering at Notre Dame University in October 2013 as an assistant professor in the department of Electrical, Computer and Communication Engineering (ECCE). Dr. Issa research areas of interest include processor architecture, performance and power modeling for different processor architectures using different cloud computing and high-performance computation workloads. He teaches a number of subjects at Notre Dame University including computer processor architecture (MIPS, x86, and ARM), microprocessors, PIC microcontrollers and digital logic design. He received his B.E in computer engineering from Georgia Institute of Technology in 1996. He obtained his master’s degree in computer engineering at San Jose State University in California in 2000 and received his Ph.D. in Computer Engineering from Santa Clara University in California in 2012.
Received: 10 August 2015 Accepted: 6 March 2016
References
1. Mak VW and Lundstrom SF (1990) Predicting performance of parallel computations. IEEE Trans. Parallel Distributed Systems, Online Journal 2. Mell P, Grance T (2011) The NIST definition of cloud computing. NIST
Special Publication, online (800-145)
3. Dean J and Ghemawat S (2004) MapReduce: Simplified data processing on large clusters. 6th conference on Symposium on Opearting Systems Design & Implementation, Seattle, WA, USA
4. Fitzpatrick B (2004) Distributed caching with Memcached. Linux Journal 2004(124):5
5. Vianna E (2011) Modeling performance of the hadoop online prototype. International Symposium on Computer Architecture, Vitoria
6. Xie J (2010) Improving Map Reduce performance through data placement in heterogeneous Hadoop clusters. IEEE International Symposium on Parallel & Distributed Processing, Atlanta
7. Ishii M, Han J, Makino H (2013) Design and performance evaluation for hadoop clusters on virtualized environment. In: 2013 International Conference on Information Networking (ICOIN), pp. 244–249
8. Chao T, Zhou H, He Y, and Zha L (2009) A Dynamic MapReduce Scheduler for Heterogeneous Workloads. Techical paper online, IEEE Computer Society. 9. Ranger C, Raghuraman R, Penmetsa A, Bradski G, and Kozyrakis C (2007)
Evaluating MapReduce for multi-core and multiprocessor systems. High-Performance Computer Architecture, Proc. IEEE 13th Int’l Symp. High Performance Computer Architecture, Scottsdale, AZ, USA
10. Dean J and Ghemawat S (2004) MapReduce: simplified data processing on large clusters. In Op. Systems Design & Implementation
11. Hendricks J, Sambasivan RR, and Sinnamohideenand S, Ganger GR (2006) Improving small file performance in object-based storage. Technical report, Carnegie Mellon University Parallel Data Lab, Online technical report 12. Berezecki M, Frachtenberg E, Paleczny M, Steele K (2011) Many-Core
Key-Value Store. International Green Computing Conference and Workshops, Orlando, FL, USA
13. Mandal A et al (2011) Provisioning and Evaluating Multi-domain Networked Clouds for Hadoop-based Applications. Third International Conference on Cloud Computing Technology and Science, Athens, Greece
14. Shafer J, Rixner S, Cox AL (2010) The Hadoop distributed filesystem: Balancing portability and performance. IEEE International Symposium on Performance Analysis of Systems & Software, White Plains, NY, USA 15. Leverich J, Kozyrakis C (2010) On the energy (in)efficient of Hadoop clusters.
ACM SIGOPS Operating systems Review, Indianapolis, IN, USA 16. Chun B (2010) An Energy Case for Hybrid Datacenters. ACM SIGOPS
Operating System Review, Indianapolis, IN, USA
17. Wang G, Butt A, Pandey P, and Gupta K (2009) Using realistic simulation for performance analysis of MapReduce setups. LSAP. ACM, Munich, Germany 18. Issa J, Figueira S (2010) Graphics Performance Analysis Using Amdahl’s Law.
IEEE/SCS SPECTS, International Symposium on Performance Evaluation of Computer and Telecommunication System, Ottawa, ON, Canada 19. Issa J, Figueira S (2011) Performance and power-Consumption Analysis of
Mobile Internet Devices. IEEE IPCC–International Performance Computing and Communications Conference, Austin, TX, USA
20. Apache Software Foundation: Official apache hadoop website: http:// hadoop.apache.org. (2015)
21. Wiktor T et al (2011) Performance Analysis of Hadoop for Query Processing. International Conference on Advanced Information Networking and Applications, Fukuoka, Japan
22. Ekanayake J, Pallickara S, and Fox G (2008) MapReduce for data intensive scientific analysis. In: Fourth IEEE Intl. Conf. on eScience, pp. 277–284. 23. Chu C-T, Kim SK, Lin Y-A, Yu Y, Bradski G, Ng AY, and Olukotun K (2007)
Map-Reduce for machine learning on multicore. NIPS, Vancouver, B.C., Canada, pp. 281–288.
24. Emanuel V (2011) Modeling Performance of the Hadoop online Prototype. ISCA, San Jose, CA, USA
25. Dejun J and Chi GPC (2009) EC2 Performance Analysis for Resource Provisioning of Service-Oriented Applications. International Conference on Service-Oriented Computing, Stockholm, Sweden
26. Ibrahim S, Jin H, Lu L, Qi L, Wu S, and Shi X (2009) Evaluating MapReduce on Virtual Machines: The Hadoop Case. International Conference on Cloud Computing, Bangalore, India
27. Stewart R (2010) Performance and Programmability of High Level Data Parallel Processing Languages. http://www.macs.hw.ac.uk/~rs46/papers/ appt2011/RobertStewart_APPT2011.pdf
28. Tan J, Pan X, Kavulya S, Gandhi R, and Narasimhan P (2008) Salsa: Analyzing Logs as State Machines. In: Workshop on Analysis of System Logs. 29. Tan J, Pan X, Kavulya S, Gandhi R, and Narasimhan P (2009) Mochi: Visual
Log-analysis Based Tools for Debugging Hadoop. In: HotCloud. 30. Therdphapiyanak J, Piromsopa K (2013) An analysis of suitable parameters
for efficiently applying K-means clustering to large TCPdump data set using Hadoop framework. In: 10th International Conference on Electrical Engineering/Electronics, Computer, Telecommunications and Information Technology
31. Jiang DR, B. Ooi B, Shi L, and Wu S (2010) The performance of MapReduce: an in-depth study. Proceedings of the VLDB Endowment, Online Journal 32. Esteves RM, Pais R, Rong C (2011) K-means Clustering in the Cloud–A Mahout