R E S E A R C H
Open Access
The collaboration network of the Brazilian
Symposium on Databases
30 editions of history
Lucas Henrique Costa de Lima
1, Gustavo Penha
1, Laís Mota de Alencar Rocha
1, Mirella M. Moro
1*,
Ana Paula Couto da Silva
1, Alberto H. F. Laender
1and José Palazzo M. de Oliveira
2Abstract
The Brazilian Symposium on Databases (SBBD) celebrated its 30th edition in October 2015. As the database
community has evolved over the years, so has the data analysis area. To celebrate such accomplishments, this article goes over the SBBD history from distinct social perspectives. Overall, we investigate the complete SBBD co-authorship network built from bibliographic data of SBBD’s 30 editions, from 1986 to 2015, and analyze several network metrics, considering the network evolution over the three decades. In particular, we analyze the progress of the most engaged SBBD authors, the number of distinct authors, institutions, and published papers, and the evolution of some of the most frequent terms presented in the titles of the papers, as well as the influence and impact of the most prominent SBBD authors.
Keywords: Collaboration networks, Social networks, Databases, SBBD
Introduction
The Brazilian Symposium on Databases (SBBD) cele-brated its 30th edition in October 2015. Besides specific scientific meetings held during the Annual Congress of the Brazilian Computer Society (CSBC), SBBD is only the second national scientific event promoted by SBC to accomplish 30 editions (the Brazilian Symposium on Computer Networks and Distributed Systems – SBRC, celebrated its 30th anniversary in 2012 [22]). As the database community has evolved over the years, so has the data analysis area. Most prominently, the area of social networks analysis (SNA) has recently bloomed by auto-matically applying a number of specific metrics over big volumes of data.
In order to celebrate such accomplishments and tak-ing advantage of recent advancements in SNA, this article goes over the SBBD history from distinct social perspec-tives. Specifically, the main objective is to present a deep analysis of the Brazilian database community based on the publications at the SBBD proceedings and its associated
*Correspondence: [email protected]
1Universidade Federal de Minas Gerais, Belo Horizonte, Brazil Full list of author information is available at the end of the article
journal, the Journal of Information and Data Management (JIDM). We achieve this by investigating the complete SBBD co-authorship network built from bibliographic data of SBBD’s 30 editions, from 1986 to 2015, and analyz-ing several network metrics, such as degree, density and assortativity, as well as considering the network evolution over the three decades. In particular, we analyze the most engaged SBBD authors, the number of distinct authors, institutions, and published papers, and the evolution of some of the most frequent terms presented in the titles of the papers. Finally, we discuss the productivity, influence, and impact of SBBD authors through centrality measures and show that the SBBD network follows a phenomenon typical in social networks known as small-world [35].
The remaining sections of this article are organized as follows. The “Related work” section covers related work on academic collaboration. The “Background information” section provides background information on data acquisition, network modeling, and key met-rics considered in our study. The results of our analy-ses are presented from the “Basic statistics” section to the “Homophily” section, covering (respectively) statis-tics of the network and authors, collaborations and new-comers, communities, influential authors, and homophily.
Finally, the “Conclusions” section summarizes the main conclusions and possible future directions.
Related work
Collaboration networks analyses have been well explored to reveal interesting features of academic communities. Newman presents the first studies in this area [27, 28]. He presents distributions of collaborators and their clus-ters and characterizes different patterns of collabora-tion between distinct fields. Then, Newman [29] answers a broad variety of questions about collaboration pat-terns, presenting several structural and topological fea-tures from bibliographic databases in biology, physics, and mathematics. Likewise, other studies build and ana-lyze academic networks by countries [16, 24], universities [7, 16, 21], researchers [3, 19], subareas [18, 19], and venues [2, 5, 22, 26, 31, 32].
There are also studies that regard Computer Science (CS) as a specific area. For example, Freire and Figueiredo [10] characterize the structural properties of the collabo-ration network in CS by exploring external collabocollabo-rations of groups and individuals. Lima et al. [18] propose ranking authors across multiple research areas by characteriz-ing the profile of top Brazilian researchers. Mena-Chalco et al. [23] study the Brazilian co-authorship network by exploring topological metrics.
In this article, we perform a deep analysis of the Brazilian database research community by evaluating the collaboration network of the Brazilian Symposium on Databases on the occasion of its 30th edition. Consider-ing other specific database conferences, Nascimento et al. [26] analyze the co-authorship network of the ACM SIG-MOD International Conference on Management of Data, whereas Ameloot et al. [2] go over the 30 years of his-tory of the ACM Symposium on Principles of Database Systems (PODS).
Regarding other CS areas, Duarte et al. [8] analyze the works presented at the the Brazilian Sympo-sium on Multimedia and the Web in the period 1995–2012 in order to provide an overview of its community and show how its research topics have evolved over time. Likewise, Neto et al. [11] inves-tigate the impact of international research in the Brazilian Symposium on Software Engineering (SBES) by analyzing its first 24 editions. Moreover, Smeaton et al. [33] analyze the co-authorship network and research topics at the 25-year celebration of the International ACM SIGIR Conference on Research and Development in Information Retrieval. Liu et al. [20] focus on the first decade of the Digital Libraries community by ana-lyzing the coauthorship network of past ACM, IEEE, and joint ACM/IEEE digital library conferences. Simi-larly, Maia et al. [22] study the collaboration network of the Brazilian Symposium on Computer Networks and
Distributed Systems (SBRC) over its 30 editions. Besides analyzing its co-authorship network, they also consider several network properties to describe the kinds of col-laborations found and identified the main communities within SBRC.
Similar to the aforementioned works, here, we analyze SBBD’s co-authorship network statistics, including aver-age of articles by author, articles by edition, and coauthors by article. We also evaluate several structural and tem-poral characteristics, such as the main type of co-author relationship among authors, the most prominent com-munities within SBBD, the collaborations and newcomers on the network, and the homophily of SBBD from two perspectives: affiliation and gender.
The SBBD community was briefly studied by Procópio et al. in a short paper [31] on the occasion of its 25th anniversary, with an analysis of both its structural char-acteristics and temporal evolution. Besides including the data of the last 5 years and contributing to a more thor-ough analysis of the SBBD network, we provide a deeper investigation underlying social perspectives such as col-laborations between authors in this network, communi-ties assembled inside SBBD, and authors with central roles in the network. Hence, we considerably expand the previ-ous work, not only in the time interval considered but also in the many analytical dimensions added.
Background information
This section describes background information on data acquisition, network modeling, and key metrics consid-ered in our study. Given the importance of data acquisi-tion in this kind of analysis, we start by describing our dataset building process.
Dataset
For a more complete study, we consider both publi-cation statistics and co-authorship social perspectives. Therefore, our dataset comprises bibliographic data of SBBD’s 30 editions from 1986 to 2015, which includes for each paper: its title, year of publication, list of authors with their respective affiliations, and the language the paper was written. As each SBBD edition is unique in terms of its program and aiming at a more robust anal-ysis, we consider only full papers actually presented at the symposium (i.e., our dataset disregards short papers, demos and tools, tutorials and keynotes, and workshop papers).
the publications of one person under two different author names.
Note that, from 2010 to 2014, SBBD full papers were published as articles in the Journal of Information and Data Management - JIDM2, whereas the SBBD proceed-ings included short papers, demos and workshop papers. Then, the 2015 edition published full papers in the pro-ceedings (mostly in Portuguese) and articles in JIDM as well. JIDM has also published full versions of invited SBBD short papers, as well as invited papers from other confer-ences such as the Brazilian Symposium on Geoinformatics (GeoInfo), the Symposium on Knowledge Discovery, Min-ing and LearnMin-ing (KDMiLe), and the Brazilian Symposium on Multimedia and the Web (WebMedia). Thus, seek-ing a more round analysis, for the 2010–2015 period, we consider only full papers from SBBD proceedings and all SBBD-related papers from JIDM (both regular articles and invited full versions of short papers). Selected papers from the other conferences are not considered, as they do not reflect publications from the SBBD community, the focus of our study.
Network model
Following Maia et al. [22], in this study, we also represent the SBBD network as a temporal graph Gy = (Vy,Ey), where Vy is the set of vertices, Ey is the set of edges, andy is the year a network refers to. The graphGy =
(Vy,Ey)is an undirected weighted graph, where the ver-tices represent authors, and the edges indicate that two authors have published together in or before the year y. In addition, each edge has a corresponding weight based on the weighted collaboration network proposed by Newman [27]: the weight for each edge is discounted by the size of the collaboration, according to the formula
w=pN1
p−1, whereNpis the number of authors of paper
p. For instance, givena,b,c,d ∈ Vyand assuming thata andbwrote a single paper with no other co-author, andb andchave a joint co-authord. Then, the weight of the edge
(a,b)is 1.0, while the weight of the edges(b,c),(c,d), and
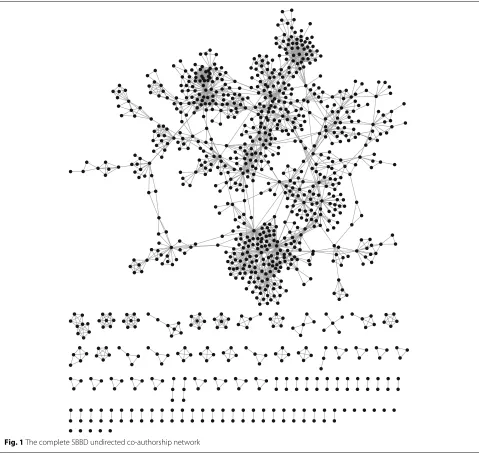
(b,d)is 0.5, as the weights among nodes are calculated by the number of authors for each paper. Figure 1 shows the complete SBBD network as viewed in 2015, representing 30 years of history.
The complete SBBD collaboration network, built from all papers published in its 30 editions, has a total of 1034 authors (vertices) and 2299 collaborations (edges), comprising a total of 674 papers. The largest connected component (LCC) (the largest subgraph in which any pair of nodes is connected by paths) has 781 nodes, repre-senting 75.53% of the whole community. Then, 162 nodes compose smaller components containing three to seven authors. Finally, there are 80 nodes that form pairs of authors, and 11 nodes that correspond to sole authors.
The average number of papers per year is 22.47 (with a standard deviation of 4.86), and the average number of authors per year is 60.53 (with a standard deviation of 17.53). Finally, the average number of papers per author is 1.98 (with a standard deviation of 3.21), while the aver-age number of authors per paper is 3.04 (with a standard deviation of 1.47).
Network metrics
Several metrics characterize and enable to investigate col-laboration networks as the one studied here. This section summarizes the definition and applicability of the metrics used in this work.
The degree of a vertex is the number of its adjacent
edges. Hence, authors who have high number of papers with different co-authors also have high degree. The
degree distributionis the probability distribution of these
degrees over the whole network. The networkdensityis calculated by dividing the number of edges by the number of nodes present in the graph. Theassortativitymeasures the similarity of connections in the graph with respect to the node degree. High coefficient means that authors of high degree tend to connect to authors of high degree (assortative network).
Aconnected componentof an undirected graph is a
sub-graph in which any two vertices are connected to each other by paths. The size of such a component is given by dividing the number of its nodes by the total number of vertices of the graph. Theaverage path length is the average number of steps along the shortest paths for all possible pairs of network nodes. The graphdiameter is the length of the longest shortest path between all pair of vertices.
Betweennessandclosenessregard the centrality of nodes
in the network. The former is equal to the number of shortest paths from all vertices to all others that pass through a given node, whereas the latter measures how close a vertex is to all other vertices in the graph. The
clustering coefficient CC(x) of a vertex x is the ratio
between the number of edges among the neighbor-set ofxand the total possible number. The clustering coef-ficient of the whole network is the average CC(x) over all x. Finally, homophily is the tendency of authors to interact with others with similar features. We refer to Albert and Barabási [1] and Costa et al. [6] for further information and complete definitions of all these network metrics.
Basic statistics
Fig. 1The complete SBBD undirected co-authorship network
20 40 60 80 100
1990 2000 2010
Year
Number of authors
10 20 30
1990 2000 2010
Year
Number of institutions 10
15 20 25 30
1990 2000 2010
Year
Number of papers
(a) (b) (c)
the number of authors has increased over the years, which suggests that SBBD has been attracting the contribution of new authors. The Pearson’s correlation coefficient3 between the number of authors and institutions per year indicates a high correlation (0.75,p value = 1.493e-06). Thus, we can go further and say that, besides attracting the participation of new authors, SBBD is also attracting authors from new institutions, which contributes largely to the symposium scientific strength and reachability.
On the other hand, the sharp decrease in the number of authors and papers at the most recent editions might be due to different reasons. Most of all, if a researcher wants to publish in a conference, there are many options for possible venues of interest. Specifically in Brazil, there are at least two clear examples of other conferences whose topics of interest intersect with SBBD. One is WebMedia, which was initially restricted to multimedia and hyper-media systems (in Portuguese:Simpósio Brasileiro de
Sis-temas Multimídia e Hipermídia) and then evolved to
Multimedia and the Web in 2003. As databases have also evolved to the Web, now, SBBD and WebMedia have com-mon topics of interest such as Semantic Web, Linked Data, and Ontologies. Another is KDMiLe, with its first edition in 2013, specialized in topics related to data mining and knowledge discovery that were mostly covered by SBBD. Nonetheless, we can only speculate, as a true answer could only come from interviewing the authors of papers whose topics are related to SBBD but are published elsewhere.
Figure 3 presents the SBBD network density over the years. The network density is calculated by dividing the number of edges by the number of vertices present in the graph. It achieves its highest value in the first years of the symposium. This can be explained by an unusual paper with 18 authors published in 1989 [34]. After that, as the number of authors increases, the density starts reducing,
1.5 1.8 2.1
1990 2000 2010
Year
Gr
aph density
All papers
Minus paper with 18 authors
Fig. 3Network density over time
but starts growing again from 1996 on. The figure also shows the network density without considering the paper with 18 authors, which in fact represents a collabora-tion pattern outlier. The density presents some oscillacollabora-tion in the first decade, but with a clear increasing tendency later, possibly explained by the arrival of new authors that collaborate with others who are already in the network.
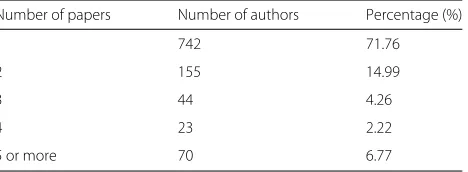
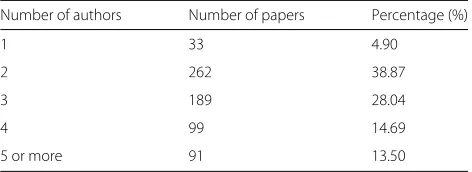
Tables 1 and 2 display the distributions of authors per paper and papers per author. Most SBBD authors (71.76%) have only one paper published throughout the years, and about 28% have two or more papers. Single-paper authors comprise students who most likely published with their supervisors, authors who have published just once, and employees from companies, for instance. Despite the high number of single-paper authors, some of the authors are really engaged (70 authors published five or more papers) and have published consecutively over the years. Currently, the record holder is Marcos André Gonçalves with a streak (uninterrupted period of publishing) of 11 years (2004–2014). He is followed by three authors with streaks of 9 years: Rubens Nascimento Melo (1992–2000), Alberto H. F. Laender (1994–2002), and Caetano Traina Jr. (2003–2011). This distribution shows that only 13.25% of the authors have been continuously responsible for the core publications.
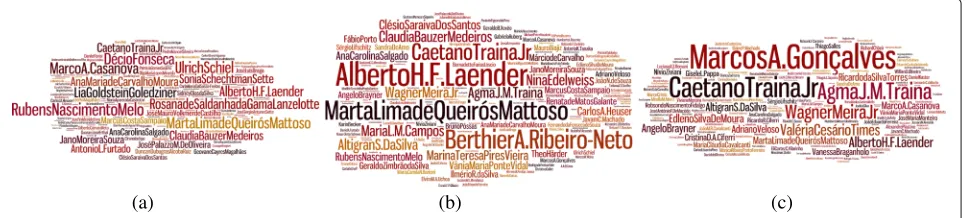
Using the number of publications, Table 3 shows the top 20 authors considering the 30 years of the sympo-sium, which is also illustrated in Fig. 4 by the authors’ name cloud. Then, Fig. 5 illustrates the most engaged SBBD authors by the number of publications separated by decades. Some authors who had a high number of publi-cations during the first years do not have the same partic-ipation in the last years. For example, Rubens Nascimento Melo is one of the founders of the SBBD community who is already retired.
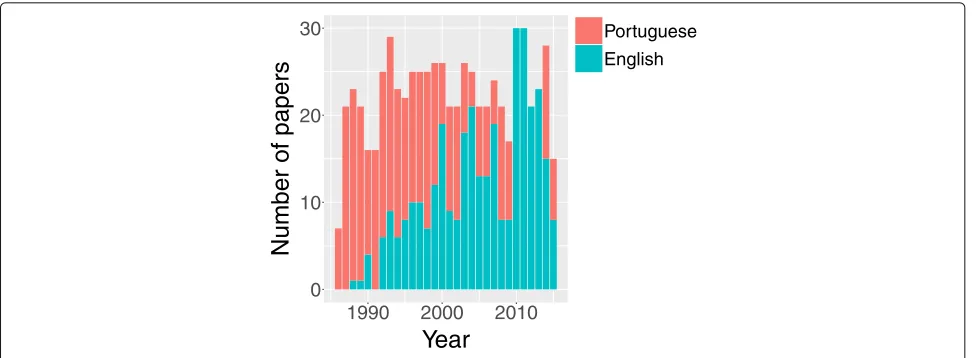
SBBD is a national symposium targeted at the Brazilian database research community. Despite that, more than half of its papers (50.37%) were published in English in its 30-year history. Figure 6 shows the number of papers published in English over the years, compared with the number of papers published in Portuguese. Note that, over the period 2010–2013, all SBBD papers were published in English. This period corresponds to the first 4 years
Table 1Distribution of authors per papers published
Number of papers Number of authors Percentage (%)
1 742 71.76
2 155 14.99
3 44 4.26
4 23 2.22
Table 2Distribution of papers per number of authors
Number of authors Number of papers Percentage (%)
1 33 4.90
2 262 38.87
3 189 28.04
4 99 14.69
5 or more 91 13.50
of JIDM, when all SBBD full papers were submitted in English and the accepted ones published in this journal. This was an important effort of the SBBD community to make its results more internationally visible. With an international Editorial Board and a fast track submission scheme, the JIDM effort produced very good results in terms of the quality of the accepted papers, but consid-erably reduced the number of submissions to SBBD, par-ticularly those by younger authors. Thus, in 2014, SBBD resumed its traditional submission scheme, but including in its technical program all JIDM database-related articles published in the same year.
Regarding the main topics of interest covered by SBBD, the study reported by Kauer and Moreira [14] presents
Table 3Top twenty most prolific SBBD authors ranked by number of papers
Author Number of papers
Caetano Traina Jr. 42
Alberto H. F. Laender 37
Marta L. de Queirós Mattoso 32
Marcos A. Gonçalves 29
Agma J. M. Traina 27
Wagner Meira Jr. 23
Marco A. Casanova 21
Altigran S. da Silva 19
Claudia Bauzer Medeiros 17
Rubens Nascimento Melo 17
Ana Carolina Salgado 16
Berthier A. Ribeiro-Neto 16
Ângelo Brayner 15
Ana Maria de Carvalho Moura 14
Valéria Cesário Times 14
Maria L. M. Campos 13
Ulrich Schiel 13
Adriano Veloso 12
Edleno Silva de Moura 12
Jano Moreira Souza 12
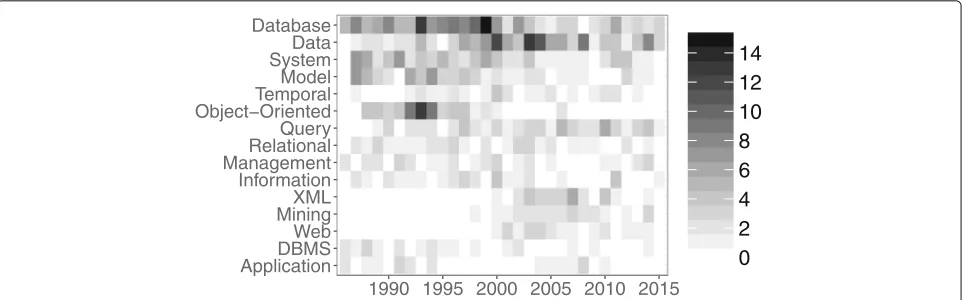
the evolution of research keywords extracted from both title and abstract of SBBD papers in the first 25 edi-tions. For the sake of completeness, we have analyzed the terms present in SBBD paper titles for all 30 edi-tions. Specifically, Fig. 7 illustrates the main words found in the titles of the papers in Portuguese (Fig. 7a) and in English (Fig. 7b). Most words, in both languages, are typical database-related terms, which is expected since SBBD is the official database event of the Brazilian Com-puter Society. In order to further investigate the evolution of these terms and visualize how Brazilian data-related research has evolved over the last 30 years, Fig. 8 high-lights the amount of papers per year associated with 15 of the most frequent words and terms.
Some terms, such as databases and data, received a high number of mentions over all the years. Particularly, database studies usually focus on different aspects of the data life cycle, such as modeling, designing, and
manag-ing spatial,object,distributed, andrelationaldatabases.
The appearance of specific terms such as XML, min-ing, and Web from 2000 onwards corroborates the rise of these topics in Computer Science. Figure 8 also shows that some related terms do not keep high grow-ing rates. For example, the termobject-orientedachieves its highest number of titles in mid 1990s, decreas-ing its importance afterwards most probably because the idea of an object-oriented database was replaced by the more realistic solutions over object-relational systems.
Collaborations and newcomers
In this section, we discuss the SBBD authors’ collaboration networks from two points of view: existing collaborations and newcomers (SBBD first time authors).
Figure 9 shows the values for mean, skewness, and variance of the degree distribution over the years. Both skewness and mean tend to stabilize, with similar behav-ior from 2000 on. Note that, skewness and variance values are significantly large, indicating that some authors pos-sess a high degree. We note that such trends also happen in SBRC [22].
Using Newman’s relation weight scheme, the range of a single collaboration in all editions of SBBD varies from 0.06 to 8.72. The former is due to (again) the unusual paper with 18 authors published in 1989, whereas the lat-ter is product of a long-lat-term collaboration between Agma J. M. Traina and Caetano Traina Jr., who coauthor 26 papers.
Fig. 4Name cloud of SBBD authors
authors who published a single-author paper have pub-lished at least one joint paper after it.
The average degree of the network is 4.45, i.e., on average, an SBBD author collaborates with many distinct coauthors. The degree distribution (Fig. 11) follows a power-law, i.e., there are few authors with high degree (the highest being Marcos A. Gonçalves with 68), and most of the authors have only few collaborations. This is a com-mon feature of many complex networks, closely related to
therich-gets-richereffect [4].
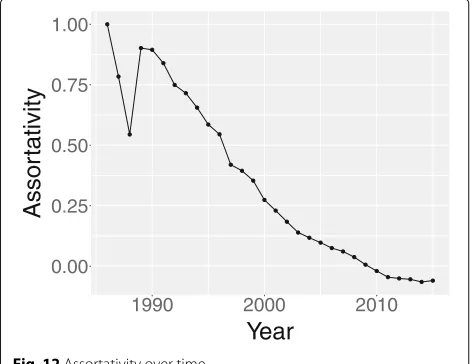
A further investigation into collaborations shows that the SBBD network is non-assortative, with a value close to 0 (-0.06). Figure 12 shows the time evolution of assor-tativity and how predominant this kind of collaboration is becoming. This indicates that nodes with high degree
tend to connect to low degree nodes, i.e., new authors with few collaborations are increasingly tending to connect to authors with higher degree. This kind of behavior is usually observed between students and their supervisors.
We also notice that, at early years, the number of new-comers connected to the largest connected component was close to the number of newcomers connected out-side it, probably because this component was not large enough. Figure 13 shows that SBBD initially received several authors with no link to its largest connected com-ponent, but recently, it has become more common to join the symposium collaborating with someone already connected to it.
An important question is whether a newcomer who joins SBBD as a part of the LCC has more chance of
(a) (b) (c)
0 10 20 30
1990 2000 2010
Year
Number of papers
Portuguese English
Fig. 6Number of papers published in English and in Portuguese over time
reappearing than an author who joins it outside this com-ponent. Table 4 shows the number of newcomers with at least one reappearance in the symposium in the first and in the last 15 years. Most of the authors who have joined the symposium in the first 15 years and reappeared at least once didnotjoin it directly into the LCC (around 81%). However, this has changed in recent years, as authors who have more than one SBBD paper usually contribute to a paper with a well-connected SBBD author first (62.18% of reappearances from 2001 to 2015 are from authors who joined the SBBD community in collaboration with an author already in the LCC). In addition, the Pearson’s correlation coefficient between the number of newcom-ers connected to the LCC and the density of the graph (0.46,pvalue=0.009) indicates a slight positive correla-tion. Such a result suggests that the network is becoming more dense as the number of newcomers connected to the LCC increases. This reinforces the increasing tendency of the density values observed from 2000 onward in Fig. 3.
Analysis of the collaboration groups
We now take a further look into the SBBD collaboration groups by using social network metrics and the k-clique algorithm [30].
Clustering coefficient
The SBBD network has a high global clustering coefficient of 65.6%, indicating dense groups of authors who pub-lish together (PODS, for example, achieved only 35% in its 30th edition in 2011 [2]), indicating that there is a stronger triadic closure effect [12] in SBBD. Even though the num-ber of authors in the network has substantially increased, new authors tend to collaborate with coauthors that main-tain previous collaborations, establishing triangle network motifs. In other words, previous collaborations increase the chance of a pair of authors establishing a collaboration with a newcomer in the network4.
Figure 14 shows the evolution of the average shortest path length and the clustering coefficient of SBBD, as well
(a)
(b)
ApplicationDBMS Web MiningXML Information ManagementRelational Query Object−OrientedTemporal Model SystemData Database
1990 1995 2000 2005 2010 2015
0 2 4 6 8 10 12 14
Fig. 8Evolution of some of the most frequent terms over time, as collected from titles of papers both in Portuguese and English
as their equivalent random networks. A high clustering coefficient (compared to its equivalent random network) and a small average shortest path (as low as its equiva-lent random network) characterize the SBBD network as a small-world network [25]. This phenomenon has long been subject of scientific studies and is typical in social networks [35].
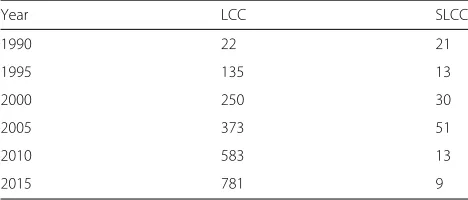
Table 5 shows the size (number of vertices) of the two SBBD largest connected components over the years, and Fig. 15 the evolution of their relative sizes. The LCC for the 30 editions has 2004 edges, with a relative size of 87.17%. It grows with an average of approximately 26 new nodes yearly over the 30 years, 32 over the last 20 years, and 41 over the last 10 years, reaching 75.53% of all nodes in 2015 (13.06% in 1995 and 36.07% in 2005). These val-ues confirm that most of the SBBD authors are connected through a single component, with the second largest con-nected component (SLCC) having only 22 edges, with a relative size of 0.96%. The remaining cases correspond to
0 10 20 30
1990 2000 2010
Year
V
alue
MeanSkewnessVariance
Fig. 9Three moments of the degree values over the years
smaller components and authors who did not collaborate with other authors. There are only 11 cases of sole authors (see Fig. 1), whose papers were published between 1986 and 2003 (see Fig. 10). It is worth noticing that most of such papers are short communications describing projects developed by large technology companies (e.g., Telebrás and Embratel) or present results of their authors’ thesis or dissertation.
Formation of collaboration groups
Decomposing a complex network into groups (sets of highly connected nodes) is very important, as it may help to understand a-priori unknown features and properties of the network. In this section, we focus on discovering and analyzing collaboration groups inside SBBD.
Specifically, we use the k-clique algorithm [30] that relaxes the notion of clique and has shown great success in detecting clusters on a large scale. A collaboration group is then defined as the maximal union of k-cliques that can be
0 1 2 3 4 5
1985 1990 1995 2000
Year
Single author papers
0 50 100 150 200
0 20 40 60
Degree
Number of nodes
Fig. 11Degree frequency
reached from each other by a series of adjacent k-cliques (they are adjacent if they share k-1 nodes). The k-clique algorithm returns a large number of groups inside SBBD, thus showing that collaboration has greatly increased over the years. According to Fig. 16, there are currently 148 (with k=3), 116 (with k=4), and 75 (with k=5) groups formed.
Despite the high number of groups, they do not include many authors. In fact, most of them are really small groups: 51.4% of the 3-cliques have only three authors. The largest 3-clique has 230 nodes and contains the biggest 4-clique inside it (61 nodes). Considering 5-cliques, the number of authors in the largest, second largest, and third largest groups are respectively 18, 12, and 12.
Using the top three groups found by the k-clique algo-rithm with k = 4, which only uses topological features of
0.00 0.25 0.50 0.75 1.00
1990 2000 2010
Year
Assor
tativity
Fig. 12Assortativity over time
0 10 20 30 40
1990 1995 2000 2005 2010 2015
Year
Number of ne
wcomers
LCC
other
Fig. 13Number of newcomers connected to the largest connected component and outside it with at least one reappearance
the graph, there are clusters in which most authors belong to one or at most two distinct institutions, as shown in Table 6. The largest group found is composed by authors from the states of Minas Gerais and Amazonas (due to a longstanding collaboration between Alberto H. F. Laender from UFMG and Altigran S. da Silva from UFAM). On the other hand, the second and third largest groups are mainly composed by authors from the states of São Paulo and Rio de Janeiro, respectively. This indicates that the geograph-ical location and the affiliation of an author is a strong factor to determine which group this author belongs to in the SBBD community.
Influential authors
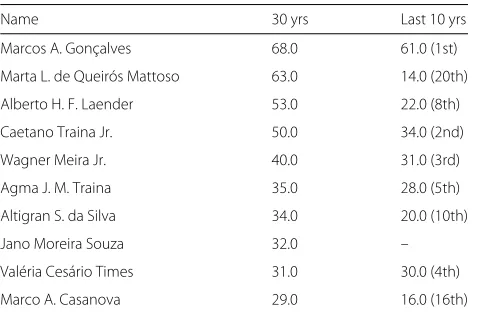
In this section, we analyze the productivity, influence, and impact of SBBD authors. We start by ranking them based on the structural information of the network. Tables 7 and 8 show authors ranked by the number of collabora-tors and Newman’s weight [27]. Even though the rankings differ when considering only the last 10 years, the tables include widely known and prolific authors in the commu-nity. The size of the intersection between these ranks is high, as there are eight authors who appear in both tables. Since prolific authors tend to have a higher number of collaborators, such a correlation between the metrics is expected.
Table 4Number of newcomers connected to the LCC and connected to nodes outside the largest connected component
Period Inside the LCC Outside the LCC
1986–2000 21 90
2 4 6
1990 2000 2010
Year
A
v
er
age Shor
test P
ath
Random
Real
0.0 0.2 0.4 0.6
1990 2000 2010
Year
Cluster
ing Coefficient
Random
Real
(a)
(b)
Fig. 14Comparison to random networks for (a) average shortest path length and (b) clustering coefficient
We can also use centrality metrics to discover whether the location of a node in the social network is strategic or not. Here, we consider both betweenness and closeness [1]. Tables 9 and 10 display the top 10 authors accord-ing to such metrics. The betweenness of a node measures the percentage of all shortest paths in a network that
Table 5Sizes of the largest and second largest connected components over the years
Year LCC SLCC
1990 22 21
1995 135 13
2000 250 30
2005 373 51
2010 583 13
2015 781 9
0.0 0.2 0.4 0.6
1990 2000 2010
Year
Relativ
e siz
e
LCC
SLCC
Fig. 15Relative size of the largest connected component (LCC) and second largest connected component (SLCC)
passes through that node. Hence, the idea is that there is a higher probability of information being disseminated through nodes that lie on more shortest paths than those that do not. On the other hand, closeness measures the inverse of the sum of distances to all other nodes, which allows to estimate how close a node is to all others.
Both tables show prolific and well-known authors in the SBBD community. However, some prolific authors are not listed in any of the two rankings (e.g., Agma J. M. Traina who appears in Tables 7 and 8). Thus, we should evaluate if these metrics are indeed accurate for finding influential authors. For instance, Fernanda Lima has only two publi-cations in SBBD, but she appears in Table 9. An attentive analysis explains such a phenomenon, since both of her publications are joint papers with influential authors in
0 50 100 150
1990 2000 2010
Year
Number of k−clique
3−clique
4−clique
5−clique
Table 6Predominant affiliations of k = 4 groups
Largest group Second largest group Third largest group
Affiliation # Authors Affiliation # Authors Affiliation # Authors
UFMG 39 USP 20 UFRJ 19
UFAM 12 UNICAMP 3
UFOP 3 UFSCar, UFU 2
Other 7 Other 4
Total 61 Total 31 Total 19
the network such as Marta L. de Queirós Mattoso and Rubens Nascimento Melo. For this reason, her overall distance in the network has decreased after collaborat-ing with these two strategically positioned authors. This shows how centrality measures are positively influenced when an author collaborates with other central authors.
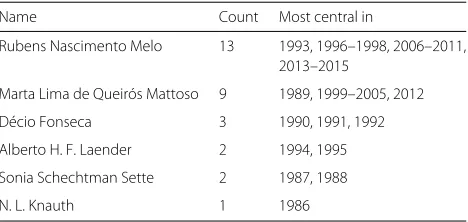
Furthermore, only few authors are key nodes in the network, as shown in Table 11. Although most of these authors maintained a high betweenness centrality coeffi-cient over the years, some of them had their coefficoeffi-cient decreased over time. For instance, in 1997, about 19% of all shortest paths went through Rubens Nacimento Melo, while in 2015 this measure reduced to 14%. Even being retired, he still is in the center of the network for histori-cal reasons and because some of his collaborators are still publishing at SBBD, for example Sergio Lifschitz.
Even though these centrality measures are helpful at finding important nodes, they are not the absolute answer to this question. Specifically, we show that these metrics fail to include some prolific and outstanding authors, and they might also rank authors who have not published for a long time in SBBD (e.g., Décio Fonseca and José Luís Braga).
Therefore, as an effort to capture another facet of the authors’ influence, we list in Table 12 the top SBBD authors ranked according to their h-index5 as collected
Table 7Top ten degree
Name 30 yrs Last 10 yrs
Marcos A. Gonçalves 68.0 61.0 (1st)
Marta L. de Queirós Mattoso 63.0 14.0 (20th)
Alberto H. F. Laender 53.0 22.0 (8th)
Caetano Traina Jr. 50.0 34.0 (2nd)
Wagner Meira Jr. 40.0 31.0 (3rd)
Agma J. M. Traina 35.0 28.0 (5th)
Altigran S. da Silva 34.0 20.0 (10th)
Jano Moreira Souza 32.0 –
Valéria Cesário Times 31.0 30.0 (4th)
Marco A. Casanova 29.0 16.0 (16th)
Table 8Top ten Newman’s weight
Name 30 yrs Last 10 yrs
Caetano Traina Jr. 41.0 22.0 (2nd)
Alberto H. F. Laender 36.0 11.0 (6th)
Marta L. de Queirós Mattoso 32.0 8.0 (13th)
Marcos A. Gonçalves 29.0 26.0 (1st)
Agma J. M. Traina 27.0 18.0 (3rd)
Wagner Meira Jr. 23.0 15.0 (4th)
Marco A. Casanova 21.0 8.0 (10th)
Altigran S. da Silva 19.0 9.0 (9th)
Rubens Nascimento Melo 17.0 –
Ana Carolina Salgado 16.0 4.0 (27th)
from Google Scholar6in June 2017. Notice that for some
authors, the total number of SBBD publications is not proportional to their h-index, which is expected as other publications (besides their SBBD papers) contribute to their h-index value.
Finally, Fig. 17a, b shows the first three moments of the betweenness and closeness distributions, respectively. Regarding the betweenness distribution, high positive val-ues for skewness indicate that SBBD network has a small set of influential nodes. These nodes act as bridges by connecting different parts of the graph, spreading infor-mation and new research trends. On the other hand, for the closeness distribution, skewness values go from pos-itive to negative, indicating that, over time, the network density is growing and its nodes are closer to each other. We highlight that similar results were found on the SBRC collaboration network [22], probably indicating that this behavior could be inherent to this type of network.
Homophily
Homophily is the tendency of people to connect with sim-ilar ones. In this section, we investigate this phenomenon
Table 9Top ten betweenness
Name 30 yrs Last 10 yrs
Rubens Nascimento Melo 0.145 –
Marta L. de Queirós Mattoso 0.140 0.004 (24th)
Alberto H. F. Laender 0.115 0.006 (13th)
Marcos A. Gonçalves 0.092 0.045 (1st)
Fernanda Lima 0.088 –
Marco A. Casanova 0.074 0.004 (19th)
Sérgio Lifschitz 0.069 0.0005 (54th)
Caetano Traina Jr. 0.068 0.015 (4th)
Ana Carolina Salgado 0.062 0.005 (16th)
Table 10Top ten closeness
Name 30 yrs Last 10 yrs
Rubens Nascimento Melo 0.191 –
Alberto H. F. Laender 0.188 0.117 (6th)
Marco A. Casanova 0.183 0.074 (136th)
Marcos A. Gonçalves 0.182 0.159 (1st)
José Luís Braga 0.182 –
José A. F. de Macêdo 0.181 0.082 (111th)
Ana Carolina Salgado 0.178 0.073 (138th)
Sérgio Lifschitz 0.177 0.039 (253rd)
Altigran S. da Silva 0.176 0.121 (64th)
Valéria Cesário Times 0.176 0.096 (2nd)
from the perspective of affiliation. We also overview data regarding gender. Such analyses can shed light on how the surrounding contexts of a network (affiliation and gender of an author in our case) can drive the formation of its links [9].
Table 13 shows the top 10 institutions ranked by the number of affiliated authors who have contributed to a paper presented at SBBD over the years. We can see a high predominance of institutions from the southeast of Brazil followed by some from the northeast, with only two exceptions (UFRGS and UFAM). The number of publi-cations are primarily concentrated into the following five states: Minas Gerais, Rio Grande do Sul, Rio de Janeiro, Pernambuco, and São Paulo. Despite geographical dis-tance, collaborations between regions occur. For insdis-tance, UFMG and UFAM, which are from Southeast and North respectively, have many affiliated authors who publish together in SBBD.
In order to understand how collaborations are influ-enced by similar author characteristics, Fig. 18 shows the homophily of SBBD by affiliation and gender. There is an increasing tendency of connections between different affiliations (e.g., two different universities), resulting in the decrease of the affiliation homophily during the years. Moreover, gender homophily was high in initial years due to the very small percentage of women among the authors
Table 11Most central authors per year
Name Count Most central in
Rubens Nascimento Melo 13 1993, 1996–1998, 2006–2011, 2013–2015
Marta Lima de Queirós Mattoso 9 1989, 1999–2005, 2012
Décio Fonseca 3 1990, 1991, 1992
Alberto H. F. Laender 2 1994, 1995
Sonia Schechtman Sette 2 1987, 1988
N. L. Knauth 1 1986
Table 12h-index and number of publications of the authors who appear in at least one of those top ten ranks: Newman’s weight, betweenness, closeness, and degree
Name h-index # pub.
Marcos A. Gonçalves 39 29
Wagner Meira Jr. 39 23
Alberto H. F. Laender 33 37
Marta L. de Queirós Mattoso 31 32
Agma J. M. Traina 30 27
Altigran S. da Silva 29 19
Caetano Traina Jr. 28 42
Marco A. Casanova 28 21
Ana Carolina Salgado 20 16
Jano Moreira Souza 18 12
José A. F. de Macêdo 17 5
Valéria Cesário Times 16 14
Sérgio Lifschitz 11 10
José Luís Braga 8 6
Fernanda Lima 8 2
Rubens Nascimento Melo na 17
Décio Fonseca na 11
nanot available
(4 of 22 authors in 1986 for example) and has oscillated over the years.
Even though collaborations are getting more diverse in SBBD, there is still a predominance of authors publishing with similar authors in terms of affiliation and gender. As we can see from Fig. 18, these two types of homophily have evolved to 0.625 and 0.658, respectively, indicating that similar characteristics are observed between collaborators more often than dissimilar ones.
Finally, Fig. 19 shows the distribution of authors’ gen-der by each year, in which the female distribution has oscillated between 16.44 and 38.46%. However, it is worth noticing that, with few exceptions (1986, 1996, 1997, 2003, 2008, 2012, and 2013), the female collaboration over the years was above 25%.
Conclusions
0 2 4 6
1990 2000 2010
Year
V
alue MeanSkewness
Variance
−1.0 −0.5 0.0 0.5 1.0 1.5
1990 2000 2010
Year
V
alue
Mean Skewness Variance
(a) (b)
Fig. 17Three moments of the (a) betweenness and (b) closeness values
the most engaged SBBD authors, the number of distinct authors, institutions, and published papers, and the evo-lution of some of the most frequent terms presented in the titles of the papers. Finally, we discussed the produc-tivity, influence, and impact of SBBD authors given by centrality measures and showed that the SBBD network follows a phenomenon typical in social networks known as small-world.
Among our main findings, we provide evidence that the SBBD community is becoming more collaborative over the years. Moreover, the increasing number of newcomers is followed by an increasing number of new institutions, which contribute to the symposium scientific strength and reachability. In spite of some authors being really engaged and publishing consecutively for several years, only few authors are key nodes in the network and have
Table 13Top-10 institutions considering the number of distinct authors
University # Authors Region
UFMG Universidade Federal 61 Southeast de Minas Gerais
UFRGS Universidade Federal 54 South do Rio Grande do Sul
UFRJ Universidade Federal 51 Southeast do Rio de Janeiro
UFPE Universidade Federal 37 Northeast de Pernambuco
PUCRJ Pontifícia Universidade Católica 35 Southeast do Rio de Janeiro
UNICAMP Universidade Estadual de Campinas 31 Southeast
UFPB Universidade Federal da Paraíba 19 Northeast
IME Instituto Militar de Engenharia 15 Southeast
USP Universidade de São Paulo 15 Southeast
UFAM Universidade Federal do Amazonas 13 North
UFC Universidade Federal do Ceará 12 Northeast
UFSCar Universidade Federal de São Carlos 10 Southeast
been continuously responsible for the core publications. Besides, one common feature of many complex networks, closely related to the rich-gets-richer effect [4], can also be observed in the SBBD community, as most authors have only few collaborations while there are few that correspond to high degree nodes.
Our analysis demonstrates that even though the num-ber of authors increased, new authors tend to publish papers with coauthors that maintain previous collabo-rations, which can be associated with the high number of collaboration groups with few authors found in the network. We showed that geographical location and the affiliation of an author are strong factors to determine which group this author belongs to in the SBBD com-munity, although collaborations between regions such as Southeast and North, for instance, have many affiliated authors who publish together in SBBD. Furthermore, the connection of high degree nodes to low degree ones (usu-ally observed between students and their supervisors) is another factor that leads to collaborations between authors.
0.6 0.7 0.8 0.9
1990 2000 2010
Year
Homophily
Affiliation
Gender
0.00 0.25 0.50 0.75 1.00
1990 2000 2010
Year
Relativ
e Siz
e
Male Female
Fig. 19Authors’s gender distribution over time
Despite the deep analyses of the Brazilian Database community based on its publications, our work could be improved by further studying the geographic location of the collaborations. It would also be interesting to consider analyses based on the collaboration network of mem-bers of SBBD program committees, equally studying the existing members and appearance of newcomers through the years. Finally, we could also investigate how SBBD researchers contribute to other communities, similar to the broader study of Silva et al. [32].
Endnotes
1BDBComp: http://www.lbd.dcc.ufmg.br/bdbcomp 2JIDM: https://seer.ufmg.br/index.php/jidm/index 3Pearson’s correlation coefficient provides a measure
of the strength of a linear association between two variables [17].
4A similar case of the “friend of my friend is also my
friend” phenomenon found in social networks [28].
5The h-index [13] of an author is the highest number of
her publications with at least that many citations, e.g., an author with 10 papers with at least 10 citations each has h-index of 10.
6Google Scholar: https://scholar.google.com.br
Abbreviations
CS: Computer Science; CSBC: Congress of the Brazilian Computer Society; JIDM: Journal of Information and Data Management; KDMiLe: Symposium on Knowledge Discovery, Mining, and Learning; LCC: Largest connected component; PODS: Symposium on Principles of Database Systems; SBBD: Brazilian Symposium on Databases; SBC: Brazilian Computer Society; SBRC: Brazilian Symposium on Computer Networks and Distributed Systems; SLCC: Second largest connected component; SNA: Social networks analysis; WebMedia: Brazilian Symposium on Multimedia and the Web
Funding
The research was partially funded by CNPq, PRPq/UFMG, and FAPEMIG - Brazil.
Authors’ contributions
Professors MM and AP designed the social study; students LMdA and GP performed data collection and basic statistics; GP also defined the analyses of influential authors and homophily; LH was in charge of all other metrics; all authors contributed differently in writing the paper; specially, professors AHF and JP were fundamental for analyzing the SBBD evolution. All authors read and approved the final manuscript.
Competing interests
The authors declare that they have no competing interests.
Publisher’s Note
Springer Nature remains neutral with regard to jurisdictional claims in published maps and institutional affiliations.
Author details
1Universidade Federal de Minas Gerais, Belo Horizonte, Brazil.2Universidade
Federal do Rio Grande do Sul, Porto Alegre, Brazil.
Received: 7 March 2017 Accepted: 23 June 2017
References
1. Albert R, Barabási AL (2002) Statistical mechanics of complex networks. Rev Mod Phys 74(1):47
2. Ameloot TJ, Marx M, Martens W, Neven F, Van Wees J (2011) 30 years of PODS in facts and figures. ACM SIGMOD Rec 40(3):54–60
3. Arruda D, de Lima Bezerra F, Neris VA, Toro PRD, Wainer J (2009) Brazilian computer science research: gender and regional distributions. Scientometrics 79(3):651–665
4. Barabási AL, Albert R (1999) Emergence of scaling in random networks. Science 286(5439):509–512
5. Bazzan ALC, Argenta VF (2011) Network of collaboration among PC members of Brazilian computer science conferences. J Braz Comput Soc 17(2):133–139
6. Costa LdF, Rodrigues FA, Travieso G, Villas Boas PR (2007) Characterization of complex networks: a survey of measurements. Adv Phys 56(1):167–242 7. Digiampietri LA, Mena-Chalco JP, Vaz de Melo PO, Malheiro APR, Meira
DN, Franco LF, Oliveira LB (2014) BraX-Ray: an x-ray of the brazilian computer science graduate programs. PLoS ONE 9(4):e94541 8. Duarte A, Júnior MLdM, Souza J, De Brito AV, Trinta FAM, Viana R (2014)
WebMedia XX: who we are and what we have done in the last two decades. In: Kulesza R, Tavares TA (eds). Proceedings of the 20th Brazilian Symposium on Multimedia and the Web, WebMedia 2014, João Pessoa. ACM. pp 91–98. http://doi.acm.org/10.1145/2664551.2664576 9. Easley DA, Kleinberg JM (2010) Networks, crowds, and markets: reasoning
about a highly connected world. Cambridge University Press, New York. http://www.cambridge.org/gb/knowledge/isbn/item2705443/? site_locale=en_GB
10. Freire VP, Figueiredo DR (2011) Ranking in collaboration networks using a group based metric. J Braz Comput Soc 17(4):255–266
11. Gomes JS, da Mota Silveira Neto PA, Cruzes DS, de Almeida ES (2011) 25 years of Software Engineering in Brazil: an analysis of SBES history. In: 25th Brazilian Symposium on Software Engineering, SBES 2011, São Paulo. IEEE Computer Society. pp 4–13. doi:10.1109/SBES.2011.11
12. Granovetter MS (1973) The strength of weak ties. Am J Sociol 78(6):1360–1380
13. Hirsch JE (2005) An index to quantify an individual’s scientific research output. Proc Natl Acad Sci USA 102(46):16569
14. Kauer AU, Moreira VP (2013) Evolução dos Temas de Interesse do SBBD ao Longo dos Anos. In: Fileto R, Cristo M (eds). XXVIII Simpósio Brasileiro de Banco de Dados - Short Papers. SBC, Recife. pp 25:1–25:6. http://www.lbd. dcc.ufmg.br/colecoes/sbbd/2013/0025.pdf
15. Laender AHF, Gonçalves MA, Roberto PA (2004) BDBComp: building a digital library for the Brazilian computer science community. In: Chen H, Wactlar HD, Chen C-C, Lim E-P, Christel MG (eds). ACM/IEEE Joint Conference on Digital Libraries, JCDL 2004. ACM, Tucson. pp 23–24. doi:10.1145/996350.996357
17. Lee Rodgers J, Nicewander WA (1988) Thirteen ways to look at the correlation coefficient. Am Stat 42(1):59–66
18. Lima H, Silva THP, Moro MM, Santos RLT, Meira Jr W, Laender AHF (2013) Aggregating productivity indices for ranking researchers across multiple areas. In: Downie JS, McDonald RH, Cole TW, Sanderson R, Shipman F (eds). 13th ACM/IEEE-CS Joint Conference on Digital Libraries, JCDL ’13. ACM, Indianapolis. pp 97–106. doi:10.1145/2467696.2467715 19. Lima H, Silva THP, Moro MM, Santos RLT, Jr WM, Laender AHF (2015)
Assessing the profile of top Brazilian computer science researchers. Scientometrics 103(3):879–896
20. Liu X, Bollen J, Nelson ML (2005) Co-authorship networks in the digital library research community. Inf Process Manag 41(6):1462–1480 21. Lopes GR, Moro MM, Da Silva R, Barbosa EM, de Oliveira JPM (2011)
Ranking strategy for graduate programs evaluation. In: Proceedings of International Conference on Information Technology and Application. IEEE, Sydney. pp 253–260
22. Maia G, de Melo POV, Guidoni DL, Souza FS, Silva TH, Almeida JM, Loureiro AA (2013) On the analysis of the collaboration network of the brazilian symposium on computer networks and distributed systems. Journal of the Brazilian Computer Society 19(3):361–382
23. Mena-Chalco JP, Digiampietri LA, Lopes FM, Cesar RM (2014) Brazilian bibliometric coauthorship networks. J Assoc Inf Sci Technol 65(7):1424–1445
24. Menezes GV, Ziviani N, Laender AHF, Almeida VAF (2009) A geographical analysis of knowledge production in computer science. In: Quemada J, León G, Maarek YS, Nejdl W (eds). Proceedings of the 18th International Conference on World Wide Web, WWW 2009. ACM, Madrid.
pp 1041–1050. doi:10.1145/1526709.1526849
25. Milgram S (1967) The small world problem. Psychol Today 2(1):60–67 26. Nascimento MA, Sander J, Pound J (2003) Analysis of SIGMOD’s
co-authorship graph. SIGMOD Rec 32(3):8–10
27. Newman ME (2001a) Scientific collaboration networks. II. Shortest paths, weighted networks, and centrality. Phys Rev E 64(1):016,132
28. Newman ME (2001b) The structure of scientific collaboration networks. Proc Natl Acad Sci 98(2):404–409
29. Newman ME (2004) Who is the best connected scientist? A study of scientific coauthorship networks. Lect Notes Phys 650:337–370 30. Palla G, Derényi I, Farkas I, Vicsek T (2005) Uncovering the overlapping
community structure of complex networks in nature and society. Nature 435(7043):814–818
31. Procópio Jr PS, Laender AHF, Moro MM (2011) Análise da Rede de Coautoria do Simpósio Brasileiro de Bancos de Dados. In: de Oliveira JPM (ed). XXVI Simpósio Brasileiro de Banco de Dados - Short Papers. SBC, Florianópolis. pp 131–138. http://www.lbd.dcc.ufmg.br/colecoes/sbbd/ 2011/0020.pdf
32. Silva THP, Rocha LMA, da Silva APC, Moro MM (2015) 3c-index: Research contribution across communities as an influence indicator. J Inf Data Manag 6(3):192–205
33. Smeaton AF, Keogh G, Gurrin C, McDonald K (2003) Analysis of papers from twenty-five years of SIGIR conferences: what have we been doing for the last quarter of a century? SIGIR Forum 37(1):49–53
34. de Souza JM, Monte LCM, Mattoso MLQ, da Rocha ARC, de Aguiar T, D’Ipolitto C, Monat A, Mattoso ALQ, Werner CL, Blum H, Rossatto MA, Gonçalves LCB, Degrazia C, Travassos GH, Gomes CH, Mattoso Jr R, Ribeiro MC, de Araujo L (1989) Sub-projetos em Base de Dados/Objetos/Conhecimento no Âmbito do Projeto TABA. In: Anais do Simpósio Brasileiro de Bancos de Dados. SBC, Campinas. pp 288–291