RESEARCH
The efficacy of oral and subcutaneous
antigen-specific immunotherapy in murine
cow’s milk- and peanut allergy models
Marlotte M. Vonk
1,2†, Laura Wagenaar
3†, Raymond H. H. Pieters
3,4*, Leon M. J. Knippels
1,2,
Linette E. M. Willemsen
1, Joost J. Smit
3, Betty C. A. M. van Esch
1,2and Johan Garssen
1,2Abstract
Background: Antigen-specific immunotherapy (AIT) is a promising therapeutic approach for both cow’s milk allergy
(CMA) and peanut allergy (PNA), but needs optimization in terms of efficacy and safety.
Aim: Compare oral immunotherapy (OIT) and subcutaneous immunotherapy (SCIT) in murine models for CMA and
PNA and determine the dose of allergen needed to effectively modify parameters of allergy.
Methods: Female C3H/HeOuJ mice were sensitized intragastrically (i.g.) to whey or peanut extract with cholera toxin.
Mice were treated orally (5 times/week) or subcutaneously (3 times/week) for three consecutive weeks. Hereafter, the acute allergic skin response, anaphylactic shock symptoms and body temperature were measured upon intrader-mal (i.d.) and intraperitoneal (i.p.) challenge, and mast cell degranulation was measured upon i.g. challenge. Allergen-specific IgE, IgG1 and IgG2a were measured in serum at different time points. Single cell suspensions derived from lymph organs were stimulated with allergen to induce cytokine production and T cell phenotypes were assessed using flow cytometry.
Results: Both OIT and SCIT decreased clinically related signs upon challenge in the CMA and PNA model.
Interest-ingly, a rise in allergen-specific IgE was observed during immunotherapy, hereafter, treated mice were protected against the increase in IgE caused by allergen challenge. Allergen-specific IgG1 and IgG2a increased due to both types of AIT. In the CMA model, SCIT and OIT reduced the percentage of activated Th2 cells and increased the per-centage of activated Th1 cells in the spleen. OIT increased the perper-centage of regulatory T cells (Tregs) and activated Th2 cells in the MLN. Th2 cytokines IL-5, IL-13 and IL-10 were reduced after OIT, but not after SCIT. In the PNA model, no differences were observed in percentages of T cell subsets. SCIT induced Th2 cytokines IL-5 and IL-10, whereas OIT had no effect.
Conclusion: We have shown clinical protection against allergic manifestations after OIT and SCIT in a CMA and
PNA model. Although similar allergen-specific antibody patterns were observed, differences in T cell and cytokine responses were shown. Whether these findings are related to a different mechanism of AIT in CMA and PNA needs to be elucidated.
Keywords: Cow’s milk allergy, Peanut allergy, Immunotherapy, Oral, Subcutaneous, Desensitization, Tolerance
induction
© The Author(s) 2017. This article is distributed under the terms of the Creative Commons Attribution 4.0 International License (http://creativecommons.org/licenses/by/4.0/), which permits unrestricted use, distribution, and reproduction in any medium, provided you give appropriate credit to the original author(s) and the source, provide a link to the Creative Commons license, and indicate if changes were made. The Creative Commons Public Domain Dedication waiver (http://creativecommons.org/ publicdomain/zero/1.0/) applies to the data made available in this article, unless otherwise stated.
Open Access
*Correspondence: r.h.h.pieters@uu.nl
†Marlotte M. Vonk and Laura Wagenaar contributed equally to this work 3 Department of Immunotoxicology, Faculty of Veterinary Medicine, Institute for Risk Assessment Sciences, Utrecht University, PO Box 80177, 3508 TD Utrecht, The Netherlands
Background
Food allergy is an important socio-economic health problem estimated to occur in 10% of pre-school chil-dren (Westernized countries) and 1–2% of adult
indi-viduals (USA) [1, 2]. Two of the major allergenic foods,
peanut- and cow’s milk protein, show different disease patterns. Cow’s milk allergy (CMA) is most prevalent
during early childhood, but is often outgrown [3] while
peanut allergy (PNA) is more persistent and is the most frequent cause of life-threatening allergic reactions in
adults [4]. Unfortunately, current treatment options for
food allergies are limited, being a strict elimination diet and self-administration of epinephrine in case of an anaphylactic response. The need for effective and safe therapeutic options has elicited intensive research into antigen-specific immunotherapy (AIT) as an active toler-ance-inducing strategy.
One form of AIT, subcutaneous immunotherapy (SCIT), is effective and safe in respiratory allergies and
insect venom hypersensitivities [5–7] and has been
rec-ognized as the gold standard immunotherapy method
for decades [8]. However, to date, SCIT has not been
used to treat food allergies due to the high incidence of severe side effects in two conducted peanut allergy trials
[9, 10]. The less invasive alternative, oral
immunother-apy (OIT), has been shown to increase the threshold of food tolerated in a double-blind placebo-controlled food challenge (DBPCFC) in a majority of the subjects in several randomized placebo-controlled clinical
tri-als when on therapy [11]. Nonetheless, OIT for food
allergy is still an experimental therapeutic strategy because of the risk of side effects and accidental symp-toms towards a previously tolerated dose. OIT in cow’s milk- and peanut allergic children was accompanied by
persistent adverse reactions during treatment [12, 13].
In addition, sustained unresponsiveness to a food chal-lenge after discontinuation of OIT has only been
dem-onstrated in a minority of the subjects [14]. This clearly
leaves OIT open for improvement in both therapy safety and efficacy.
Specific immunological aspects have been suggested to be involved in desensitization and the development of clinical tolerance, including a suppressed T helper 2
(Th2) cell response [11] and the induction of regulatory T
cells (Tregs) [15–17], decreased antigen-specific IgE and
increased antigen-specific IgG4 levels [18] and effector
cell unresponsiveness [19] in mice and/or human.
Fur-ther attempts to link immunologic changes induced by AIT to clinical protection have been made using murine models of egg allergy. The induction of long-term toler-ance was unsuccessful, however, significant changes in intestinal gene expression were observed in clinically
protected mice [20, 21]. In humans, clinical tolerance
was associated with hypomethylation of the forkhead box
protein 3 (FoxP3) locus in Tregs [22].
The goal of this study was to compare the efficacy of OIT and SCIT and to determine the dose of allergen needed to effectively modify parameters of allergy in murine CMA and PNA models.
Methods
Mice
All animal procedures were performed according to governmental guidelines and approved by the Ethical Committee of Animal Research of Utrecht University, Utrecht, The Netherlands. Specific-pathogen free 6-week
old female C3H/HeOuJ mice (n = 6–8/group) were
purchased from Charles River Laboratories (L’Arbresle Cedex, France) and were fed a peanut- and cow’s milk protein-free standard mouse chow (AIN-93G soya, Special Diets Services, Witham, UK). The animals were housed at the animal facility of Utrecht University on a 12 h light/dark cycle with unlimited access to food and water.
Reagents
Peanut protein extract (PE) was prepared from raw pea-nuts (provided by Intersnack Nederland BV, The
Neth-erlands) as described previously [23]. Concisely, protein
was extracted from ground peanut by mixing 150 g of ground peanut with 750 ml of 20 mM Tris buffer (pH 7.2). After stirring every 10 min for 2 h at room temperature (RT), the aqueous fraction was collected after
centrifuga-tion (3000×g for 30 min) and subsequently centrifuged
at 10,000×g for 30 min to remove residual traces of fat
and insoluble particles. The extract contained 30 mg/ml protein as determined by Bradford analysis with Bovine Serum Albumin (BSA) as a standard. Whey protein pow-der was provided by Nutricia Research (Utrecht, The Netherlands). Cholera toxin (CT) was purchased from List Biological Laboratories Inc. (Campbell, CA, USA).
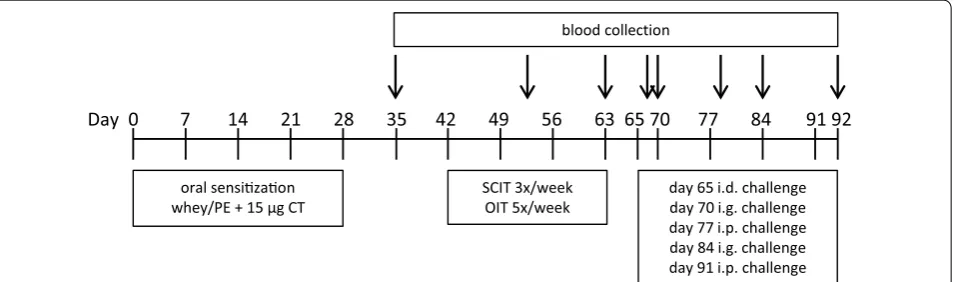
Experimental design: oral sensitization, immunotherapy and challenges
Mice were sensitized intragastrically (i.g.) to whey (20 mg in 0.5 ml PBS) or PE (6 mg in 200 µl PBS) using CT
(15 μg/mouse) as an adjuvant [23, 24] (day 0, 7, 14, 21
and 28 for whey and day 0, 1, 2, 7, 14, 21 and 28 for PE)
(Fig. 1). Sham-sensitized mice received CT in PBS alone.
PBS alone. On day 65, all mice were challenged intra-dermally (i.d.) in both ear pinnae with 10 μg whey or 1 µg PE in 20 μl PBS to determine the acute allergic skin response, anaphylactic shock symptom scores and body temperature levels. On day 70 and 84, i.g. challenges (using 50 mg whey or 15 mg PE in 500 µl PBS) were per-formed to measure mucosal mast cell degranulation in blood samples collected after 30 min. After intraperito-neal (i.p.) challenges on day 77 and 91 (using 100 μg whey or 100 µg PE in 200 µl PBS) anaphylactic shock symp-tom scores and body temperature levels were measured. At day 92, mice were killed with cervical dislocation and blood and organs were collected.
Acute allergic skin response, anaphylaxis symptom score and body temperature after challenge
After AIT, on day 65, all mice were anesthetized using inhalation of isoflurane to measure ear thickness in duplicate prior to and 1 h after an i.d. injection with allergen in both ear pinnae. Basal ear thickness (μm) was subtracted from the ear thickness 1 h post-challenge to determine ear swelling as a measure for the acute aller-gic skin response. Body temperature was measured 30 min after the i.d. challenge using a rectal thermom-eter and signs of anaphylaxis were scored according to
the method described by Li et al. [25]. The
anaphylaxis-associated drop in body temperature reaches a maximum at time point 30 min after i.d. challenge. In addition, body temperature was measured every 10 min after the i.p. challenge on day 77, using a rectal thermometer and ana-phylaxis was scored at time point 40 min after challenge [25].
Levels of mMCP‑1 and allergen‑specific IgE, IgG1, IgG2a in serum
Blood samples were collected at nine specific time points during the animal experiment (day 35, 50, 63, 65, 70, 78, 84, 92) via cheek puncture and after centrifugation
(10,000 rpm for 10 min) sera were stored at −20 °C until
further analysis.
Levels of whey-specific immunoglobulin (Ig) E, IgG1 and IgG2a were determined by means of ELISA as
described previously [24]. Briefly, 96-wells high-binding
plates (Costar 3590, Corning Incorporated, Corning, NY, USA) were coated overnight at 4 °C with 100 μl (20 μg/ ml) whey in coating buffer (carbonate-bicarbonate buffer, 0.05 M, pH 9.6; Sigma-Aldrich Chemicals, Zwijndrecht, The Netherlands). The plates were washed (PBS with 0.05% Tween20) and blocked for 1 h (RT) in ELISA buffer (50 mM TRIS, 137 mM NaCl, 2 mM EDTA and 0.05% Tween20) with 0.5% BSA. Serum samples were diluted and incubated on the plates for 2 h (RT). After washing, 100 μl biotin-labeled rat anti-mouse IgE, IgG1 and IgG2a (1 μg/ml; BD Biosciences, Alphen aan den Rijn, The Netherlands) was incubated for 1.5 h (RT). Subsequently, plates were washed and incubated with streptavidin poly horseradish peroxidase (Sanquin, Amsterdam, The Neth-erlands) for 1 h (RT). After washing, a color reaction was initiated by adding o-phenylendiamine (Sigma). The
reaction was stopped using 4 M H2SO4 and optical
den-sity was measured with a Benchmark microplate reader (BioRad, Hercules, CA, USA) at 490 nm.
PE-specific IgE, IgG1 and IgG2a levels in serum were
detected by ELISA as previously described [23]. Briefly,
for IgG1 and IgG2a, 96-wells high-binding plates (Costar
oral sensizaon whey/PE + 15 μg CT
Day 0 7 14 21 28 35 42 49 56 63 65 70 77 84 91 92 blood collection
SCIT 3x/week
OIT 5x/week day 65 i.d. challengeday 70 i.g. challenge day 77 i.p. challenge day 84 i.g. challenge day 91 i.p. challenge
3590, Corning Incorporated, Corning, NY, USA) were coated overnight at 4 °C with 10 µg/ml PE in PBS fol-lowed by blocking 1 h (RT) with 0.5% BSA-ELISA buffer. Serum samples were diluted and incubated for 2 h (RT). For detection, AP-coupled anti-IgG1 and anti-IgG2a were added for 1 h (RT). Subsequently, 1 mg/ml p-nitro-fenylphosphate in diethanolamine buffer was used for the color reaction, which was stopped with a 10% EDTA solution and absorbance was measured at 405 nm using an Asys expert 96 plate reader (Biochrom, Cambourne, UK).
To measure PE-specific IgE, 96-wells high-binding plates (Costar 3590, Corning Incorporated, Corning, NY, USA) were coated overnight at 4 °C with 1 µg/ml rat anti-mouse IgE (BD Biosciences) followed by blocking for 1 h (RT) with 0.5% BSA-ELISA buffer. Serum samples were diluted and incubated for 2 h (RT). Subsequently, PE-DIG conjugate solution was added for 1 h (RT). The coupling of DIG to PE was performed according to the manufac-turer’s instructions. Briefly, the coupled proteins were separated on a Sephadex G-25 column and labeling effi-ciency was determined by means of spectrophotometry at 280 nm. After incubation for 1 h (RT) with peroxidase-conjugated anti-DIG fragments, a tetramethylbenzidine substrate (0.1 mg/ml) solution was used and the color
reaction was stopped with 2 M H2SO4. Absorbance was
measured at 450 nm. Concentrations of IgE, IgG1 and IgG2a were calculated in arbitrary units (AU) using a standard curve of pooled sera from alum-i.p. whey- or PE-sensitized mice.
Mucosal Mast Cell Protease-1 (mMCP-1) was deter-mined by using a mMCP-1 Sandwich ELISA kit (Mouse
MCPT-1 Ready-SET-Go!® ELISA, eBioscience, Breda,
The Netherlands) according to the manufacturer’s instructions. Levels of mMCP-1 were determined in serum samples obtained 30 min after i.g. challenge.
Analysis of T cell populations using flow cytometry
After collection and homogenization of the spleen (incl. red blood cell lysis) and the mesenteric lymph nodes (MLN; only in the CMA model), single cell suspensions were used to analyze T cell subsets by flow cytometry.
5–10 × 105 cells per well were collected in fluorescence
activated cell sorting (FACS) buffer (PBS containing
0.25% BSA, 0.05% NaN3 and 0.5 mM EDTA) and plated.
The cells were blocked for 20 min using PBS containing 1% BSA and 5% fetal calf serum (FCS) in the CMA exper-iment and Fc block (anti-mouse CD16/32 clone 93, eBio-science) in the PNA experiment. Subsequently, cells were stained with the following antibodies in FACS buffer for 30 min at 4 °C: anti-CD4-PerCpCy5.5 (1:100, clone RM4-5), anti-CD25-AlexaFluor 488 (1:100, clone PC61.RM4-5), anti-FoxP3-APC (1:50, clone FJK-16s), anti-CD69-APC
(1:100, clone H1.2F3), anti-CXCR3-PE (1:50, clone CXCR3-173), anti-CD3e-PerCpCy5.5 (1:100, clone 145-2C11), anti-CD8α-PE (1:100, clone 53-6.7), anti-CD4-FITC (1:200, clone RM4-5), anti-CD25-PE (1:200, clone PC61.5), anti-CD3e-FITC (1:200, clone 145-2C11) from eBioscience, anti-T1/ST2-FITC (1:50, clone DJ8) from mdbioproducts, anti-CD4-FITC (1:100, clone RM4-5), anti-CD4-PerCp (1:200, clone RM4-RM4-5), anti-CD8α-PerCp (1:100, clone 53–6.7), anti-CD4-APC (1:200, clone RM4-5), anti-CD69-PE (1:200, clone H1.2F3) from BD Biosciences. Antibody concentrations were individually titrated beforehand and isotype controls were used. Dead and/or aggregated cells were excluded based on forward/ sideward scatter properties. Cut-off gates for positiv-ity were established using the fluorescence-minus-one (FMO) technique. Cells stained for extracellular markers were fixed using 1% paraformaldehyde and cells stained for intracellular FoxP3-APC were permeabilized and fixed using the buffer set purchased from eBioscience according to the manufacturer’s protocol. Analysis of the CMA samples was performed on the FACS Canto II (BD Biosciences) and Flowlogic software (Inivai Technolo-gies, Mentone, Australia). Analysis of the PNA samples
was performed on the BD Accuri™C6 flow cytometer and
BD sampler software (BD Biosciences).
Cytokine release after ex vivo stimulation with whey or PE
8 × 10⁵ cells per well in 200 μl derived from spleen and
MLN (in CMA model) were cultured in U-bottom cul-ture plates (Greiner, Frickenhausen, Germany) using RPMI 1640 medium (Lonza, Verviers, Belgium) with 10% FCS, penicillin (100 U/ml)/streptomycin (100 μg/ml) (Sigma) and β-mercaptoethanol (CMA model, 20 μM). All cells received either stimulation with culture medium as a negative control, a polyclonal stimulation with anti-CD3 (CMA model; 1 μg/ml, clone 17A2, eBioscience) or anti-CD3/CD28 (PNA model; 1 μg/ml, clone 145-2C11 and clone 37.51, eBioscience) or antigen-specific stimula-tion with whey (50 μg/ml) or PE (100 μg/ml). Plates were incubated for 48 h (anti-CD3 or anti-CD3/CD28) or 96 h (whey or PE) to assess production of interleukin (IL)-5, IL-10, IL-13 and Interferon γ (IFNγ) by T cells. Culture
supernatants were collected and stored at −20 °C until
further analysis with the Ready-SET-Go!® ELISA
(eBio-science) according to the manufacturer’s instructions.
Statistics
The acute allergic skin response, body temperature levels, flow cytometry data, cytokine concentrations and serum mMCP-1 and immunoglobulin levels are depicted as
mean ± SEM and were statistically analyzed with
post hoc test for multiple comparisons to compare the treatment groups with the sensitized control animals within each individual experiment. Body temperature curves were statistically analyzed using a repeated meas-ures two-way ANOVA and Dunnett’s post hoc test for multiple comparisons with matched values. Anaphylaxis symptom scores were analyzed using Kruskal–Wallis test for nonparametric data with Dunn’s post hoc test. Results were considered statistically significant when P < 0.05.
Results
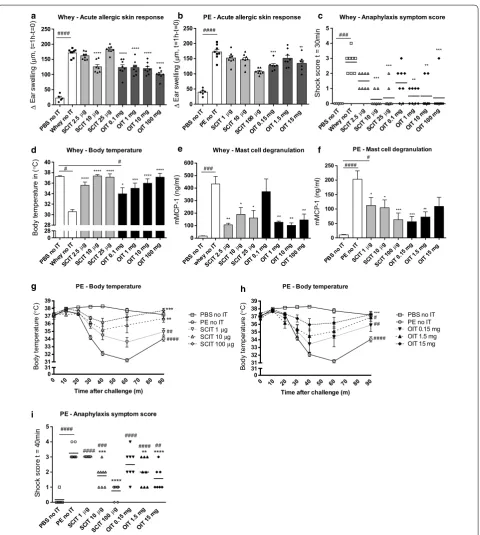
Reduction in allergic manifestations upon challenge with whey or PE in OIT and SCIT mice
The acute allergic skin response, measured as ear swell-ing after i.d. injection with whey or PE, was increased in sensitized mice (whey/PE no IT) compared to
sham-sen-sitized mice (PBS no IT) (Fig. 2a, b). In the CMA model,
SCIT reduced the acute allergic skin response only at a dose of 10 μg, whereas OIT reduced acute allergic skin
responses at all dosages (Fig. 2a). Furthermore, both SCIT
(10, 25 μg) and OIT (1, 10, 100 mg) reduced anaphylactic
shock symptom scores (Fig. 2c). SCIT and OIT prevented
the characteristic drop in body temperature observed during anaphylaxis and this effect appeared to be
dose-related (Fig. 2d). In the PNA model, SCIT (100 μg)
and OIT (0.15, 15 mg) reduced the acute allergic skin
response (Fig. 2b). No anaphylactic response was induced
after i.d. administration of the used PE dosage, therefore no body temperature and anaphylactic shock symptom score data were included. The i.p. challenge performed in PE-sensitized mice on day 77 indicated protection against clinical responses in a dose-related manner after both SCIT and OIT. Both the drop in body temperature
(Fig. 2g, h) and the anaphylactic shock symptom scores
(Fig. 2i) were significantly reduced in all AIT groups. The
i.p. challenge performed in the whey-sensitized mice on day 77 did not show protection against clinical signs, since the used dose of 100 μg induced severe anaphylaxis in all groups (data not shown). In addition, a second i.p. challenge performed on day 91 in both food allergy mod-els did not induce an anaphylactic response in allergen-sensitized control animals (data not shown).
To determine the effect of OIT and SCIT on the local effector response in the gastrointestinal tract, mMCP-1 concentrations were measured in serum collected 30 min
after i.g. challenge (day 70) (Fig. 2e, f). Mast cell
degranu-lation was reduced in all treatment groups in the CMA
model, except OIT with 0.1 mg whey (Fig. 2e). A second
i.g. challenge (day 84) did not induce detectable mMCP-1 levels in serum (data not shown). In PE-sensitized ani-mals, a reduction in mMCP-1 was observed in all SCIT
groups and the 0.15 and 1.5 mg OIT groups (Fig. 2f). The
second i.g. challenge (day 84) showed a similar induction
of mMCP-1 in sensitized animals and this increase was absent in SCIT (100 μg) and OIT (0.15, 15 mg, data not shown). In short, SCIT and OIT induced clinical protec-tion against food challenges in both the CMA and PNA model.
Induction of allergen‑specific IgE upon challenge absent in OIT and SCIT mice
Allergen-specific IgE, IgG1 and IgG2a levels in serum were measured in particular to investigate whether OIT and SCIT modulated the humoral response. During and after AIT (day 50, 63), SCIT increased allergen-specific
IgE levels in the PNA model (Fig. 3b) and in the CMA
model with a dose of 25 μg (Fig. 3a). At day 70, 5 days
after the i.d. challenge, the rise in allergen-specific IgE observed in sensitized control animals compared to sham-sensitized control animals was absent in the OIT
and SCIT mice (Fig. 3a–d). In addition, OIT with 100 mg
whey showed significantly lower whey-specific IgE levels
compared to the whey-sensitized control group (Fig. 3c).
High dose SCIT and OIT induced IgG1 and IgG2a in the
CMA and PNA model (day 63, Fig. 3e–l). The induction
of allergen-specific IgG1 and IgG2a was delayed in sen-sitized control mice; an increase was observed after the i.d. challenge (day 70) and levels appeared to continu-ously rise upon repeated challenges (day 70, 78, 84 and 92). However, allergen-specific IgG1 levels in the SCIT and OIT mice did not further increase after day 70/78
(Fig. 3e–h) despite the challenges. In summary, the data
demonstrate that for both allergens OIT and SCIT pro-tected against a challenge-induced rise in allergen-spe-cific IgE and induced allergen-speallergen-spe-cific IgG1 and IgG2a during immunotherapy.
Shifted T cell profile in lymph organs after OIT and SCIT In the spleen, the percentage of activated Th2 cells (T1/
ST2+ CD69+ of CD4+ cells) was elevated in
whey-sensitized control animals compared to sham-whey-sensitized
control animals (Fig. 4a). OIT (all dosages) and SCIT (10,
25 μg) reduced the percentage of activated Th2 cells. This reduction coincided with an increase in the percentage
of activated Th1 cells (CXCR3+ CD69+ of CD4+ cells)
in the 25 μg SCIT and 10 mg and 100 mg OIT groups
(Fig. 4c) compared to the whey-sensitized control
ani-mals. In contrast to the CMA model, no difference in the percentage of activated Th2 cells was observed in PE-sensitized control animals compared to sham-PE-sensitized
control animals (Fig. 4b). The percentage of activated
Th1 cells was decreased in PE-sensitized mice compared
to sham-sensitized mice (Fig. 4d). In addition, SCIT and
OIT with PE (15 mg) increased the percentage of
acti-vated CD4+ T cells (CD4+ CD69+ of CD3+ cells)
**** **** **** **** **** *** *** ** ** *** **** **** **** * *** **** **** ** * * ** ** ** * * *** ** *** *** ** #### *** **** **** ** ####### #### #### ## 0 50 100 150 200 250 ∆ Ea r sw el ling ( µ m, t= 1h -t=0
) Whey - Acute allergic skin response
PBS n o IT
PE no IT
SCIT 1 µg
SCIT 10µg
SCIT 100 µ
g
OIT 0 .15 m
g
OIT 1 .5 mg
OIT 1 5 mg
0 50 100 150 200 250
PE - Acute allergic skin response
∆ Ea r sw el ling (µ m, t= 1h -t=0 )
PBS n o IT Whey
no IT SCIT
2.5µ g
SCIT 10µg
SCIT 25µg
OIT 0 .1 mg
OIT 1 mg OIT 1
0 mg OIT 10
0 mg
0 1 2 3 4 5 Sh ock sc or e t = 30 mi n
Whey - Anaphylaxis symptom score
PBS n o IT Whey
no IT SCIT
2.5µ g
SCIT 10µg
SCIT 25µg
OIT 0 .1 mg
OIT 1 mg OIT 1
0 mg OIT 1
00 m g PBS n
o IT
Whey no IT
SCIT 2.5µ
g
SCIT 10µg
SCIT 25µg
OIT 0 .1 mg
OIT 1 mg OIT 1
0 mg OIT 1
00 m g 0 28 28 30 32 34 36 38 40 Bo dy te mp er at ur e in (° C)
Whey - Body temperature
PBS n o IT whey
no IT SCIT
2.5µ g
SCIT 10µg
SCIT 25µg
OIT 0. 1 mg
OIT 1 mg OIT 10
mg
OIT 1 00 m
g 0 100 200 300 400 500 600 mMCP -1 (n g/ ml )
Whey - Mast cell degranulation
PBS n o IT
PE no IT SCIT
1 µg SCIT 10µ g SCIT 100 µg
OIT 0 .15 m
g OIT 1
.5 mg OIT 1
5 mg
0 50 100 150 200 250 mM CP -1 (n g/ ml )
PE - Mast cell degranulation
0 10 20 30 40 50 60 70 80 90 0 10 20 30 40 50 60 70 80 90
0 31 31 32 33 34 35 36 37 38 39
PE - Body temperature
Time after challenge (m)
Bo dy te mp er at ur e ( ° C)
PBS no IT PE no IT SCIT 1µg SCIT 10µg SCIT 100µg
0 31 31 32 33 34 35 36 37 38 39
PE - Body temperature
Time after challenge (m)
Bo dy te mp er at ur e (° C)
PBS no IT PE no IT OIT 0.15 mg OIT 1.5 mg OIT 15 mg
PE - Anaphylaxis symptom score
PBS n o IT
PE no IT
SCIT 1 µg
SCIT 10µ
g
SCIT 100 µ
g
OIT 0 .15 m
g
OIT 1 .5 mg
OIT 1 5 mg
0 1 2 3 4 5 Sh ock sc or e t = 40 mi n
a b c
d e f
h i g #### # # *** #### ** ## #### ## # *** ### #### ### # ####
Fig. 2 Allergic manifestations evaluated in whey- or PE-sensitized mice after receiving SCIT and OIT. a, b Acute allergic skin response measured as Δ ear swelling 1 h after i.d. challenge. c Anaphylactic shock symptom scores determined 30 min after i.d. challenge in CMA model. d Body tempera-ture measured 30 min after i.d. challenge in CMA model. e, f Concentrations of mMCP-1 in serum collected 30 min after i.g. challenge. g, h Change in body temperature after i.p. challenge in PNA model. i Anaphylactic shock symptom scores determined 40 min after i.p. challenge in PNA model. Data are represented as mean ± SEM n = 6–8 mice/group. Statistical analysis was performed using one-way ANOVA and Dunnett’s post hoc test for multiple comparisons or a repeated measures two-way ANOVA and Dunnett’s post hoc test for multiple comparisons with matched values for the temperature curve in g–h. #P < 0.05; ##P < 0.01; ###P < 0.001; ####P < 0.0001 compared to sham control. *P < 0.05; **P < 0.01; ***P < 0.001;
In the MLN collected in the CMA model, the
percent-age of CD4+ CD25+ FoxP3+ Tregs was elevated in OIT
mice (1, 10 mg) (Fig. 4i) compared to whey-sensitized
control animals. In addition, an increase in percentage of activated Th2 cells in the 10 mg OIT group was observed.
No effect of OIT and SCIT on the induction of Tregs was found in spleen in either the CMA or the PNA model
(Fig. 4g, h). Briefly, we observed differences in the
per-centages of T cells in the lymph organs of the cow’s milk and peanut allergic mice in response to therapy.
a b c
d e f
g h i
j k l
D35 D50 D63 D66 D70 D78 D84 D92
0 30 60 90 120
PE - IgE SCIT
PE -s pe ci ficI gE (A U* 10
3 ) PBS no ITPE no IT
SCIT 1µg SCIT 10µg SCIT 100µg
a bbb cccc
cccc cccc bbbb bbbb bbc c
b s
s
SCIT
D35 D50 D63 D66 D70 D78 D84 D92
0 20 40 60 wh ey -s pe ci ficI gE (A U* 10
3) PBS no IT
whey no IT OIT 0.1 mg OIT 1 mg OIT 10 mg OIT 100 mg
OIT
Whey - IgE OIT
s
s s d
D35 D50 D63 D66 D70 D78 D84 D92
0 10 20 30 40 50
PE - IgE OIT
PE -s pe ci ficI gE (A U* 10
3) PBS no ITPE no IT
OIT 0.15 mg OIT 1.5 mg OIT 15 mg
s s
OIT
D35 D50 D63 D66 D70 D78 D84 D92
0 20 40 60 80 wh ey -s pe ci ficI gG 1( AU *1 0 6)
PBS no IT whey no IT SCIT 2.5µg SCIT 10µg SCIT 25µg
Whey - IgG1 SCIT
a bbbb cccc b c c sss SCIT
D35 D50 D63 D66 D70 D78 D84 D92
0 10 20 30 40
PE - IgG1 SCIT
PE -s pe ci ficI gG 1( AU *1 0
5) PBS no IT
PE no IT SCIT 1µg SCIT 10µg SCIT 100µg
b c c cccc c bbb cccc ssss SCIT
D35 D50 D63 D66 D70 D78 D84 D92
0 20 40 60 80 wh ey -s pe ci ficI gG 1( AU *1 0 6 )
PBS no IT whey no IT OIT 0.1 mg OIT 1 mg OIT 10 mg OIT 100 mg
Whey - IgG1 OIT
c d cccc d cccc dddd c ddd ddd sss OIT
D35 D50 D63 D66 D70 D78 D84 D92
0 5 10 15 20
PE - IgG1 OIT
PE -s pe ci ficI gG 1( AU *1 0
5 ) PBS no IT
PE no IT OIT 0.15 mg OIT 1.5 mg OIT 15 mg
ccc c c ssss aa bb OIT
D35 D50 D63 D66 D70 D78 D84 D92
0 20 40 60 80 100 120 140 wh ey -s pe ci ficI gG 2a (A U* 10 5)
PBS no IT whey no IT SCIT 2.5µg SCIT 10µg SCIT 25µg
Whey - IgG2a SCIT
c bbb
bb c c c c
SCIT
D35 D50 D63 D66 D70 D78 D84 D92
0 200 400 600 800
PE - IgG2a SCIT
PE -s pe ci ficI gG 2a (A U* 10
4) PBS no IT
PE no IT SCIT 1µg SCIT 10µg SCIT 100µg
b c c
bb
c c c cb s
id ig ip ig ip id ig ip ig ip id ig ip ig ip
id ig ip ig ip id ig ip ig ip
id ig ip ig ip
id ig ip ig ip
id ig ip ig ip id ig ip ig ip
id ig ip ig ip id ig ip ig ip id ig ip ig ip
SCIT
D35 D50 D63 D66 D70 D78 D84 D92
0 20 40 60 80 100 wh ey -s pe ci ficI gG 2a (A U* 10 5)
PBS no IT whey no IT OIT 0.1 mg OIT 1 mg OIT 10 mg OIT 100 mg
Whey - IgG2a OIT
c c
OIT
D35 D50 D63 D66 D70 D78 D84 D92
0 200 400 600
PE - IgG2a OIT
PE -s pe ci ficI gG 2a (A U* 10
4) PBS no IT
PE no IT OIT 0.15 mg OIT 1.5 mg OIT 15 mg
b c bbc
b c
s a
OIT D35 D50 D63 D66 D70 D78 D84 D92
0 20 40 60 80 wh ey -s pe ci ficI gE (A U* 10
3) PBS no IT
whey no IT SCIT 2.5µg SCIT 10µg SCIT 25µg
Whey - IgE SCIT
s ccc
c s s
SCIT
Fig. 3 Allergen-specific IgE, IgG1 and IgG2a levels in serum determined by ELISA. a, b Allergen-specific IgE in SCIT groups. c, d Allergen-specific IgE in OIT groups. e, f Allergen-specific IgG1 in SCIT groups. g, h Allergen-specific IgG1 in OIT groups. i, j Allergen-specific IgG2a in SCIT groups.
k, l Allergen-specific IgG2a in OIT groups. Data are represented as mean ± SEM n = 6–8 mice/group. Statistical analysis was performed on each individual time point using one-way ANOVA and Dunnett’s post hoc test for multiple comparisons. All treatment groups were compared to the sen-sitized control group and significant differences were indicated with letters e.g. aP < 0.05; aaP < 0.01; aaaP < 0.001; aaaaP < 0.0001. In CMA figures: a for
PBS n o IT Whey noIT SCIT 2.5µ g SCIT 10µg
SCIT 25µg
OIT 0 .1mg
OIT 1 mg OIT 1
0mg OIT10 0mg 0 10 20 30 %T 1/ ST 2+ CD 69 +o fC D4
+ T helper 2 cellsWhey - Spleen
#
PBSn o IT
PEno IT
SCIT 1µg
SCIT 10µg
SCIT 100µ
g
OIT0.1 5 mg
OIT 1 .5mg
OIT 1 5 mg
0 2 4 6
PE - Spleen T helper 2 cells
%T 1/ ST 2+ CD 69 +o fC D4 + * # #
PBS n o IT Whey noIT SCIT 2.5µ g SCIT 10µg
SCIT 25µg
OIT 0 .1mg
OIT 1 mg OIT 1
0 mg OIT 1
00mg 0 10 10 15 20 25 30 %C XC R3 +C D6 9+ of CD 4+
Whey - Spleen T helper 1 cells
##
PBSn o IT
PEno IT
SCIT 1µg
SCIT 10µg
SCIT 100µ
g
OIT 0 .15mg
OIT 1 .5mg
OIT 1 5 mg
0 2 4 6 8
PE - Spleen T helper 1 cells
%C XC R3 +C D6 9+ of CD 4+ # ## ## ### ### PBSn o IT
PEno IT
SCIT 1µg
SCIT 10µg
SCIT 100
µg
OIT 0 .15mg
OIT 1 .5mg
OIT 1 5 mg
0 5 10 15
PE - Spleen Active CD4+ cells
%C D4 +C D6 9+ of CD 3+ * *
a b c
d e f
PBS n o IT Whey noIT SCIT 2.5µ g SCIT 10µg
SCIT 25µg
OIT 0 .1mg
OIT1 m g
OIT 1 0 mg OIT 1
00mg 0 9 9 10 11 12 %C D2 5+ Fo xP 3+ of CD 4+
Whey - Spleen Regulatory T cells
PBS n o IT Whey noIT SCIT 2.5µ g SCIT 10µg
SCIT 25µg
OIT 0 .1mg
OIT 1 mg OIT 1
0 mg OIT10
0 mg
0 7 7 8 9 10 %C D2 5+ Fo xP 3+ of CD 4+
Whey - MLN Regulatory T cells
PBS n o IT Whey noIT SCIT 2.5µ g SCIT 10µg
SCIT 25µg
OIT 0 .1mg
OIT1m g
OIT 1 0 mg OIT 1
00mg 0 5 10 15 %C D4 +C D6 9+ of CD 3+
Whey - MLN Active CD4+ cells
PBS n o IT Whey noIT SCIT 2.5µ g SCIT 10µg
SCIT 25µg
OIT 0 .1mg
OIT 1 mg OIT 1
0 mg OIT 1
00mg 0 8 8 10 12 14 16 18 20 %T 1/ ST 2+ CD 69 +o fC D4
+ T helper 2 cellsWhey - MLN
PBS n o IT Whey noIT SCIT 2.5µ g SCIT 10µg
SCIT 25µg
OIT 0 .1mg
OIT 1 mg OIT 1
0 mg OIT10
0 mg
0 10 10 15 20 25 %C XC R3 +C D6 9+ of CD 4+
Whey - MLN T helper 1 cells
k
g h i
j l
PBS n o IT Whey noIT SCIT 2.5µ g SCIT 10µg
SCIT 25µg
OIT 0 .1mg
OIT 1 mg OIT 1
0 mg OIT10
0 mg
0 5 10 15 %C D4 +C D6 9+ of CD 3+
Whey - Spleen Active CD4+ cells
###
PBS n o IT
PEno IT
SCIT 1µg
SCIT 10µg
SCIT 100
µg
OIT 0 .15mg OIT1.5 mg OIT15 mg 0 6 6 8 10
12 Regulatory T cellsPE - Spleen
%C D2 5+ Fo xP 3+ of CD 4+ * **** *** **** **** **** ** * ** *** *** * * ** *** *** *
Fig. 4 Flow cytometric analysis of T cell populations in the spleen and MLN. Cells were gated based on FSC–SSC properties and the Fluorescence-minus-one (FMO) technique. a, b Percentage of activated Th2 cells (T1/ST2+ CD69+ of CD4+) in spleen. c, d Percentage of activated Th1 cells (CXCR3+ CD69+ of CD4+) in spleen. e, f Percentage of activated CD4+ cells (CD4+ CD69+ of CD3+) in spleen. g, h Percentage of Tregs (CD25+ FoxP3+ of CD4+) in spleen. i Percentage of Tregs (CD25+ FoxP3+ of CD4+) in MLN of CMA animals. j Percentage of activated CD4+ cells (CD4+ CD69+ of CD3+) in MLN of CMA animals. k Percentage of activated Th2 cells (T1/ST2+ CD69+ of CD4+) in MLN of CMA animals. l Percentage of activated Th1 cells (CXCR3+ CD69+ of CD4+) in MLN of CMA animals. All data are represented as mean ± SEM n = 6/8 mice/group. Statistical anal-ysis was performed using one-way ANOVA and Dunnett’s post hoc test for multiple comparisons. #P < 0.05; ##P < 0.01; ###P < 0.001; ####P < 0.0001
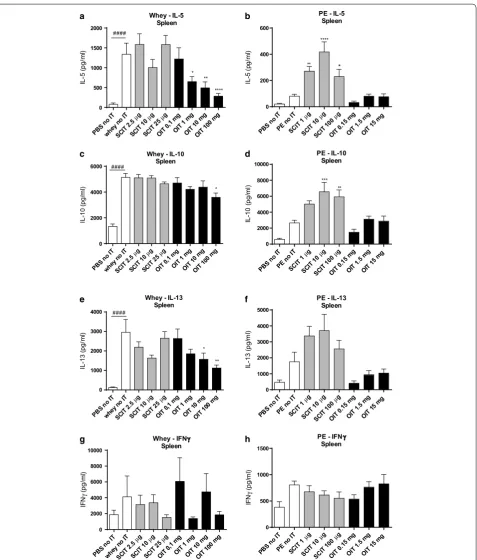
Altered cytokine production after ex vivo stimulation of lymphocytes with whey or PE
Cellular activation was confirmed in the control con-ditions of the ex vivo stimulation assay; a significant increase in IL-5, IL-10, IL-13 and IFNγ production was observed in all groups after polyclonal stimulation of cul-tured cells using anti-CD3 (CMA model) or anti-CD3/ CD28 (PNA model) compared to stimulation with only medium in both food allergy models (data not shown).
Ex vivo stimulation with whey increased the IL-5, IL-10
and IL-13 concentration in supernatants of splenocyte cultures derived from whey-sensitized control animals
(Fig. 5a, c, e). OIT (1, 10 and 100 mg) reduced the release
of IL-5 and IL-13. Except for 100 mg OIT, IL-10 levels remained high in the OIT groups. SCIT did not change cytokine levels. The Th1-related IFNγ release upon
stim-ulation did not differ among the groups (Fig. 5g). In the
PNA model, cytokine production was affected by SCIT
but not by OIT (Fig. 5b, d, f, h). Compared to
PE-sen-sitized control mice, SCIT increased antigen-induced
release of IL-5 at 1 and 10 µg (Fig. 5b) and IL-10 at 10
and 100 µg (Fig. 5d). No change in IL-13 production
was observed in the SCIT groups (Fig. 5f). Again, IFNγ
release upon stimulation did not differ between groups
(Fig. 5h). Overall, SCIT induced an increase (IL-5, IL-10)
in the PNA model, whereas SCIT in the CMA model did not affect cytokine levels. OIT did not affect cytokine production in the PNA model, whereas it reduced Th2-associated cytokine production in the CMA model.
Discussion
We aimed to compare the efficacy of OIT and SCIT in models of PNA and CMA and to determine the dose of allergen needed to effectively modify parameters of allergy. We have shown in both models that OIT and SCIT reduced clinical manifestations of food allergy and resulted in comparable changes in serum levels of aller-gen-specific IgE and IgG subtypes. Differences in T cell populations and cytokine profiles suggest a potential dif-ference in the mechanism of AIT for PNA and CMA.
While both types of immunotherapy were able to decrease allergic manifestations upon challenge, the effective therapeutic dose differed per allergen. OIT using 0.1 mg whey did not decrease signs of anaphylaxis and only mildly prevented the drop in body temperature. The efficacy of OIT was evident in the groups receiving 1 mg whey or higher. In SCIT, 10 μg whey was the most effective dose. In the PNA model, the intermediate and high dosages (1.5, 15 mg OIT and 10, 100 μg SCIT) were the most effective in modulation of disease parameters.
To investigate the effect of OIT and SCIT on mucosal mast cell degranulation, all mice were challenged per oral gavage. Although OIT with 0.1 mg whey was ineffective,
SCIT and OIT effectively reduced mMCP-1 levels in both food allergy models. This finding indicates that regular administration of an allergen dose above a cer-tain threshold influences responsiveness of effector cells along the gastrointestinal tract. This is a known effect of AIT and reflects desensitization. Repeated stimulation of the FcεRI present on basophils during OIT in peanut allergic individuals reduces basophil activation as shown
by down-regulation of the activation marker CD63 [26].
Another possible explanation for the reduced release of mediators by effector cells might be a reduced number of basophils and mast cells in the early phase of
immu-notherapy [19]. In addition, repeated exposure to the
allergen can contribute to exhaustion of effector cells
[27]. In the CMA model, a second i.g. challenge after
2 weeks resulted in a low mMCP-1 concentration in the serum of the whey-sensitized control group. This obser-vation might be associated with the low levels of aller-gen-specific IgE in serum of the whey-sensitized control animals on day 84, while whey-specific IgG2a levels were increased. Such low IgE levels may be insufficient
to re-sensitize mucosal mast cells [28]. In vitro studies
showed that mast cells are able to refill their granules and respond again to an allergen challenge after 24–48 h
[29]. In accordance, PE-specific IgE levels in serum of the
sensitized control animals were not decreased and IgG2a levels were not elevated at day 84 and similar mMCP-1 levels were found upon a second i.g. challenge when compared to the first i.g. challenge. Although protection against i.p. challenge-induced anaphylaxis was shown in OIT and SCIT mice in the PNA model (day 77), a second i.p. challenge did not induce anaphylaxis in allergen-sen-sitized animals (both CMA and PNA model, day 91). We hypothesized that repeated systemic (i.p.) challenges, as conducted in the current models to ensure a detectable Th2 cell-mediated effector response, leads to exhaustion of the effector cells present in the peritoneum and this unintentionally affects allergic outcomes.
In humans, AIT is known to increase antigen-specific IgE in serum. However, if the treatment is prolonged for a period of months or even years, IgE levels tend to
decline [30]. Peanut allergic individuals subjected to OIT
showed an initial increase in IgE, but levels were
stabi-lized despite an oral food challenge [31]. In accordance,
our findings indicate an increase in allergen-specific IgE in mice receiving OIT and SCIT, followed by a return to baseline when immunotherapy was discontinued. Remarkably, IgE levels failed to increase after the allergen challenges in the SCIT and OIT groups. The induction of allergen-specific IgG1 and IgG2a by OIT and SCIT appeared to be dose-dependent. In humans, IgG4 levels are elevated during immunotherapy and are associated
PBSn o IT whey noIT SCIT 2.5µ g SCIT 10µg
SCIT 25µg
OIT 0 ,1mg
OIT 1 mg
OIT 1 0 mg OIT 1
00mg 0 500 1000 1500 2000 IL -5 (p g/ ml )
Whey - IL-5 Spleen ####
PBSn o IT
PEno IT
SCIT 1µg
SCIT 10µg
SCIT 100
µg
OIT0.1 5 mg
OIT 1 .5mg
OIT 1 5 mg 0
200 400 600
PE - IL-5 Spleen IL -5 (p g/ ml ) ** **** PBSn o IT whey noIT SCIT 2.5µ g SCIT 10µg
SCIT 25µg
OIT 0 ,1mg
OIT 1 mg OIT 1
0 mg OIT 1
00mg 0 2000 4000 6000 IL -1 0( pg /m l)
Whey - IL-10 Spleen
####
PBSn o IT
PEno IT
SCIT 1µg
SCIT 10µg
SCIT 100
µg
OIT 0 .15mg OIT1.5 mg OIT15 mg 0 2000 4000 6000 8000 10000
PE - IL-10 Spleen IL -1 0( pg /m
l) *** **
PBSn o IT whey noIT SCIT 2.5µ g SCIT 10µg
SCIT 25µg
OIT0,1 mg
OIT 1 mg OIT10
mg
OIT 1 00mg 0 1000 2000 3000 4000 IL -1 3( pg /m l)
Whey - IL-13 Spleen
####
PBSn o IT
PEno IT
SCIT 1µg
SCIT 10µ g SCIT 100 µg
OIT 0 .15mg
OIT 1 .5mg
OIT 1 5 mg 0 1000 2000 3000 4000 5000
PE - IL-13 Spleen IL -1 3( pg /m l) PBSn o IT whey noIT SCIT 2.5µ g SCIT 10µg
SCIT 25µg
OIT 0 ,1mg
OIT 1 mg
OIT 1 0 mg OIT 1
00mg 0 2000 4000 6000 8000 10000 IF Nγ (p g/ ml )
Whey - IFNγ Spleen
PBSn o IT
PEno IT
SCIT 1µg
SCIT 10µ g SCIT 100 µg
OIT 0 .15mg
OIT 1 .5mg
OIT 1 5 mg 0
500 1000 1500
PE - IFNγ Spleen IF N γ (p g/ ml ) a b c d e f g h * ** **** * * * **
Fig. 5 Cytokine concentrations after ex vivo stimulation of splenocytes with whey or PE determined by ELISA. Splenocytes were cultured for 96 h in the presence of PE, whey or medium (medium data not shown). a, b IL-5 concentration. c, d IL-10 concentration. e, f IL-13 concentration. g, h IFNγ concentration. Data are represented as mean ± SEM n = 6/8 mice/group. Statistical analysis was performed using one-way ANOVA and Dunnett’s post hoc test for multiple comparisons. #P < 0.05; ##P < 0.01; ###P < 0.001; ####P < 0.0001 compared to sham-sensitized control. *P < 0.05; **P < 0.01;
subtypes are proposed to capture the antigen and thereby inhibit binding to IgE present on mast cells and
baso-phils and thus prevent degranulation [19]. The reduced
mMCP-1 release measured after i.g. challenge might be explained by the elevated IgG subtype levels in serum. Furthermore, IgG levels were increased by the challenge protocol, including in the serum of the allergen-sensi-tized control animals. This finding might explain the absence of clinical signs in the follow-up challenges in the CMA model.
The effect of OIT and SCIT on the humoral response can be linked to the percentages of T helper cell subsets in the lymphoid organs in the CMA model, but not in the PNA model. Specific IgE production by plasma cells is sustained by a Th2 cell dominated immune response in
the presence of IL-4, IL-5 and IL-13 [33]. Clinical
protec-tion after OIT in peanut allergic subjects in a randomized controlled study was accompanied by a reduction in IL-5
and IL-13 concentrations [31]. Skewing of the immune
response from a Th2 profile towards a more regulatory profile is associated with a modified cytokine milieu
[34]. The reduced percentage of activated Th2 cells in the
spleen of OIT mice (CMA model) was accompanied by a dose-dependent reduction in the IL-5 and IL-13 concen-tration in stimulated cultures. This observation is con-sistent with the fact that exposure to a high allergen dose
leads to anergy in specific T-cells [35]. On the contrary,
IL-5 and IL-13 production was not decreased in the SCIT groups, although the percentage of activated Th2 cells was decreased in the 10 and 25 μg groups. These findings suggest that the route of antigen administration is impor-tant in the modulation of specific T cell responsiveness during immunotherapy. Th2-associated cytokine IL-4 was not detected in the stimulated cell cultures, as was previously described for the current food allergy model
with the C3H/HeOuJ strain [36]. A similar pattern of IL-5
and IL-13 levels as described for spleen was observed in MLN culture supernatants in the CMA model, indicat-ing a suppressed Th2 responsiveness after OIT but not after SCIT. Nevertheless, a tendency towards an increase in activated Th2 cells was observed in the MLN of the OIT groups, with a significant difference in the OIT 10 mg group. In the PNA model, SCIT increased levels of IL-5 and IL-10 compared to the PE-sensitized control animals, whereas OIT did not have an effect on cytokine production. Earlier studies show that tolerance induction by SCIT is accompanied by a shift from a Th2 cytokine profile towards a Th1 cytokine profile, but there are
dis-crepancies in the literature [37]. The observed differences
in Th2 cytokine production between OIT and SCIT and between the CMA and PNA models might be explained by the induction of antigen-specific Tregs that can exert
a suppressive function towards effector T cells [38, 39].
High dose SCIT and OIT induced a shift in the per-centages of activated splenic Th1 and Th2 cells after the final i.p. challenge in the CMA model but not in the PNA model. The observation in the CMA model is in accord-ance with the hypothesis that oral toleraccord-ance induction is characterized by a shift from a Th2 response towards
a Th1 response [33]. Furthermore, low-dose
induc-tion of tolerance is accompanied by increased
num-bers of CD4+ CD25+ FoxP3+ Tregs [33]. Indeed, this
was observed in the CMA model where OIT (1, 10 mg)
increased the percentage of CD4+ CD25+ FoxP3+
Tregs in the MLN. The fact that no difference in
percent-age of FoxP3+ Tregs was observed in spleen (PNA and
CMA), is contradictory to the results published by
Dio-szeghy et al. [17], who have shown an increase in FoxP3+
Tregs in the spleen of peanut-allergic mice subjected to OIT. This dissimilarity might be explained by the differ-ent mouse strains used in both studies; C3H/HeOuJ and
BALB/c show differences in allergic responses [36]. In
addition, we could not link splenic ex vivo IL-10 levels to the presence of Tregs in both food allergy models. An increase in the IL-10 concentration was found in aller-gen-stimulated cultures derived from lymph organs of allergic mice, indicating the contribution of Th2-derived
IL-10 [40, 41]. Hence, clinical protection observed after
AIT and allergen challenge in both the CMA and PNA models might partially be explained by the induced IgG1 and IgG2a levels in combination with low IgE lev-els. Given the fact that IgG can also drive an alternative
food-induced anaphylaxis pathway [42], the potential
protective effect of IgG1 and IgG2a needs to be con-firmed with a more mechanistic approach.
Despite differences between the CMA and PNA mod-els, overall, the reported clinical, cellular and humoral data can be linked to our current understanding of oral tolerance and immunotherapy mechanisms in humans
[19]. However, future use of both models would require
further investigation of the exact role of immunoregula-tory mechanisms, such as regulaimmunoregula-tory T cells or antibody-mediated protection, and of long term effects of the therapeutic strategies.
Conclusion
(e.g. non-digestible oligosaccharides) as adjunct therapy to support antigen-specific immunotherapy in terms of efficacy and safety.
Abbreviations
AIT: antigen-specific immunotherapy; CMA: cow’s milk allergy; PNA: peanut allergy; OIT: oral immunotherapy; SCIT: subcutaneous immunotherapy; FoxP3: forkhead box protein 3; i.g.: intragastric; PE: peanut extract; CT: cholera toxin; i.d.: intradermal; i.p.: intraperitoneal; Ig: immunoglobulin; Th: T helper; IL: interleukin; DBPCFC: double-blind placebo-controlled food challenge; Treg: regulatory T cell; mMCP-1: murine mast cell protease-1; IFNγ: Interferon γ; MLN: mesenteric lymph nodes; IT: immunotherapy.
Author details
1 Department of Pharmacology, Faculty of Science, Utrecht Institute for Phar-maceutical Sciences, Utrecht University, Utrecht, The Netherlands. 2 Immu-nology Platform, Nutricia Research, Utrecht, The Netherlands. 3 Department of Immunotoxicology, Faculty of Veterinary Medicine, Institute for Risk Assess-ment Sciences, Utrecht University, PO Box 80177, 3508 TD Utrecht, The Nether-lands. 4 Present Address: Yalelaan 104, 3594 CM Utrecht, The Netherlands.
Authors’ contributions
MMV and LW performed the literature search, data collection, analysis and interpretation, created the figures and wrote the manuscript. JJS and BCAMvE. designed the experimental set-up and JJS wrote the animal applications. JJS, BCAMvE, LMJK, RHHP, LEMW and JG contributed to analysis and interpretation of data and manuscript writing.
Acknowledgements
The authors would like to thank M. van Roest, L. Kruijssen, M.W.H.C. Bol-Schoenmakers, M.A.P. Diks, G.M. Dingjan and G.A. Hofman for their technical assistance. All authors are part of the NUTRALL research consortium. This work is supported by a grant from STW, project number 12652.
Competing interests
LM.J.K., B.C.A.M.v.E. and J.G. are partly employed by Nutricia Research, Utrecht, The Netherlands.
Animal ethics approval
All animal procedures were approved by the Ethical Committee of Animal Research of Utrecht University, Utrecht, The Netherlands (registered by DEC2014.III.03.032, studies 104820-1 and 104820-2).
Availability of data and materials
The datasets used and/or analyzed during the current studies are available from the corresponding author on reasonable request.
Consent for publication
Not applicable.
Funding
This research was financially supported by the STW ‘Open Technology Program’ grant and embedded in the NUTRALL consortium project entitled: “Nutrition-based approach to support antigen-specific immunotherapy for food allergies”.
Publisher’s Note
Springer Nature remains neutral with regard to jurisdictional claims in pub-lished maps and institutional affiliations.
Received: 25 November 2016 Accepted: 14 September 2017
References
1. Prescott SL, et al. A global survey of changing patterns of food allergy burden in children. World Allergy Organ J. 2013;6(1):21.
2. Sampson HA. Update on food allergy. J Allergy Clin Immunol. 2004;113(5):805–19 (quiz 820).
3. Ludman S, Shah N, Fox AT. Managing cows’ milk allergy in children. BMJ. 2013;347:f5424.
4. Al-Ahmed N, Alsowaidi S, Vadas P. Peanut allergy: an overview. Allergy Asthma Clin Immunol. 2008;4(4):139–43.
5. Erekosima N, et al. Effectiveness of subcutaneous immunotherapy for allergic rhinoconjunctivitis and asthma: a systematic review. Laryngo-scope. 2014;124(3):616–27.
6. Roberts G, et al. Grass pollen immunotherapy as an effective therapy for childhood seasonal allergic asthma. J Allergy Clin Immunol. 2006;117(2):263–8.
7. Antolin-Amerigo D, et al. Venom immunotherapy: an updated review. Curr Allergy Asthma Rep. 2014;14(7):449.
8. Mondoulet L, et al. Epicutaneous immunotherapy on intact skin using a new delivery system in a murine model of allergy. Clin Exp Allergy. 2010;40(4):659–67.
9. Oppenheimer JJ, et al. Treatment of peanut allergy with rush immuno-therapy. J Allergy Clin Immunol. 1992;90(2):256–62.
10. Nelson HS, et al. Treatment of anaphylactic sensitivity to peanuts by immunotherapy with injections of aqueous peanut extract. J Allergy Clin Immunol. 1997;99(6 Pt 1):744–51.
11. Chiang D, Berin MC. An examination of clinical and immunologic out-comes in food allergen immunotherapy by route of administration. Curr Allergy Asthma Rep. 2015;15(6):536.
12. Vazquez-Ortiz M, et al. Safety and predictors of adverse events during oral immunotherapy for milk allergy: severity of reaction at oral challenge, specific IgE and prick test. Clin Exp Allergy. 2013;43(1):92–102. 13. Virkud YV, et al. Novel baseline predictors of allergic side effects during
peanut oral immunotherapy. J Allergy Clin Immunol. 2017;139(3):882– 888.e5. doi:10.1016/j.jaci.2016.07.030.
14. Berin MC, Mayer L. Can we produce true tolerance in patients with food allergy? J Allergy Clin Immunol. 2013;131(1):14–22.
15. Jones SM, et al. Clinical efficacy and immune regulation with peanut oral immunotherapy. J Allergy Clin Immunol. 2009;124(2):292–300. 16. Cavkaytar O, Akdis CA, Akdis M. Modulation of immune responses
by immunotherapy in allergic diseases. Curr Opin Pharmacol. 2014;17:30–7.
17. Dioszeghy V et al. Differences in phenotype, homing properties and suppressive activities of regulatory T cells induced by epicutaneous, oral or sublingual immunotherapy in mice sensitized to peanut. Cell Mol Immunol. 2017;14(9):770–782. doi:10.1038/cmi.2016.14.
18. Vickery BP, et al. Peanut oral immunotherapy modifies IgE and IgG4 responses to major peanut allergens. J Allergy Clin Immunol. 2013;131(1):128–34.
19. Akdis CA, Akdis M. Mechanisms of allergen-specific immunotherapy and immune tolerance to allergens. World Allergy Organ J. 2015;8(1):17. 20. Leonard SA, et al. Oral immunotherapy induces local protective
mechanisms in the gastrointestinal mucosa. J Allergy Clin Immunol. 2012;129(6):1579–87.
21. Berin C, Wang W. Oral immunotherapy in the sensitized mouse: barriers to tolerance induction. J Allergy Clin Immunol. 2010;125(2):Ab25. 22. Syed A, et al. Peanut oral immunotherapy results in increased
antigen-induced regulatory T-cell function and hypomethylation of forkhead box protein 3 (FOXP3). J Allergy Clin Immunol. 2014;133(2):500–10. 23. van Wijk F, et al. The effect of the food matrix on in vivo immune
responses to purified peanut allergens. Toxicol Sci. 2005;86(2):333–41. 24. Schouten B, et al. Acute allergic skin reactions and intestinal contractility
changes in mice orally sensitized against casein or whey. Int Arch Allergy Immunol. 2008;147(2):125–34.
25. Li XM, et al. A murine model of IgE-mediated cow’s milk hypersensitivity. J Allergy Clin Immunol. 1999;103(2 Pt 1):206–14.
26. Thyagarajan A, et al. Evidence of pathway-specific basophil anergy induced by peanut oral immunotherapy in peanut-allergic children. Clin Exp Allergy. 2012;42(8):1197–205.
27. Jutel M, et al. Influence of bee venom immunotherapy on degranulation and leukotriene generation in human blood basophils. Clin Exp Allergy. 1996;26(10):1112–8.
• We accept pre-submission inquiries
• Our selector tool helps you to find the most relevant journal • We provide round the clock customer support
• Convenient online submission • Thorough peer review
• Inclusion in PubMed and all major indexing services • Maximum visibility for your research
Submit your manuscript at www.biomedcentral.com/submit
Submit your next manuscript to BioMed Central
and we will help you at every step:
29. Xiang Z, et al. IgE-mediated mast cell degranulation and recovery monitored by time-lapse photography. J Allergy Clin Immunol. 2001;108(1):116–21.
30. Van Ree R, et al. Measurement of IgE antibodies against purified grass pollen allergens (Lol p 1, 2, 3 and 5) during immunotherapy. Clin Exp Allergy. 1997;27(1):68–74.
31. Varshney P, et al. A randomized controlled study of peanut oral immuno-therapy: clinical desensitization and modulation of the allergic response. J Allergy Clin Immunol. 2011;127(3):654–60.
32. Burks AW, et al. Oral immunotherapy for treatment of egg allergy in children. N Engl J Med. 2012;367(3):233–43.
33. Rachid R, Umetsu DT. Immunological mechanisms for desensitization and tolerance in food allergy. Semin Immunopathol. 2012;34(5):689–702. 34. Suarez-Fueyo A, et al. Grass tablet sublingual immunotherapy
downregu-lates the TH2 cytokine response followed by regulatory T-cell generation. J Allergy Clin Immunol. 2014;133(1):130–8.
35. Chehade M, Mayer L. Oral tolerance and its relation to food hypersensi-tivities. J Allergy Clin Immunol. 2005;115(1):3–12 (quiz 13).
36. Smit JJ, et al. Contribution of classic and alternative effector pathways in peanut-induced anaphylactic responses. PLoS ONE. 2011;6(12):e28917. 37. Shamji MH, Durham SR. Mechanisms of immunotherapy to aeroallergens.
Clin Exp Allergy. 2011;41(9):1235–46.
38. Berin MC. Pathogenesis of IgE-mediated food allergy. Clin Exp Allergy. 2015;45(10):1483-96. doi:10.1111/cea.12598.
39. Jutel M, et al. IL-10 and TGF-beta cooperate in the regulatory T cell response to mucosal allergens in normal immunity and specific immuno-therapy. Eur J Immunol. 2003;33(5):1205–14.
40. Trinchieri G. Interleukin-10 production by effector T cells: Th1 cells show self control. J Exp Med. 2007;204(2):239–43.
41. Polukort SH, et al. IL-10 enhances IgE-mediated mast cell responses and is essential for the development of experimental food allergy in IL-10-defi-cient mice. J Immunol. 2016;196(12):4865–76.