R E S E A R C H A R T I C L E
Open Access
A quality improvement project to increase
compliance with diabetes measures in an
academic outpatient setting
Subhash Edupuganti
1*, Jordan Bushman
2, Rhyan Maditz
3, Pradeep Kaminoulu
1,2and Alexandra Halalau
1,2Abstract
Background:American Diabetes Association (ADA) sets annual guidelines on preventative measures that aim to delay the onset of severe diabetes mellitus complications. Compared to private internal medicine clinics, resident clinics provide suboptimal diabetic preventative care as evidenced by decreased compliance with ADA guidelines. The purpose of our study is to improve diabetic care in resident clinics through quality improvement (QI) projects, with A1C value as primary outcome and other ADA guidelines as secondary outcomes.
Methods:Our resident clinic at Beaumont Hospital, Royal Oak consists of 76 residents divided in 8 teams. In November 2016, baseline data on ADA guideline measures was obtained on 538 patients with diabetes mellitus. A root cause analysis was conducted. 5 teams developed a QI intervention plan to improve their diabetes care and 3 teams served as comparisons without intervention plans. In November 2017, post-intervention data was collected.
Results:Baseline characteristics demonstrate mean age of intervention groups at 60.9 years and of comparison groups at 58.9 years. The change in A1C value from baseline to post-intervention was + 0.09 vs. + 0.322 in the intervention and comparison groups respectively (p= 0.174). As a group, the changes in secondary outcome measures were as follows: eye examinations (+ 5% in intervention vs. -7% in comparison,p< 0.01), foot examinations (+ 13% vs. + 5%,p= 0.09), lipid panel testing (+ 7% vs. -5%,p< 0.01), micro-albumin/creatinine ratio testing (+ 4% vs. + 1%,p= 0.03), and A1C testing (+8% vs. + 5%,p= 0.24).
Conclusions:While the QI project did not improve A1C value, it did have significant improvement in several secondary outcomes within intervention groups. One resident team implemented an intervention involving protected half-day blocks to identify overdue examinations and consequently had the largest improvements, thus serving as a potential intervention to further study. Given our study results, we believe that QI interventions improve preventative care for patients with diabetes in resident clinics.
Keywords:Quality improvement, Diabetes mellitus, Resident clinic, Diabetes preventative care
Background
Diabetes mellitus is one of the most common chronic diseases in the United States, with a prevalence of an es-timated 30 million people, which accounts for nearly 9.4% of the US population [1]. The number of patients with a diabetes diagnosis continues to rise at a signifi-cant pace, with an incidence rate of 1.5 million US adults per year [1]. While lifestyle modifications and
medications have improved diabetic control, there is still a significant proportion of patients with uncontrolled diabetes leading to advanced complications of the disease. Prolonged uncontrolled diabetes mellitus pro-gresses into a broad range of macrovascular complications such as heart disease and stroke secondary to accelerated atherosclerosis from glucose-induced oxidative stress [2]. Diabetes also causes microvascular complications such as diabetic retinopathy, neuropathy, and nephropathy [2]. Additionally, diabetes is the leading cause of kidney failure and new onset blindness in the United States [3]. Previous studies indicate that for each 1% reduction in hemoglobin
© The Author(s). 2019Open AccessThis article is distributed under the terms of the Creative Commons Attribution 4.0 International License (http://creativecommons.org/licenses/by/4.0/), which permits unrestricted use, distribution, and reproduction in any medium, provided you give appropriate credit to the original author(s) and the source, provide a link to the Creative Commons license, and indicate if changes were made. The Creative Commons Public Domain Dedication waiver (http://creativecommons.org/publicdomain/zero/1.0/) applies to the data made available in this article, unless otherwise stated. * Correspondence:svedupuganti@oakland.edu
1Oakland University William Beaumont School of Medicine, 3601 W 13 Mile
A1c, there was a corresponding 14% reduction in myocardial infarction, 12% reduction in stroke, and a 37% reduction of microvascular complications [4]. Given the multi-organ complications associated with diabetes, it is imperative for physicians to recognize these associated complications and provide appropri-ate preventative care for patients with diabetes to achieve better control of their disease.
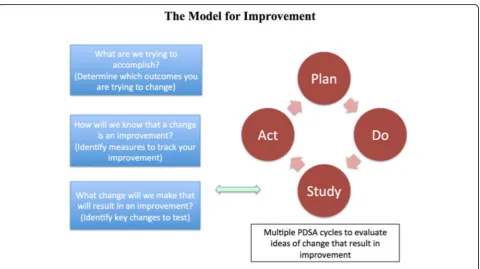
American Diabetes Association (ADA) sets forth annual guidelines on preventative measures that can help prevent or delay the onset of more severe complications of dia-betes mellitus (Fig.1). ADA recommends that physicians monitor HbA1c levels every 3–6 months and set a goal A1C level of under 7% (8.6 mmol/L) for appropriate control of the disease [5]. Additionally, physicians are advised to obtain lipid profiles, urine albumin/creatinine ratio, and estimated glomerular filtration rate (GFR) annually [5]. In order to monitor the retinopathy and peripheral neuropathy associated with diabetes, physicians are also recommended to perform a fundoscopic and comprehensive foot examination at annual visits [5].
As part of internal medicine residency training, med-ical residents are often first-line primary care providers in underserved clinics for those suffering from diabetes mellitus and thus have an important role in providing appropriate care for these patients. However, previous studies describe suboptimal care amongst residents in regards to preventative care in patients with diabetes [6]. One previous study compared diabetes care in resident clinics versus private physicians and found significant decrease in patient satisfaction (56.5% vs. 71.3%) as well as lower completion of diabetic preventative evaluations such as foot (43.3% vs. 69.1%) and eye examinations (43.8% vs. 62.8%) in resident clinics [6]. At our own clinic, prior to the onset of this study, various quality measures for diabetes care were just as suboptimal, with only 41% of the patients with diabetes receiving foot examinations and 32% receiving eye examinations (Fig.2).
The development of quality improvement teaching and active QI projects in the residency curriculum has been increasingly emphasized in recent years. Alliance of American Medical Centers, a national network of large academic medical centers, created a national initiative to develop material for teaching quality improvement in residency curriculums and improving patient care [7]. Additionally, Accreditation Council for Graduate Medical Education (ACGME) published revisions to its common program requirements and included increased emphasis on patient safety and quality improvement as part of residency curriculums [8].
Given the emphasis on quality improvement combined with suboptimal care noted amongst resident clinics with regards to patients with diabetes, our study aims at improving the diabetic care measures in our resident clinic through implementation of quality improvement interventions.
Methods
Setting
Beaumont Hospital-Royal Oak is an academic medical center with the largest outpatient clinic in Southeast Michigan. The clinic has 10,000 patients actively en-rolled from which approximately 10% have a diagnosis of diabetes mellitus. The clinic consists of 60 internal medicine residents and 16 medicine-pediatrics residents in different stages of training, providing a significant variability to the care delivered at the facility. The 76 residents function as primary care physicians and are divided in 8 teams, with each team having an attending physician as a team captain. All of the patients seen by the residents are discussed and separately evaluated and co-managed by the supervising physician. Additionally, the patients’ socioeconomic status can be considered below average with over 50% of the patients obtaining their care via Medicaid insurance. Given this, there is a large no-show rate for patient visits at the resident clinic [9].
Study model
This study utilized the Plan-Do-Study-Act (PDSA) framework outlined by the Institute for Healthcare Improvement (IHI) for improvement processes(Fig.3)[10]. The study enlisted the 76 residents working in 8 different teams at the Beaumont clinic. The project was performed in two stages, the planning stage involving resident education and the intervention stage when the residents enacted an intervention to the care of their patients with diabetes (Fig.4).
Planning stage
In June 2016, the first educational meeting was sched-uled, and the residents were presented information on
the current diabetes outcomes in the clinic. The diabetes data was presented for the entire clinic and compared with the national benchmarks, as seen previously in Fig.2. From June to November 2016, prior to the implementa-tion of individual quality improvement plans, a clinic-wide optimization and standardization of patient flow (Fig. 5) as well as education regarding proper documentation of diabetes maintenance evaluations in the EMR took place (Diabetes template located in additional file1). Addition-ally, two clinic-wide interventions were implemented: 1) the diabetes clinic visit template was standardized based on the ADA diabetes care guidelines and was shared with
all of the residents to be used during their patients’ diabetes visits, and 2) each visit, a half page reminder with the ADA diabetes guideline for laboratory measures and the eye exam had to be filled out by the residents (Sample reminder sheet located in additional file2). The purpose of these clinic-wide interventions was to systematically remind the residents to address these ADA guideline mea-sures at each visit as well as to remind attendings, since the half-page documentation had to be co-signed by a fac-ulty member.
In July 2016, a second meeting took place when the residents were educated on how to design a quality
Fig. 2Diabetes clinic data compared with national average
improvement study (PDSA cycle) and a Fishbone dia-gram (Fig.6) served as the structure to identify ways and areas to implement change. Each of the 8 teams was then advised to develop a quality improvement interven-tion and submit a template of the interveninterven-tion by August 2016.
Intervention stage
The impact of each resident team’s intervention was measured by comparison of the diabetes quality indi-cators pre and post intervention. During the time-frame of the study, the resident teams remained unchanged until July 1st 2017 at which point 3rd year residents graduated from the program and 1st year residents were added to the teams. The senior resi-dents on each team were encouraged to meet with the new interns on their respective teams and inform them regarding their team’s intervention. However, no program-wide quality improvement educational ses-sions were provided for the new interns during this phase of the study period. The patients assigned to a
team at the study onset remained with the same team throughout the study. In the four month period (from July 2016 to November 2016) after the implementa-tion of the two clinic-wide intervenimplementa-tions, each resi-dent rotated at least once in the clinic for a one month block prior to the onset of individual quality improvement interventions.
In November 2016, we performed an EMR query through Business Objects, a software that pulls the data from our EPIC EMR, to identify patients at the resident clinic with known diabetes. On these patients, baseline data was obtained for age, gender, BMI and for each of the quality indicators (listed in Table1) prior to the onset of team-based interventions. For patients with multiple visits to the clinic, we utilized data from the patient’s last visit prior to November 11, 2016. Each resident team was pro-vided its baseline diabetes report. At this time, the teams that designed a quality improvement intervention plan fully implemented their interventions. The key points of each team’s intervention plan are also described (Table2). Individual residents from each team received patient-level
data with their own patients’diabetes ADA guideline mea-sures statistics.
In February 2017, after 3 months of intervention, a meeting with the residents was scheduled to review the observed changes in quality indicators compared to the baseline data. Attendance was voluntary and no attendance data was tracked. Residents were, however, incentivized to attend and participate via free catered lunches during the meetings. The initial phase of the meeting detailed each team’s quality indices data and its
comparison to the baseline report via powerpoint medium and lasted approximately 15 min. Quality indi-cators with significant improvement were acknowledged and areas of deficiency or no improvement were identi-fied. The next phase of the meeting lasted 20–30 min and consisted of each team discussing their implemented plan. Points of discussion included difficulties in imple-menting the plan, compliance with the plan, and ideas to improve the quality indicators, especially those that showed no improvement since the baseline time period.
These meetings were repeated again at 6 months and 9 months from the onset of the intervention (May 2017 and August 2017). By November 2017, the quality improvement interventions were in place for one year and the data on the quality indicators was collected for final data analysis.
Sample size
Sample size for this study was identified via electronic medical record (EMR) query at Beaumont hospital. The query identified all patients assigned to a resident as their primary care provider, as of November 10th 2016. Patients were identified via coding criteria for dia-betes-related diagnoses within the ‘Medical history’ and ‘Problem List’ section in the EMR. After this ini-tial query, patients who were incorrectly labeled as having diabetes, such as those with a diagnosis of pre-diabetes or borderline diabetes mellitus, were identified via individual review of patients’ diagnoses and were removed so only the patients with diabetes mellitus diagnosis were included.
We then excluded patients who were in the query but were never seen in the resident clinic prior to the study period. Patients never seen in the clinic were included in the initial query because they had been seen within the
hospital and had scheduled appointments with the clinic post-hospitalization but never actually visited the clinic. Additionally, patients who did not have at least one visit during the study period were excluded from the study since these patients did not undergo any of the interven-tions. The final sample size for the study was established after these exclusions (Fig. 7). The study also excluded any patients who enrolled in the resident clinic after baseline data was collected.
Variables
The quality indicators that were observed were chosen based on ADA guidelines for key measures to monitor in patients with diabetes. The ADA has pro-vided recommendations on frequency of testing and/ or optimal levels of laboratory values in patients thus providing an opportunity to assess the effectiveness of our interventions within the context of national stan-dards. A1C was chosen as the primary outcome given the significant reduction in complications of diabetes associated with decrease in A1C. Additionally, studies have shown that increase in patient’s perceived con-trol of diabetes and diabetes education have had sig-nificant improvement in A1c outcomes [11, 12]. Given these effects of non-medication variables on A1c, we hypothesized that an increase in preventative examinations in our study would also reflect in an improved A1c level. As one of the secondary out-comes, hemoglobin A1C was also reported as ‘done’ or ‘overdue’ based on the status at the time of data collection. Per ADA recommendations, A1C was con-sidered ‘done’ in two circumstances: if it was per-formed within 3 months when previous A1c was ≥ 7% or if it was performed within 6 months when previous A1c was < 7%. Foot examination, eye examination, microalbumin/creatinine ratio, and lipid panel were
Fig. 6Fishbone diagram to identify opportunities for improvement
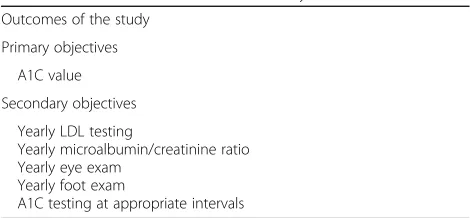
Table 1Outcomes evaluated in the study
Outcomes of the study
Primary objectives
A1C value
Secondary objectives
Yearly LDL testing
Yearly microalbumin/creatinine ratio Yearly eye exam
Yearly foot exam
the remaining secondary outcomes that were also re-ported as ‘done’ or ‘overdue’ based on the status at the time of data collection.
Data collection method
The current study received IRB approval from the Beaumont Research Institute prior to data collection. The data collection was performed in consultation with the Outcomes Research Director at the hospital. An electronic medical record query set as of November 10th 2016 was obtained for the following indicators: A1C value level and status (overdue or up-to-date), LDL sta-tus (overdue or up-to-date), and urine microalbumin to creatinine ratio (overdue or up-to-date). Additionally, we queried all of the patients that were overdue for a foot
exam or an eye exam. Thus, baseline data collected was the last available data prior to November 10th 2016. This query process was repeated with time periods set at February 10th 2017, May 10th 2017, August 10th 2017, and November 10th 2017.
Statistical analysis
Descriptive statistics were reported as frequencies along with proportions for categorical variables. Means (with confidence intervals) were used to describe continuous variables. Fisher’s exact test was used to compare cat-egorical variables. Statistical significance was considered atp< 0.05.
Results
The intervention stage was performed as planned, with scheduled PDSA meetings taking place every 3 months and final data collected in November 2017, one year after the onset of intervention. The three teams that did not submit a quality improvement plan served as comparison groups while the remaining five teams were treated as intervention groups. The outcome data collected at the baseline period was compared to the same outcome data post-intervention period at one year. The change in out-come measures between the two time periods was identi-fied as the effect of the intervention. Baseline characteristics were similar between the intervention and comparison groups (Table 3). The patients’ages on aver-age in intervention and comparison groups were 60.9 years and 58.9 years respectively. 54% of the patients were identified as female in both groups. Average BMI was 35.4 in intervention group and 35.9 in comparison groups.
The primary outcome evaluated in this study was the change in A1C value in intervention and com-parison groups, from before and after the QI inter-vention implementation. Table 4 lists the baseline and post-intervention A1C values for each individual Table 2QI Intervention plans for each team
Team Color
QI Intervention
Purple 1. Protected half-day during clinic month to call and schedule patients with overdue preventative diabetes care. 2. During the visit, obtain all overdue lab work, perform foot exam, and refer for eye exam if due. 3. Provide patients with information on due dates such as next visit, next eye examination, etc.
Red 1. Perform any necessary labs right after the clinic visit. 2. Team will better organize their clinic visits to ensure they know what needs to be addressed at each particular visit.
Green 1. Allow lipid panels to be performed non-fasting if patients are overdue. 2. Provide patient education on logging blood sugars appropriately.
Yellow 1. Call their patients about scheduled appointments 48 h beforehand rather than a week ahead. 2. Remind them to try obtaining their pre-visit labs a day prior to visit. 3. Attempt to input blood sugar logs into EMR to better track the values. 4. Refer more patients to high-risk diabetes clinic.
Blue 1. Patient education on diabetes complications and various weight-loss tracking applications on phones. 2. Remind patients to try obtaining their pre-visit labs a day prior to visit. 3. Make a checklist for residents so they are aware of what needs to be performed during a diabetes visit.
team. As a group, the change in A1C value in the intervention group is + 0.086 versus in the compari-son group, + 0.322. The difference between the inter-vention and comparison group was not statistically significant (p= 0.174).
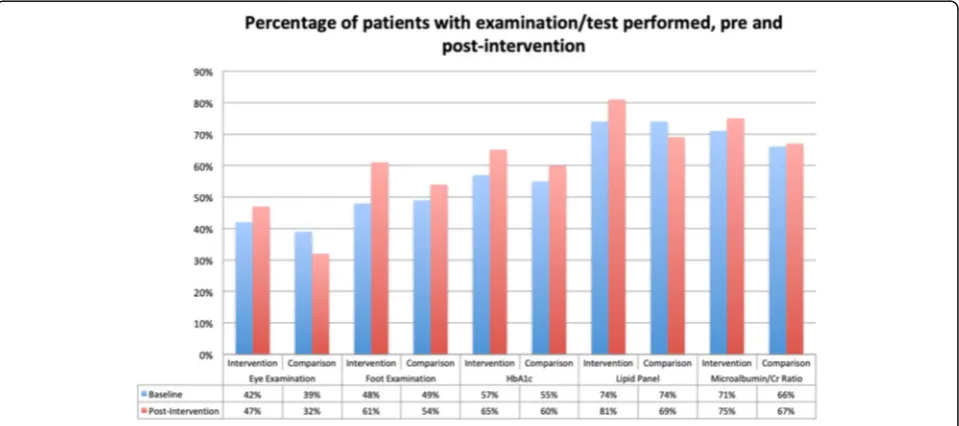
The secondary outcomes evaluated in the study are listed in Table 1 above. The baseline and post-inter-vention data for each individual resident team in the intervention group is listed in Table 5 and presented as a change from baseline in Table 6. As a group, the changes in outcome measures were as follows: eye ex-aminations (+ 5% in intervention vs. -7% in compari-son group, p < 0.01), foot examinations (+ 13% vs. + 5%, p = 0.09), lipid panel (+ 7% vs. -5%, p< 0.01), mi-cro-albumin/creatinine ratio (+ 4% vs. + 1%, p = 0.03), and A1C (+ 8% vs. + 5%, p = 0.24) (listed in Table 7 and Fig. 8). There was a statistically significant im-provement in eye exams performed and lipid panel and micro albumin/creatinine ratio laboratory tests obtained. There was no statistically significant im-provement in foot exams performed or percentage of A1C laboratory tests obtained.
Percentage of patients with examination/test per-formed, pre and post-intervention. B Baseline, PI Post-Intervention.
Discussion
Primary outcome
The primary outcome evaluated in this study, A1C value, did not show a statistically significant difference between intervention and comparison groups. While the lack of improvement in A1C value is paradoxical to what was anticipated at the onset of our study, similar data was seen in other studies published in literature. Specifically, the change in A1C value did not significantly improve if baseline A1C was approximately near 8% (10.2 mmol/L) [13]. Within our own resident clinic, the baseline A1C value for intervention and comparison groups was 7.9% (10.0 mmol/L) and 7.8% (9.8 mmol/L), respectively. Per Lancet’s meta-analysis of quality improvement studies evaluating A1C, this lack of improvement was also demonstrated in settings where the QI intervention involved clinician reminders and auditing, similar to the interventions used in our study.13 Similar findings Table 3Baseline characteristics of each team’s patients
Resident Team Number of Patients Mean Age Gender (% Female) Mean BMI
Blue 76 59.6 61% 34.2
Green 65 61.9 49% 35.6
Purple 62 60.0 58% 35.2
Red 65 63.3 49% 37.5
Yellow 60 59.6 56% 34.5
Gold 62 57.5 56% 36.1
MedPeds 65 61.6 47% 36.5
Orange 83 58.9 60% 35.2
Intervention Groups 328 60.9 54% 35.4
Comparison Groups 210 58.9 54% 35.9
Table 4A1C values at baseline and post-intervention, intervention vs. comparison groups A1C at Baseline A1C at Year 1
Mean A1C (%) 95% CI Mean A1C (%) 95% CI Change in A1C Value 95% CI
Intervention Groups
Blue 7.92 (7.43,8.41) 8.06 (7.49, 8.63) 0.14 (−0.42, 0.70)
Green 7.64 (7.20, 8.09) 7.75 (7.34, 8.16) 0.11 (−0.31, 0.52)
Purple 8.21 (7.57, 8.85) 7.99 (7.40, 8.58) −0.22 (−0.77, 0.34)
Red 8.05 (7.34, 8.75) 8.18 (7.39, 8.98) 0.13 (−0.42, 0.69)
Yellow 7.73 (7.29, 8.17) 8 (7.45, 8.54) 0.27 (−0.21, 0.74)
Comparison Groups
Gold 7.53 (7.13, 7.94) 7.71 (7.25, 8.17) 0.18 (−0.16, 0.51)
Orange 7.96 (7.40, 8.52) 8.27 (7.68, 8.86) 0.31 (−0.08, 0.70)
were observed in previous studies examining the effect of quality improvement interventions on resident clinics alone. For example, in a study investi-gating foot examinations performed in resident clinic, the HbA1c value increased from 7.9% (10.0 mmol/L) to 8.1% (10.3 mmol/L) over the span of the QI inter-vention [14]. Additionally, another study performed at an internal medicine resident clinic also demonstrated a lack of decrease in A1C, irrespective of intervention or comparison group [15].
There may be several underlying reasons for the lack of improvement in A1C values. For one, the residents were unaware that A1C value was the primary outcome in our study. This was implemented to avoid bias by steering the residents away from focusing solely on the primary outcome. If our study was developed with a sin-gular focus on A1C improvement, the results may have demonstrated improved A1C values. Another reason specific to our study is that the quality improvement in-terventions that were implemented in our resident clinic did not directly involve activities that decrease A1C. The interventions incorporated were primarily targeted at ex-aminations or laboratory tests that should be performed by the clinician in the clinic, rather than patient inter-ventions. We hypothesized that the preventative exami-nations may still indirectly affect A1c value but our study did not demonstrate that correlation. A possible cause for this lack of improvement is time utilization during a visit. For example, a resident who is focused on performing a foot examination may not have spent the necessary amount of time counseling on diet or medica-tion regimen, thus mitigating the beneficial effect of a foot examination. With limited time during a clinic visit,
the residents’ ability to impact both glycemic control and provide appropriate preventative care may be de-creased. These results demonstrate the importance of such comprehensive diabetes care in patients with dia-betes and the definite need in this patient population for parallel diabetes diet education, pharmacist education and intensive lifestyle changes [16,17].
Secondary outcomes
While foot examination and A1C test did not show a statistically significant improvement with the quality improvement intervention, each secondary outcome demonstrated an absolute increase in the percentage of patients who received those tests 1 year after the inter-ventions were implemented. Compared to the national data as shown earlier in Fig. 2, the adherence rates in the clinic are still lagging behind, however there were significant improvements from the pilot study data. Spe-cifically, the national adherence rate of foot and eye ex-aminations are 68 and 62% respectively. In our clinic’s intervention groups, these two adherence rates improved from 48 to 61% in foot examinations performed and 42 to 47% in eye examinations performed. Similarly, with A1C testing, the intervention group improved from 57 to 65%, similar to the national rate of 68%. While these QI interventions have not completely eliminated the gap between our clinic and the national averages, the signifi-cant improvements in these rates indicate the QI inter-ventions as potential solutions to the low adherence rates. Considering the given trend, we hope that there is further improvement in adherence rates with continued use of QI interventions.
Table 5Secondary outcomes, by each resident team in intervention group (Bbaseline,PIpost-intervention)
Secondary Outcome
Blue Green Purple Red Yellow Comparison
Group
B PI B PI B PI B PI B PI B PI
Foot examination 46% 58% 59% 62% 46% 78% 57% 59% 32% 51% 44% 43%
Eye examination 39% 34% 46% 51% 42% 57% 40% 52% 41% 41% 39% 32%
Lipid panel 75% 79% 70% 76% 71% 83% 76% 88% 78% 78% 74% 69%
A1C 59% 62% 54% 57% 58% 75% 52% 69% 59% 64% 55% 60%
Microalbumin/Cr ratio 68% 75% 71% 68% 71% 78% 71% 81% 73% 76% 66% 67%
Table 6Secondary outcomes, change from baseline in each intervention group (bolded = largest positive change in intervention groups)
Secondary outcome Blue Green Purple Red Yellow Comparison group
Foot examination + 12% + 3% + 32% + 2% + 19% + 5%
Eye examination −5% + 5% + 15% + 12% 0% −7%
Lipid panel + 4% + 6% + 12% + 12% 0% −5%
A1C + 3% + 3% + 17% + 17% + 5% + 5%
Comparing with present literature, there were limited studies evaluating the secondary outcomes from our study. One previous project evaluating foot examinations showed similar improvements in the number of foot ex-aminations performed post-intervention.14 In another research article, there was significant increase in A1C and LDL testing obtained in intervention versus the comparison groups [15]. While there were few studies reporting on these secondary outcomes, we were unable to identify any projects that showed a lack of improve-ment with a quality improveimprove-ment intervention.
We also compared the difference in the secondary outcomes between the intervention groups. For foot examinations, there was improvement in all
intervention groups compared to baseline. This may reflect the ease of performing a foot exam versus the other preventative examinations. Whereas eye exami-nations by ophthalmologists or laboratory tests ob-tained outside of clinic visit depend partly on the patients, the foot exam can be performed directly in the clinic. Thus, this may have contributed to the ef-fectiveness of the quality improvement study on obtaining more foot examinations in patients. With regards to the eye examinations, three teams (Purple, Red, and Green) had improvements whereas two teams (Yellow and Blue) did not show improvement. Both Yellow and Blue teams identified pre-visit labs as an emphasis of their quality improvement study. Given that eye examinations/referrals are more likely to be performed post-visit, their emphasis on pre-visit testing may have lowered the effect of their QI inter-ventions on eye examination adherence rates.
For laboratory tests such as lipid panel, A1C testing, and microalbumin/creatinine ratio, Red and Purple teams consistently had better improvements than the remaining teams. Both of these teams implemented in-terventions (as listed in Table 2) that involved obtaining overdue labwork right after the clinic visit. This was unique to these two teams as the other three interven-tion teams did not consider this in their interveninterven-tion plans. Given this, there may be increased effectiveness in adhering to ADA guidelines, specifically with regards to laboratory testing, if the testing is performed right after a clinic visit. However, further studies are necessary to evaluate this intervention further.
In our study, Purple team had the largest improvements in all secondary outcomes with the exception of microal-bumin/creatinine ratio (2nd highest improvement in this
Fig. 8Graphical presentation of percentage of patients with examination/test performed, pre and post-intervention Table 7Secondary outcomes, intervention vs. comparison
groups Secondary Outcome
Group B PI Change
from B to PI
P-value
Eye Examination Intervention 42% 47% + 5% < 0.01
Comparison 39% 32% −7%
Foot Examination Intervention 48% 61% + 13% 0.09
Comparison 49% 54% + 5%
A1C Intervention 57% 65% + 8% 0.24
Comparison 55% 60% + 5%
Lipid Panel Intervention 74% 81% + 7% < 0.01
Comparison 74% 69% −5%
Microalbumin/Cr Ratio Intervention 71% 75% + 4% 0.03
Comparison 66% 67% + 1%
outcome). In retrospect, we evaluated the different in-terventions implemented by the resident teams to po-tentially identify the reason for such significant improvement in the Purple team versus the remaining teams. One particular unique intervention by the Pur-ple team consisted of a protected one-half day block for each resident where they identify their patients who are overdue for the required examinations and subsequently call the patients to schedule appoint-ments for these tests. This intervention may have been beneficial because residents were given just one task for the half-day, allowing them to better focus on identifying patients who are due for these exami-nations. The focused half-day may also have helped the residents better understand the ADA guidelines and made them more likely to perform these mea-sures at their patients’ clinic visits. Additionally, per-sonally speaking to the patients over the phone may indirectly have decreased the no-show rate and in-creased the compliance rate due to this inin-creased communication. Given the significant improvements seen with the Purple team, expansion of this interven-tion for the remaining resident teams will be neces-sary to identify if it is a truly beneficial intervention for resident clinics. The significant time commitment associated with this intervention also necessitates fur-ther studies to evaluate whefur-ther ancillary staff can perform this intervention with similar improvements in outcomes.
The consistent improvement in adherence rates amongst comparison groups during this study was an interesting observation. One reason may be the prox-imity of the comparison groups to the intervention groups. Since the residents in the program work so closely together, it may be that strategies from the intervention groups were discussed with those from comparison groups and possibly implemented by indi-vidual residents. Another cause may be that compari-son groups also were able to attend the discussion sessions every 3 months that evaluated the progress of QI interventions. During this time, these groups may have discussed strategies to improve their adherence rates but did not write down an official intervention strategy.
Regardless, the significant improvement in adher-ence rates in several secondary outcomes amongst intervention groups, especially Purple and Red teams, demonstrates that certain quality improvement inter-ventions in resident clinic can be beneficial in better adhering to the ADA guidelines. The implementation of a quality improvement intervention not only allows for better preventative care in patients with diabetes in the resident clinics but also helps residents under-stand how to implement quality improvement into
daily practice beyond residency and in their own clinics and hospital settings.
Limitations
There are several limitations present in our research study. As mentioned prior, there is a large no-show rate for patient visits at the resident clinic [9]. The no show rate limits opportunities for the residents to provide the preventative care that is expected by the ADA guidelines and may lower the adherence rates compared to the national averages. Additionally, the comparison groups were in the same hospital location as intervention groups, which may have influenced sharing of intervention strategies amongst residents and may limit the pure random allocation of these groups. Furthermore, the comparison groups were not randomly assigned but were made of teams that opted not to design a QI intervention plan. This can be considered a limitation since teams that did not design a plan may consist of residents who are less motivated to engage in improving their quality mea-sures for patients with diabetes.
Another limitation is the underreporting of tests performed. Residents may have performed foot exami-nations but did not report it in the EMR due to lack of time or disruption in the workflow. This could also inaccurately lower the adherence rates in the clinics. Similar phenomenon may have occurred with the la-boratory tests, which could have been deferred if the patient had instead received the laboratory tests at an outside facility. If these facilities were not associated with Beaumont, those laboratory tests are not re-corded in the EMR system, thus falsely lowering the adherence rates.
We also did not collect attendance data on the educational sessions prior to the study period, thus we were unable to evaluate the correlation between attendance at these sessions and the outcome mea-sures. This can be considered a limitation since teams that had more members attend the sessions could have been more motivated to engage in their team’s quality improvement plan and have better outcomes.
Generalization
Beaumont Hospital–Royal Oak is an academic medical center nearby the large metropolitan city of Detroit. Our outpatient clinic has patients from both rural and urban areas of Southeast Michigan. Thus, the results of our study can be expected at other resident clinics in aca-demic medical centers around the country. Additionally, the primary and secondary outcomes of our study were investigated from the national guidelines set by the ADA so we believe that this study can be replicated in other resident clinics and interventions can be implemented in different hospitals to a similar effect.
Conclusions
This project was designed to evaluate the effectiveness of a quality improvement intervention on preventative dia-betes care. While it did not demonstrate an improvement in A1C values, there were significant improvements in the rates of several ADA recommended examinations and la-boratory tests performed by residents in intervention groups. The implementation of a quality improvement project in the resident clinic provides an opportunity to significantly improve the care of patients with diabetes and potentially avoid many of the complications associ-ated with the disease. However, improvement in A1C values may be limited with a focus on singular aspect of diabetes care, such as preventative examinations. Rather, comprehensive care, such as diabetes pharmacy clinics that would tailor education to patient needs, has a signifi-cant role in improving A1C in patients with diabetes.
Additional files
Additional file 1:Structure of diabetes template. This file describes the diabetes template that medical residents utilized in the resident clinic. (DOCX 295 kb)
Additional file 2:Reminder sheet with ADA diabetes guideline measures. This is a reminder sheet utilized by the medical residents in the resident clinic. (DOCX 83 kb)
Abbreviations
ADA:American Diabetes Association; EMR: Electronic medical record; LDL: Low-density lipoprotein; QI: Quality Improvement
Acknowledgements
Thank you Julie George and Shirley Qu for your assistance with the statistics and EMR data retrieval.
Authors’contributions
AH is the principal investigator who helped develop the research question, interpreted data collected from the project, and contributed significantly to the manuscript. RM also helped develop the research question, collected data through the study period, and reviewed the manuscript. PK led the resident discussions that were part of the research project, provided assistance with data collection, and reviewed the manuscript. JB performed data analysis and was a contributor to the manuscript. SE performed data collection, interpreted the data, and contributed significantly to the manuscript. All authors read and approved the final manuscript.
Authors’information
AH is an associate program director for research at Beaumont Hospital Department of Medicine. She is a faculty member in the resident clinic where the research study took place.
Funding
No additional sources of funding were obtained to perform this study.
Availability of data and materials
All pertinent data analyzed during this study are included in this published article. Any further datasets not included in this published article may be obtained from the corresponding author upon request.
Ethics approval and consent to participate
The institutional review board of Beaumont Health System Research Institute has reviewed this protocol and approved it in its current form, including a waiver for consent. IRB Number: 2015–230.
Consent for publication Not Applicable.
Competing interests
The authors declare that they have no competing interests.
Author details
1Oakland University William Beaumont School of Medicine, 3601 W 13 Mile
Rd, Royal Oak, Michigan, Rochester Hills, MI 48073, USA.2Department of
Internal Medicine, William Beaumont Hospital, Royal Oak, MI, USA.
3
Department of Nephrology, Cleveland Clinic Foundation, Cleveland, OH, USA.
Received: 24 January 2019 Accepted: 8 July 2019
References
1. Centers for Disease Control and Prevention. National Diabetes Statistics Report, 2017. Atlanta: Centers for Disease Control and Prevention, U.S. Dept of Health and Human Services; 2017.
2. Fowler MJ. Microvascular and macrovascular complications of diabetes. Clinical Diabetes. 2008;26(2):77–82.https://doi.org/10.2337/diaclin.26.2.77. 3. National Center for Chronic Disease Prevention and Health Promotion
(NCCDPHP). Centers for Disease Control and Prevention.https://www.cdc. gov/diabetes/basics/diabetes.html. Accessed 1 Dec 2018.
4. Stratton IM, Adler AI, Neil HA, et al. Association of glycaemia with macrovascular and microvascular complications of type 2 diabetes (UKPDS 35): prospective observational study. BMJ. 2000;321(7258):405–12. 5. Standards of Medical Care in Diabetes—2018 Abridged for Primary Care
Providers. Clinical Diabetes. August 2017:cd170119. doi:https://doi.org/1 0.2337/cd17-0119.
6. Lynn L, Hess BJ, Weng W, Lipner RS, Holmboe ES. Gaps in quality of diabetes care in internal medicine residency clinics suggest the need for better ambulatory care training. Health Aff. 2012;31(1):150–8.
7. AIAMC National Initiative III: 2011-2013. Improving Patient Care through Medical Education: A National Initiative of Independent Academic Medical Centers.https://www.aiamc.org/ni-iii.html. Accessed 1 Dec 2018. 8. Nasca TJ. Common Program Requirements Section VI Approved. 2017.
Memo regarding approved changes to common program requirements for ACGME.http://www.acgme.org/Portals/0/PDFs/Nasca-Community/ Section-VI-Memo-3-10-17.pdf?ver=2017-03-10-083926-603. Accessed 1 Dec 2018.
9. Ali-Ahmed F, Halalau A. The impact of personalized telephone reminders on diabetes core measures and no-show rates in a resident clinic; A
crosssectional study. Qual Prim Care. 2016;24(5):231–236.
10. Langley GL, Nolan KM, Nolan TW, et al. The improvement guide: a practical approach to enhancing organizational performance. San Francisco: Jossey-Bass; 1996.
11. Gonzalez JS, Shreck E, Psaros C, Safren SA. Distress and type 2 diabetes-treatment adherence: a mediating role for perceived control. Health Psychol. 2014;34(5): 505–13.
managed care patients with type 2 diabetes. Diabetes Educ. 2013;39(4): 523–31.
13. Tricco AC, Ivers NM, Grimshaw JM, et al. Effectiveness of quality improvement strategies on the management of diabetes: a systematic review and meta-analysis. Lancet. 2012;379(9833):2252–61.https://doi.org/1 0.1016/s0140-6736(12)60480-2.
14. Szpunar SM, Minnick SE, Dako I, Saravolatz LD. Improving foot Examinations in Patients with Diabetes. Diabetes Educ. 2014;40(3):281–9.https://doi.org/1 0.1177/0145721714526789.
15. Thomas KG, Thomas MR, Stroebel RJ, et al. Use of a registry-generated audit, feedback, and patient reminder intervention in an internal medicine resident clinic—a randomized trial. J Gen Intern Med. 2007;22(12):1740–4.
https://doi.org/10.1007/s11606-007-0431-x.
16. Aneese N, Halalau A, Muench S, Shelden D, Fett J, Lauster C. Impact of a Pharmacist-Managed Diabetes Clinic on Quality Measures. Am J Manag Care. 2018;24(4 Spec No.):SP116–SP119.
17. Pousinho S, Morgado M, Falcão A, Alves G. Pharmacist interventions in the management of type 2 diabetes mellitus: a systematic review of randomized controlled trials. J Manag Care Spec Pharm. 2016;22(5):493–515.
Publisher’s Note