S O F T W A R E
Open Access
An open source software for analysis of
dynamic contrast enhanced magnetic
resonance images: UMMPerfusion revisited
Frank G. Zöllner
1*, Markus Daab
1, Steven P. Sourbron
3, Lothar R. Schad
1, Stefan O. Schoenberg
2and Gerald Weisser
2Abstract
Background:Perfusion imaging has become an important image based tool to derive the physiological
information in various applications, like tumor diagnostics and therapy, stroke, (cardio-) vascular diseases, or functional assessment of organs. However, even after 20 years of intense research in this field, perfusion imaging still remains a research tool without a broad clinical usage. One problem is the lack of standardization in technical aspects which have to be considered for successful quantitative evaluation; the second problem is a lack of tools that allow a direct integration into the diagnostic workflow in radiology.
Results:Five compartment models, namely, a one compartment model (1CP), a two compartment exchange
(2CXM), a two compartment uptake model (2CUM), a two compartment filtration model (2FM) and eventually the extended Toft’s model (ETM) were implemented as plugin for the DICOM workstation OsiriX. Moreover, the plugin has a clean graphical user interface and provides means for quality management during the perfusion data analysis. Based on reference test data, the implementation was validated against a reference implementation. No differences were found in the calculated parameters.
Conclusion:We developed open source software to analyse DCE-MRI perfusion data. The software is designed as
plugin for the DICOM Workstation OsiriX. It features a clean GUI and provides a simple workflow for data analysis while it could also be seen as a toolbox providing an implementation of several recent compartment models to be applied in research tasks. Integration into the infrastructure of a radiology department is given via OsiriX. Results can be saved automatically and reports generated automatically during data analysis ensure certain quality control.
Keywords:Open source software, Dce-mri, Data analysis, Compartment models, Workflow
Background
Perfusion imaging has become an important image based tool to derive the physiological information in various applications, like tumor diagnostics and therapy, stroke, (cardio-) vascular diseases, or functional assess-ment of organs [1, 2]. Mostly this technique is applied in magnetic resonance imaging (MRI) [3] but also emerges into the field of computed tomography (CT) [4, 5] and ultrasound (US) [6]. Especially in MRI, this technique benefits of good tissue contrast, that it is noninvasive
and without the application of ionized radiation. A com-mon approach to measure perfusion using MRI is dy-namic contrast enhanced (DCE) MRI, using T1-weighted sequences to record the local signal change due to the contrast agent bolus passing through the ob-served area. By applying so called pharmacodynamic models to the data hemodynamic parameters like the blood flow (or perfusion), blood volume, mean transit time or the extravasation of the contrast agent from the blood stream e.g., into the interstitial space can be calcu-lated. In recent years, added value of DCE-MR perfusion imaging has been reported in various application, e.g., for kidney [7–9], liver [10], or heart disease [11]. In
prostate cancer DCE-MR perfusion imaging has
* Correspondence:frank.zoellner@medma.uni-heidelberg.de
1Computer Assisted Clinical Medicine, Medical Faculty Mannheim, Heidelberg
University, Theodor-Kutzer-Ufer 1-3, 68167 Mannheim, Germany Full list of author information is available at the end of the article
developed as one part of a multi-parametric approach to stage cancer [12, 13]. It is also applied in preclinical functional imaging [14, 15]. However, even after 20 years of intense research in this field, perfusion imaging by DCE-MRI still remains a research tool without a broad clinical usage. One problem is the lack of standardization in technical aspects which have to be considered for successful quantitative evaluation, includ-ing sequence and contrast agent dose optimization [16] model selection [17], correct selection of the arterial in-put function [18, 19], or correction of motion artifacts [20, 21]. Recently, efforts are made to overcome this, e.g., by the Quantitative Imaging Biomarkers Alliance (QIBA) [22] of the Radiological Society of North America (RSNA) or the EIBALL –European Imaging Biomarkers Alliance [23].
The second problem is a lack of tools that allow a dir-ect integration into the diagnostic workflow in radiology. To the best of our knowledge, apart from the work pre-sented herein, there are only few research tools that are also integrated into a DICOM workstation [24, 25] . Re-search tools that allow calculations of hemodynamic pa-rameters are developed often as offline solutions and the clinician has to transfer the large image data sets to a separate workstation for analysis [3, 24–28]. Further-more, to include the results in the clinical workflow they have to be transferred back into the diagnostic system. However, results obtained from most research software are stored in various formats that could not easily be converted to DICOM objects to be stored in picture archive and communication systems (PACS) [24]. Cer-tainly, the aforementioned procedure is feasible in the research context investigating small patient groups; how-ever, in daily practice this becomes cumbersome.
Commercial software solutions to analyse DCE-MRI data exist and they allow integration into the clinical en-vironment. This comprises products of independent companies but also solutions provided by the vendors of the MR scanners, but suffering of multi-vendor capabil-ity. Furthermore, a major problem of these solutions is that they are black-box, which means that validation and absolute benchmarking is difficult. This has real clinical implications, as demonstrated recently in the study by Heye et al. [26] which reported that a“considerable vari-ability for DCE MR imaging pharmacokinetic parame-ters (Ktrans, kep, ve, iAUGC) was found among commercially available perfusion analysis solutions” and that therefore “clinical comparability across perfusion analysis solutions is currently not warranted”.
In addition, such software is expensive in respect to the cost-benefit ratio: available commercial software so-lutions are often dedicated to a single application, i.e., heart, brain, or prostate perfusion [27] which does not allow for easy extension and adaption beyond the
intended usage in the clinical situation [28]. Therefore, only few licenses or dedicated workstations are usually purchased which prevents ubiquitous usage [29, 30].
Recently our group presented a perfusion analysis tool (UMMPerfusion) that aimed at overcoming some of the aforementioned problems [31]. In the initial version of our software, we provided means for quality assurance by visualizing the arterial input function (AIF) online while drawing its respective region of interest and by generating automatically a report logging all settings of the respective data analysis session. The software itself was designed as a plugin for the Open Source DICOM Workstation OsiriX [32, 33] which can be fully embed-ded into the radiological workflow [30] and thereby, cal-culated results by our software, too. The decision to select OsiriX, besides that it has been installed for re-search and clinincal use in our Radiology department was that OsiriX became a very popular and powerful software with more than 40.000 users worldwide at very low costs. By implementing the perfusion anaylsis soft-ware as OsiriX plugin and Open Source, we hope to reach a large number of users and to bring perfusion im-aging forward by providing analysis software.
To calculate hemodynamic parameters, however, so far only a model-free deconvolution approach was imple-mented. Pharmacokinetic models reported in the litera-ture [34] offer additional parameters, e.g., permeability or extravascular extracellular volume and describe the tissue in more detail.
In this paper, we will present recent extensions of our software. This comprises the implementation of several well established compartment models and their integra-tion into the plugin and the quality management devel-oped for this software.
Implementation Perfusion models
Besides the existing deconvolution approach described in detail in [31], five additional models were implemented, namely, a one compartment model (1CP), a two compart-ment exchange (2CXM), a two compartcompart-ment uptake model (2CUM), a two compartment filtration model (2FM) and eventually the extended Toft’s model (ETM). A detailed description with theoretical background [35] and the reference implementation in IDL (Exelis VIS, Boulder, CO) of the single models is detailed in [36]. The imple-mentation of the compartment models in this work was translated from IDL to C/C++. Table 1 shows the different parameters to be obtained by the implemented models.
We have chosen to model the capillary bed in terms of arterial plasma concentration (ca), tissue plasma
concen-tration (cp), plasma volume (vp) and plasma flow(Fp) as
in [37]. Others use arterial blood concentration (ca,b),
blood flow (F), and use the term‘AIF’for ca,b. There are
no experimental indications that either plasma- or blood parameters form better biomarkers, so the choice be-tween the alternatives is a matter of historical
conven-tion. All equations can be translated between
conventions by inserting the haematocrit of arterial blood (Hcta), and the haematocrit of tissue blood (Hctt).
In practice, the blood concentration ca,b is measured
from an ROI in a feeding artery. ca is then derived by
dividingca,bby 1-(Hcta) and a known value for the
arter-ial haematocrit Hcta. A measured value for the
individ-ual subject should be used when available; if not, a standard value such as Hcta= 0.45 is often used [38].
All models are fitted to the measured data by non-linear least square optimization, e.g., by the Levenberg-Marquardt-Algorithm (LMA). In our implementation, we incorporated the LMA implementation by Mark-wardt et al. (mpfit, version 1.2) [39]. The mpfit algorithm thereby serves as a general solver of the optimization problem. The respective compartment model was imple-mented as a function that is passed to the solver. Thereby, a modularization and easy extension of our plugin is possible. To add a further model, only the model function has to be implemented.
Another benefit of this modularization is that parame-ters related solely to the fit algorithm (stopping criteria, number of iterations, etc.) can be configured and main-tained globally and be provided to all models. This pre-vents different settings for each perfusion model and allows comparison of results across perfusion models. In the current implementation, all such parameters have been adopted from the reference implementation in PMI [40]. Each parameter can be altered by the user accord-ing to their needs. Also, to constrain the fittaccord-ing algo-rithm, the initial parameters of the compartment models can be fixed or upper and lower bounds can be set. All user defined settings can be saved as preferences for fu-ture analyses. Furthermore, the preferences can be exported to be distributed within or across institutions or to have common preferences for e.g., a certain study or application. It is saved in the property list format (plist) provided by the Mac OSX operating system [41].
Data analysis options
In our software, for the newly implemented compart-ment models, two ways to analyze the data were imple-mented; based on a region of interest (ROI) and calculation of parametric maps. Furthermore, the user can choose to compare different ROIs (within the same data set) using one model or to compare the different compartment models among each other.
ROI based analysis
The ROI approach allows selecting a specific area within the data set to be analyzed. Within this (tissue) ROI, all time intensity curves of the enclosed pixels are averaged and then the respective model is fitted to this curve.
Calculation of parametric maps
In the map mode, a voxel wise fitting of the
compart-ment model is performed. Although means for
parallelization of the calculations are implemented within our software using Grand Central Dispatch [42], this approach can be time consuming, especially in large datasets and within the background voxels where no meaningful fit results are expected and the fit algorithm will probably not converge. Therefore, we force the user to select a rectangular region around the respective part in the image to be analyzed. This ROI is propagated throughout the whole 3D stack and within this volume, voxel wise fitting is performed.
Comparing multiple perfusion models
Choosing the right perfusion model to analyze the ob-tained DCE-MRI data is critical [3, 43]. As outlined be-fore, we implemented a range of models with different amount of free parameters to be fitted. For example, the 1CP has two free parameters while the 2CXM has four, i.e., they model the tissue physiology differently.
In general, a too simple model might not capture the physiology within the tissue while a too complex model might overfit or the large amount of fitted parameters cannot be estimated under stable conditions. Therefore, comparing different models on the data at hand and Table 1Compartment models and their pharmacokinetic parameters and respective units as implemented in our software. Please note that Ktrans = E*Fp and, for the ETM, by definition PS = Ktrans
Plasma Flow (Fp) (ml/min/100 ml) Plasma MTT (s) Plasma Volume (ml/100 ml) Interstitial MTT (s) Interstitial Volume (ml/100 ml) Extraction Fraction (E) (%) Permeability-surface area product (PS) (ml/min/100 ml)
Ktrans (ml/min/100 ml) 1CP x x x
2CUM x x x x x x
2CFM x x x x x x x
2CXM x x x x x x x x
estimating the goodness of fit is a strategy to select the most appropriate model.
To make this most feasible and easy, in our implemen-tation, the user can switch between the different perfu-sion models while our software keeps recent settings like signal normalization, baseline, the selected AIF and tis-sue ROI and therefore, provides them directly to the se-lected model. Thereby, common errors during perfusion analysis like nonsimilar ROI selection, changes in pre-requisites are avoided. The user just simply needs to press the‘Generate’button for computing the additional model with all previous settings.
To automate this comparison, we added functionality to loop over the different compartment models and cal-culate for each the respective pharmacodynamic param-eters. It is implemented for ROI based data analysis and the calculation of parametric maps. To support the user to evaluate the results two goodness-of-fit (GOF) mea-sures are provided with the results, namely the χ2error and the Akaike information criterion (AIC) [44]. In case of the calculations of parametric maps, respective maps ofχ2error and AIC are provided. When comparing sev-eral models, given the reported AIC values of each model, the relative information loss, i.e., how good the model fit the data, can be calculated
eAICi−AICmin 2
where AICiis the actual AIC of the model I and AICmin,
the minimum AIC value of all models.
Comparing several ROIs with one model
Another way to analyze DCE-MRI data is to compare different (tissue) ROIs within the data set, e.g., to see dif-ferences between healthy and diseased tissue or between paired organs like the kidney. To foster automation here too, we also implemented an option to loop over all (tis-sue) ROIs within the data set and calculate the selected model for these.
Software design
The design of our software follows the Model–View– Con-troller (MVC) design pattern [45, 46]. Thereby, the com-munication between the user, the graphical user interface (GUI) for visualization (view) and the model is handled via a so called controller (cf. Fig. 1). This allows a separ-ation between the computsepar-ation and the visualizsepar-ation/ user interaction in our system and makes our plugin modular and extensible. For example, the design of the GUI can be changed without the need to change the model (e.g., com-putation of the compartment models). The controller steers the communication between view and model. In the following two examples depicting briefly the software de-sign are presented.
Graphical user interface
In our implementation the GUI represents the Control-ler of the MVC concept. It allows the user to steer the calculation implemented in the model. Results of the calculation are passed on to the View by calling the re-spective visualization function provided by OsiriX (so called 2D viewers).
In the initial version of the plugin, only the fast model-free deconvolution algorithm was implemented [28]. Since, we implemented several other models the GUI was ex-tended. Thereby, care was taken to not overload the inter-face so that the user can easily work with the software.
At start the user is presented just a top down menu to select their perfusion model of choice (see Fig. 2a). For each perfusion model a panel showing the inputs is visu-alized when selected from the top down menu (cf. Fig. 2b). We designed the GUI in such way that work-flow (selection of input parameters) needed to calculated the model was mostly kept the same. Overall, up to six steps (see Fig. 2, red numbers) have to be performed to obtain a result. This comprises to select the model of choice (1), to select the arterial input function (AIF) and a region of interest (ROI) of the respective tissue to be analysed (2), selection of the type signal normalization (3) and the baseline (4), i.e., number of time points to in-clude for the signal normalization. Moreover, the user has the option to select a range of slices from the 3D volume and to trim the time series (5). Eventually, the user can set a name prefix (6) which is added to the re-sults. This might be beneficial to tag results if different parametrization of a model during a data analysis session is performed. Ticking the ‘autosave’checkbox allows for saving the results directly to the OsiriX database automat-ically. Saving results can be also triggered manually by hit-ting the export button. After successfully following the above steps, the‘Generate’button starts the calculations.
Technically, after initialization of the plugin, the GUI depicted in Fig. 2 is created by a controller to steer this panel following the above described MVC design pat-tern. Figure 3 shows, as an example, the call graph of
the initialization method depicting the connection to Views, to data management objects (e.g., to store infor-mation about ROIs), and to controller that supervises the actual computation.
Compartment models
To realize a flexible solution and to easily extend our software by possible other compartment models, we followed the object-oriented programming paradigm.
Figure 4 shows the inheritance diagram of the UMM-PAlgorithmController that provides a general class for calculating a perfusion model based on the GUI inputs and the DCE-MRI data. From this general class, it could be regarded as a template, specific sub controllers are inherited. These hosts the actual implementation needed to e.g., calculate a compartment model and provide parametric maps as a result. Thereby, on the level of this controller, only an interface to the actual compartment model is implemented. The implementation of the
respective model is encapsulated and called as a method by the instanced controller object during run time.
To implement a new compartment model, only three steps have to be performed: a) the respective implemen-tation of the model, b) extension of the sub controller to interface the model, and eventually to adapt the GUI appropiatly to be able to select the model.
Quality management
Besides the technical (implementation of the algo-rithms) and medical/physiological (modeling the per-fusion in tissue) aspects of this software, another part of this software is quality management. On the one hand, this comprises testing and evaluation but also documentation of the software to allow for certifica-tion of the software for clinical use. The UMMPerfu-sion plugin was certified in-house according to the German Medical Product law. Besides the necessary documents, e.g., risk analysis etc., we designed a test-ing scheme and correspondtest-ing reference datasets [28]
to continually evaluate changes to the software. In addition, we also provide a bug tracking system so that user can report errors or problems with the soft-ware but also suggestions of new features. All of this is provided via an online platform called OpossUMM (http://www.opossumm.de) which is freely accessible.
Moreover, we also implemented means to support the user in its daily work to detect errors arising from the data analysis. This comprises a preview of the AIF and a report automatically generated and saved with the pa-tient record. The AIF preview display thereby is update immediately if the user alters the corresponding ROI, e.g., by resizing or moving it. Thereby, the user can, be-fore performing any calculations, check if a correct AIF was selected and prevent results hampered by this. The report gives an overview of all user selected parameters (AIF, baseline, etc.) of the respective data analysis.
Furthermore, it also visualizes the selected ROIs but also the initial parameters of the fitting algorithm. By this, a documentation of the steps taken to perform a data analysis is given allowing for a retrospective quality check, also.
Results and discussion
Our software plugin was implemented and tested on Mac OSX systems version 10.8.x using OsiriX versions 5.5.1, 5.6, and 5.9. Apart from these OsiriX versions, the software may work but no tests by the authors were per-formed so far.
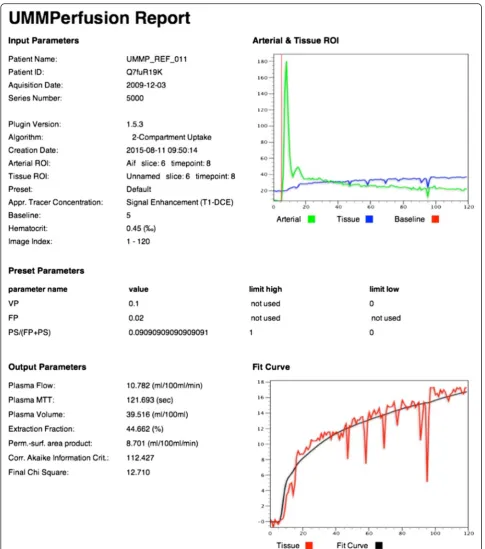
Figure 5 depicts the AIF display and the GUI for an example data analysis of the prostate. The result of this ROI based analysis using the 2CUM is depicted in Fig. 6 while Fig. 7 shows the corresponding report that is
Fig. 4Class diagram of UMMPAlgorithmController. It depicts the respective classes and their methods. The arrows show the inheritance of the subclasses. Here, the subclasses implement the different data analysis option (ROI-based, parametric maps, the deconvolution approach, and the advanced options to compare models)
created when exporting the data into the OsiriX data-base. The report is a DICOM object that can be archived with the patient data into PACS systems.
In the ROI based analysis as well as for the report, the calculated parameters derived from fitting the model to the data are listed. Also, the fit itself to the data is visual-ized in a plot. To assess the quality of the fit not only visually, we provide two goodness-of-fit measures (χ2, AIC). While theχ2can be used to judge if the model fit was good, the AIC can be used to compare two or more models given the data.
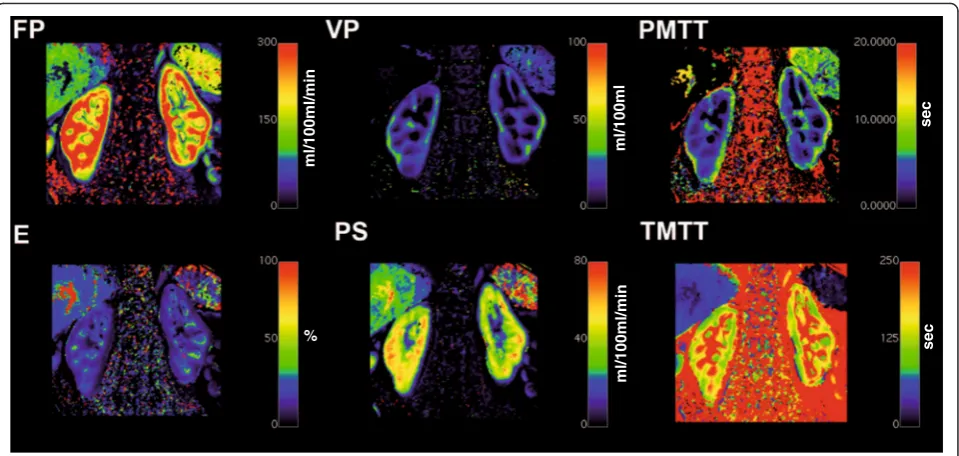
Similar, the results of the other implemented compart-ment models for a ROI based analysis would look alike. Analyzing the data using the pixel based calculation will result in a parametric map for each of the respective pa-rameters of corresponding compartment model. As an example, Fig. 8 depicts such an analysis for a DCE-MRI data set of the kidney employing the 2CFM.
To evaluate the implemented compartment models we used a procedure previously described in [31] utilizing a
reference test data set constructed from a DCE-MRI data set of the prostate. A time series with 100 time points was constructed taking a matrix of 8 × 4 pixels as one slice. Half of these pixels were taken from a vessel representing the AIF in the original data while the remaining pixels were sampled from prostate tissue. To calculate reference values for each compartment model, the software PMI [40], an authorative research tool for perfusion analysis was selected. Obtained reference values for each parameter and the corresponding values of our software were compared. In all settings, no differ-ences between reference and our implementation were detected (see Table 2). By this we conclude that the im-plementation of the algorithm is technically correct.
In order to process data by our plugin, two prerequi-sites are required, a) the data has to be in DICOM for-mat and b) it must be loaded into the OsiriX 4D viewer. To further evaluate the robustness of our software, also for processing image data from different vendors, perfu-sion data sets from the three main vendors of clinical
MR systems (Siemens, GE, Philips) were collected and processed successfully. The major challenge in process-ing data sets of the different vendors is that information of the temporal resolution is stored differently in the DICOM headers, especially for the Philips multi frame storage format (see Table 3). If no such timing informa-tion can be extracted from the DICOM header, at the moment, no calculation of the models is possible. We are currently also testing to read DICOM data provided by small animal scanners (Bruker). DCE-MRI data of 2D acquisitions could be successfully analysed.
In addition special slice positioning (e.g., 1 transversal slice, 4 coronal slices) reported in the literature [1, 7] caused problems when loaded into the OsiriX 4D viewer, a prerequisite for our plugin to detect the temporal domain of the data. Using an option in OsiriX to resort this data, the 4D viewer could be opened and thereafter, our plugin could process this data without problems (see Fig. 9).
A current drawback of our implementation is that the non-linear fitting of parametric maps is time consuming. To reduce the computation time, at present a rectangu-lar ROI has to be placed in the DCE-MRI image series. To further improve the computational speed of the cal-culating parametric maps, a linear least squares ap-proach as proposed by Flouri et al. [36] will be explored. Furthermore, an implementation of the compartment models in a Graphics Processing Unit (GPU) will be considered.
Besides our plugin several research tools exist for per-fusion analysis in DCE-MRI [47–52] which might allow
for benchmarking and comparison of the different solu-tions. In this work, we only compared our algorithms against the reference implementation in PMI [40] to ver-ify the technical correctness. A comparison of PMI against other perfusion analysis software using the QIBA protocol and different levels of noise was reported by Cron et al. [53]. Beuzit et al. compared our plugin to four other software solutions, including commercial soft-ware from all three main vendors using simulated and measured data [54]. In this study, the ETM was used and the authors reported a bias for all solutions and pharmacokinetic parameters ranging from 0.19 min−1to 0.09 min−1for Ktrans,−0.15 to 0.01 for ve, and−0.65 to 1.66 mmol/L−1/min. In both studies the variances in the parameters between the different software solutions were attributed to various reasons. Cron et al. observed increased unphysiological values with increasing noise while Beuzit et al. stated that probably the (not docu-mented) fitting routine might have had an influence on the results. As stated by Heye et al. such comparison might be in general difficult [26], especially for the com-mercial solution since little is known about their imple-mentation. Available research tools are implemented on various platforms, requiring different input formats and outputs and eventually implemented different fitting al-gorithms which make a comparison difficult to interpret. Furthermore, data sets with known true values or avail-able gold standard and fully control on the measured or simulated data should be employed when comparing and validating software to minimize e.g., inter patient
ml/100ml/min
ml/100ml/min
%
ml/100ml
sec
sec
variability [55]. All this implies that there is a need in standardizing the DCE-MRI perfusion analysis.
Compared to the above mentioned research tools our plugin underwent an in house certification process. This process which involves risk analysis and thorough docu-mentation also gave insights howto improve the work-flow, the structure of the source code and to prevent errors caused accidently by users and thereby improve
stability of the plugin. Eventually, it allows for using our plugin for research but also for clinical routine [56]. All documents and procedures of this certification are docu-mented at our website (http://www.opossumm.de) to help others to perform an in house certification by themselves or to adapt the procedure according to their local regulations.
Conclusions
We developed open source software to analyse DCE-MRI perfusion data. The software is designed as plugin for the DICOM Workstation OsiriX. It features a clean GUI and provides a simple workflow for data analysis while it could also be seen as a toolbox providing an im-plementation of several recent compartment models, adapted from the software PMI, to be applied in re-search tasks. Integration into the infrastructure of a radi-ology department is given via OsiriX. Results can be saved automatically and reports generated automatically during data analysis to ensure certain quality control.
Availability and requirements
Compiled binaries and source code of our Open Source software is available for download via the OpossUMM platform (http://www.opossumm.de). The software re-quires at least Mac OSX 10.8.x and was tested with OsiriX versions 5.5, 5.6 and 5.9. For optimal perform-ance and to handle large datasets, the installation of the commercial available 64bit extension of OsiriX (now in-cluded in OsiriX MD) is suggested.
Ethics approval
The data were acquired in different studies at our insti-tution and were retrospectively selected for this paper. No permission to use the data in this study was re-quired, however, for the data acquisition and retrospect-ive further usage local IRB approval (Institutional Review Board II, Medical Faculty Mannheim, Heidelberg Table 2Resulting pharmacokinetic parameters calculated by the
different models and the reference test data set. Model evaluation was performed by the ROI-based approach, i.e., selecting the AIF as ROI in the upper row of the test data set and the tissue ROI in the lower row (see [31] for details on the test data set). For our test data set we do not expect physiological reasonable values but identical results to verify the technical correct implementation of the algorithms in UMMPerfusion
Parameter Reference UMMPerfusion 1 CP
Plasma Flow 0,148 0,148 Plasma MTT 0,012 0,012 Plasma Volume 0,033 0,033 2 CXM
Plasma Flow 0,056 0,056 Plasma MTT 0,092 0,092 Plasma Volume 0,133 0,133 Interstitial MTT 73684,672 73684,672 Interstitial Volume 0,129 0,129 Extraction Fraction 0,149 0,149 Perm.-surf. Area product 0,088 0,088 2 CFM
Plasma Flow 0,264 0,076 Plasma MTT 0,03 0,03 Plasma Volume 0,076 0,076 Tubular MTT 767313,375 767313,375 Tubular Flow 0,166 0,166 Extraction Fraction 0,001 0,001 2 CUM
Plasma Flow 0,032 0,032 Plasma MTT 0,011 0,011 Plasma Volume 0,033 0,033 Perm.-surf. Area product 0 0 Extraction Fraction 0 0 ETM
Plasma Volume 0,095 0,095 Ktrans 0,122 0,122 Interstitial MTT 0,023 0,023 Interstitial Volume 0,007 0,007
Table 3DICOM header tags addresses in hexadecimal notation used by UMMperfusion to derive the temporal resolution of the DCE-MRI series. For the Bruker DICOM, at the moment only 2D + t data can be processed, the time information is calculated from TR and the number of acquired images
Vendor DICOM tags used for reading temporal resolution Siemens “0X0008,0X0032” GE, Philips single frame “0X0018,0X1060” Philips multiframe “0X0008,0X0033”
“0X0008,0X0032” Bruker “0X0018,0X1310”
University) and written consent of the patients/ volun-teers invoveld was obtained at time of the original study. All patient identifing information has been removed prior to the data analysis.
Abbreviations
MRI:magnetic resonance imaging; DCE: dynamic contrast enhanced; AIF: arterial input function; MVC: model-view-controller; ROI: region of interest; 1CP: one compartment model; 2CXM: two compartment exchange model; 2CUM: two compartment uptake model; 2CFM: two compartment filtration model; ETM: extended Toft’s model; LMA: levenberg-marquardt-algorithm; GUI: graphical user interface; GOF: goodness-of-fit; TR: repetition time.
Competing interests
The authors declare that they have no competing interests.
Authors’contributions
FGZ: wrote manuscript, designed software, supervised implementation. MD: implementation of software, testing & evaluation, wrote manuscript. SS: development of compartment models, wrote/revised manuscript. LRS: wrote/revised manuscript. SOS: wrote/revised manuscript. GW: wrote/revised manuscript, quality management, GUI design, supervised implementation. All authors read and approved the final manuscript.
Author details
1Computer Assisted Clinical Medicine, Medical Faculty Mannheim, Heidelberg
University, Theodor-Kutzer-Ufer 1-3, 68167 Mannheim, Germany.
2Department of Clinical Radiology and Nuclear Medicine, University Medical
Center Mannheim, Heidelberg University, Mannheim, Germany.3Division of
Biomedical Imaging, University of Leeds, Leeds, UK.
Received: 21 August 2015 Accepted: 6 January 2016
References
1. Michaely H, Sourbron S, Dietrich O, Attenberger U, Reiser M, Schoenberg S. Functional renal MR imaging: an overview. Abdom Imaging.
2007;32(6):758–71.
2. Koh TS, Bisdas S, Koh DM, Thng CH. Fundamentals of tracer kinetics for dynamic contrast-enhanced MRI. J Magn Reson Imaging.
2011;34(6):1262–76.
3. Sourbron S. Technical aspects of MR perfusion. Eur J Radiol. 2010.76(3):304-13.
4. Ingrisch M, Sourbron S. Tracer-kinetic modeling of dynamic contrast-enhanced MRI and CT: a primer. J Pharmacokinet Phar. 2013;40(3):281–300. 5. Cuenod CA, Balvay D. Perfusion and vascular permeability: basic concepts
and measurement in DCE-CT and DCE-MRI. Diagnostic Int imaging. 2013;94(12):1187–204.
6. Wildner D, Pfeifer L, Goertz RS, Bernatik T, Sturm J, Neurath MF, et al. Dynamic contrast-enhanced ultrasound (DCE-US) for the characterization of hepatocellular carcinoma and cholangiocellular carcinoma. Ultraschall Der Medizin. 2014;35(6):522–7.
7. Attenberger U, Michaely H, Sourbron S, Notohamiprodjio M, Glaser C, Reiser M, et al. Clinical value of MR-based quantification of renal perfusion parameters with a separable two-compartment model. Toronto: Proceedings 16th Scientific Meeting, International Society for Magnetic Resonance in Medicine; 2008. p. 3680.
8. Zöllner FG, Zimmer F, Klotz S, Hoeger S, Schad LR. Functional imaging of acute kidney injury at 3 Tesla: investigating multiple parameters using DCE-MRI and a two-compartment filtration model. Z Med Phys. 2015;25(1):58–65. 9. Buckley DL, Shurrab AAE, Cheung CM, Jones AP, Mamtora H, Kalra PA.
Measurement of single kidney function using dynamic contrast-enhanced MRI: comparison of two models in human subjects. J Magn Reson Imaging. 2006;24(5):1117–23.
10. Thng CH, Koh TS, Collins DJ, Koh DM. Perfusion magnetic resonance imaging of the liver. World J Gastroenterol. 2010;16(13):1598–609. 11. Biglands JD, Magee DR, Sourbron SP, Plein S, Greenwood JP, Radjenovic A.
Comparison of the diagnostic performance of four quantitative myocardial perfusion estimation methods used in cardiac mr imaging: ce-marc substudy. Radiology. 2015;275(2):393–402.
12. Barentsz JO, Richenberg J, Clements R, Choyke P, Verma S, Villeirs G, et al. ESUR prostate MR guidelines 2012. Eur Radiol. 2012;22(4):746–57. 13. Franiel T, Hamm B, Hricak H. Dynamic contrast-enhanced magnetic
resonance imaging and pharmacokinetic models in prostate cancer. Eur Radiol. 2011;21(3):616–26.
14. Messner NM, Zollner FG, Kalayciyan R, Schad LR. Pre-clinical functional magnetic resonance imaging part II: The heart. Z Med Phys. 2014;24(4):307–22.
15. Zollner FG, Kalayciyan R, Chacon-Caldera J, Zimmer F, Schad LR. Pre-clinical functional magnetic resonance imaging part I: The kidney. Z Med Phys. 2014;24(4):286–306.
16. Jaspers K, Leiner T, Dijkstra P, Oostendorp M, van Golde JM, Post MJ, et al. Optimized pharmacokinetic modeling for the detection of perfusion differences in skeletal muscle with DCE-MRI: effect of contrast agent size. Med Phys. 2010;37(11):5746–55.
17. Ng CS, Wei W, Bankson JA, Ravoori MK, Han L, Brammer DW, et al. Dependence of DCE-MRI biomarker values on analysis algorithm. PLoS One. 2015;10(7), e0130168.
18. Cutajar M, Mendichovszky IA, Tofts PS, Gordon I. The importance of AIF ROI selection in DCE-MRI renography: reproducibility and variability of renal perfusion and filtration. Eur J Radiol. 2010;74(3):e154–60.
19. Mendichovszky IA, Cutajar M, Gordon I. Reproducibility of the aortic input function (AIF) derived from dynamic contrast-enhanced magnetic resonance imaging (DCE-MRI) of the kidneys in a volunteer study. Eur J Radiol. 2009;71(3):576–81.
20. Zöllner FG, Sance R, Rogelj P, Ledesma-Carbayo MJ, Rørvik J, Santos A, et al. Assessment of 3D DCE-MRI of the kidneys using non-rigid image registration and segmentation of voxel time courses. Comput Med Imaging Graph. 2009;33(3):171–81.
21. Hodneland E, Hanson EA, Lundervold A, Modersitzki J, Eikefjord E, Munthe-Kaas AZ. Segmentation-driven image registration- application to 4D DCE-MRI recordings of the moving kidneys. IEEE Trans Image Process. 2014;23(5):2392–404.
22. Radiological Society of North America, Quantitative Imaging Biomarkers Alliance [http://www.rsna.org/QIBA/]. 2015, last accessed 9.1.2016. 23. European Society of R. ESR position paper on imaging biobanks. Insights
Imaging. 2015;6(4):403–10.
24. Haider M, Yeung I, Jaffray, D. The DCE Tool for ClearCanvas [http:// thedcetool.com/] 2015; last accessed 9.1.2016.
25. Sung K. DCE Tool [http://kyungs.bol.ucla.edu/software/DCE_tool/DCE_tool. html] 2015; last accessed 9.1.2016.
26. Heye T, Davenport MS, Horvath JJ, Feuerlein S, Breault SR, Bashir MR, et al. Reproducibility of dynamic contrast-enhanced MR imaging. Part I. Perfusion characteristics in the female pelvis by using multiple computer-aided diagnosis perfusion analysis solutions. Radiology. 2013;266(3):801–11. 27. Wittsack HJ, Ritzl A, Modder U. User friendly analysis of MR investigations of
the cerebral perfusion: Windows(R)-based image processing. Röfo. 2002;174(6):742–6.
28. Goh V, Schaeffter T, Leach M. Reproducibility of dynamic contrast-enhanced MR imaging: why we should care. Radiology. 2013;266(3):698–700. 29. Jalbert F, Paoli JR. Osirix: Free and open-source software for medical
imagery. Rev Stomatol Chir. 2008;109(1):53–5.
30. Ruggiero S, Weisser G. Integrating Mac systems into a medical IT infrastructure: creating an affordable radiology workstation with OsiriX. Mannheim: Department of Clinical Radiology, University Hospital of Mannheim; 2007. p. 19.
31. Zöllner FG, Weisser G, Reich M, Kaiser S, Schoenberg SO, Sourbron SP, et al. UMMPerfusion: an open source software tool towards quantitative MRI perfusion analysis in clinical routine. J Digit Imaging. 2013;26(2):344–52. 32. Pixmeo Inc. OsiriX Plugins [http://www.osirix-viewer.com/Plugins.html] 2015;
last accessed 9.1.2016.
33. Rosset A, Spadola L, Ratib O. OsiriX: An open-source software for navigating in multidimensional DICOM images. J Digit Imaging. 2004;17(3):205–16. 34. Sourbron SP, Buckley DL. Classic models for dynamic contrast-enhanced
MRI. NMR Biomed. 2013;26(8):1004–27.
35. Sourbron S. Compartmental modelling for magnetic resonance renography. Z Med Phys. 2010;20(2):101–14.
36. Flouri D, Lesnic D, Sourbron S. Fitting the two-compartment model in DCE-MRI by linear inversion. 2015.
37. Sourbron SP, Buckley DL. Tracer kinetic modelling in MRI: estimating perfusion and capillary permeability. Phys Med Biol. 2012;57(2):R1–33. 38. Brix G, Kiessling F, Lucht R, Darai S, Wasser K, Delorme S, et al.
Microcirculation and microvasculature in breast tumors: Pharmacokinetic analysis of dynamic MR image series. Magn Reson Med. 2004;52(2):420–9. 39. Markwardt CB. Non-linear least squares fitting in IDL with MPFIT,
Astronomical data analysis software and systems XVIII: 2009; Quebec, Canada. San Francisco: Astronomical Society of the Pacific; 2009. p. 251–4. 40. Sourbron S, Biffar A, Ingrisch M, Fierens Y, Luypaert R. PMI: platform for
research in medical imaging. Magn Reson Mater Phy. 2009;22(1):539. 41. Apple Inc. Property List format [https://developer.apple.com/library/mac/
documentation/Darwin/Reference/ManPages/man5/plist.5.html#//apple_ref/ doc/man/5/plist]. Last accessed 9.1.2016.
42. Apple Inc.: Introducing Blocks and Grand Central Dispatch. In: Mac OS X Reference Library. 2010-11-10 edn. https://developer.apple.com/library/mac/ documentation/Cocoa/Conceptual/Multithreading/Introduction/
Introduction.html: Apple Inc.; 2010. Last accessed: 9.1.2015.
43. Luypaert R, Sourbron S, de Mey J. Validity of perfusion parameters obtained using the modified Tofts model: a simulation study. Magn Reson Med. 2011; 65(5):1491–7.
44. Luypaert R, Ingrisch M, Sourbron S, de Mey J. The Akaike information criterion in DCE-MRI: does it improve the haemodynamic parameter estimates? Phys Med Biol. 2012;57(11):3609–28.
45. Apple Inc. Model View Controller in Cocoa [https://developer.apple.com/ library/ios/documentation/General/Conceptual/DevPedia-CocoaCore/MVC. html]; last accessed: 9.1.2016.
46. Krasner GE, Pope ST. A cookbook for using the model-view controller user interface paradigm in Smalltalk-80. J Object Oriented Program.
1988;1(3):26–49.
47. Kosior JC, Frayne R. PerfTool: a software platform for investigating bolus-tracking perfusion imaging quantification strategies. J Magn Reson Imaging. 2007;25(3):653–9.
48. Puech P, Betrouni N, Makni N, Dewalle AS, Villers A, Lemaitre L. Computer-assisted diagnosis of prostate cancer using DCE-MRI data: design, implementation and preliminary results. Int J Comput Assist Radiol Surg. 2009;4(1):1–10.
49. Whitcher B, Schmid VJ. Quantitative analysis of dynamic contrast-enhanced and diffusion-weighted magnetic resonance imaging for oncology in R. J Stat Softw. 2011;44:1–29.
50. Ferl G. DATforDCEMRI: an R package for deconvolution analysis and visualization of DCE-MRI data. J Stat Softw. 2011;44:1–18.
51. Barnes SR, Ng TS, Santa-Maria N, Montagne A, Zlokovic BV, Jacobs RE. ROCKETSHIP: a flexible and modular software tool for the planning, processing and analysis of dynamic MRI studies. BMC Med Imaging. 2015;15:19.
52. Ortuno JE, Ledesma-Carbayo MJ, Simoes RV, Candiota AP, Arus C, Santos A. DCE@urLAB: a dynamic contrast-enhanced MRI pharmacokinetic analysis tool for preclinical data. BMC Bioinf. 2013;14:316.
53. Cron GO, Sourbron S, Barnoriak DP, Abdeen R, Hogan M, Nguyen TB. Bias and precision of three different DCE-MRI analysis software packages: a comparison using simulated data. Milan: Proceedings in Internaltional Conference for Magnetic Resonance in Medicine; 2014. p. 4592. 54. Beuzit L, Eliat P-A, Bannier E, Ferre J-C, Gandon Y, Brun V, et al. Dynamic
contrast-enhanced MR imaging in rectal cancer: study of inter-software accuracy and reproducibility using simulated and clinical data. Toronto: Proceedings in International Conference for Magnetic Resonancen in Medicine; 2015. p. 789.
55. Davenport MS, Heye T, Dale BM, Horvath JJ, Breault SR, Feuerlein S, et al. Inter- and intra-rater reproducibility of quantitative dynamic contrast enhanced MRI using TWIST perfusion data in a uterine fibroid model. J Magn Reson Imaging. 2013;38(2):329–35.
56. Lassel E, Daab M, Schülein P, Drechsler J, Schönberg S, Schad L, et al. In-Haus-MPG-Zertifizierung von Software in der Radiologie am Beispiel von UMMPerfusion. Fortschr Röntgenstr. 2013;185(S01):VO202_208.


![Fig. 9 Example using a data set with different slice orientation and UMMperfusion. a and b two slices from the DCE-MRI acquired following theprotocol described in [57], comprising four coronal slices (a) and one transversal slice (b)](https://thumb-us.123doks.com/thumbv2/123dok_us/490235.1543718/12.595.56.538.87.369/different-orientation-ummperfusion-following-theprotocol-described-comprising-transversal.webp)
