R E S E A R C H A R T I C L E
Open Access
Development and validation of a
simple-to-use clinical nomogram for predicting
obstructive sleep apnea
Huajun Xu
1,2,3†, Xiaolong Zhao
1,2†, Yue Shi
4, Xinyi Li
1,2,3, Yingjun Qian
1,2,3, Jianyin Zou
1,2,3, Hongliang Yi
1,2,3*,
Hengye Huang
4*, Jian Guan
1,2,3*and Shankai Yin
1,2,3Abstract
Background:The high cost and low availability of polysomnography (PSG) limits the timely diagnosis of OSA. Herein, we developed and validated a simple-to-use nomogram for predicting OSA.
Methods: We collected and analyzed the cross-sectional data of 4162 participants with suspected OSA, seen at our sleep center between 2007 and 2016. Demographic, biochemical and anthropometric data, as well as sleep parameters were obtained. A least absolute shrinkage and selection operator (LASSO) regression model was used to reduce data dimensionality, select factors, and construct the nomogram. The performance of the nomogram was assessed using calibration and discrimination. Internal validation was also performed.
Results: The LASSO regression analysis identified age, sex, body mass index, neck circumference, waist circumference, glucose, insulin, and apolipoprotein B as significant predictive factors of OSA. Our nomogram model showed good discrimination and calibration in terms of predicting OSA, and had a C-index value of 0.839 according to the internal validation. Discrimination and calibration in the validation group was also good (C-index = 0.820). The nomogram identified individuals at risk for OSA with an area under the curve (AUC) of 0.84 [95% confidence interval (CI), 0.83–0.86].
Conclusions: Our simple-to-use nomogram is not intended to replace standard PSG, but will help physicians better make decisions on PSG arrangement for the patients referred to sleep center.
Keywords: Obstructive sleep apnea, Nomogram, Risk factor
Background
Obstructive sleep apnea (OSA) is one of the most common types of sleep-disordered breathing. One not-able characteristic of OSA is recurrent episodes of partial/ complete pharyngeal collapse and subsequently reduced oronasal airflow, or even cessation of breathing, during sleep [1]. OSA is closely associated with impairments in daily activities and social functioning due to daytime
sleepiness and fatigue, in turn caused by sleep fragmen-tation and clinical sequelae such as hypertension, diabetes, dyslipidemia, cognitive dysfunction, cardiovascular events
and even all-cause mortality [2–7]. The prevalence of
OSA is high and has increased with the obesity
epi-demic according to data gathered since the 1990s [8–
10]; however, most cases remain undiagnosed and thus the disease is undertreated, resulting in a high social and economic burden.
Although awareness of the prevalence of OSA and its clinical sequelae have increased recently based on data from western countries, the wait time for polysomno-graphy (PSG) ranges from 2 to 60 months [11]; thus, limited access to PSG, which also involved significant expense, remains a major issue. Chinese patients with OSA also need time to reach the aforementioned treatment
* Correspondence:[email protected];[email protected];
†Huajun Xu and Xiaolong Zhao contributed equally to this work.
1Department of Otolaryngology Head and Neck Surgery & Center of Sleep
Medicine, Shanghai Jiao Tong University Affiliated Sixth People’s Hospital, Yishan Road 600, Shanghai 200233, China
4Department of Epidemiology, School of Public Health, Shanghai Jiao Tong
University, 225South Chongqing Road, Shanghai 200020, China Full list of author information is available at the end of the article
plan due to a lack of readily available PSG labs. A de-layed diagnosis in turn results in dede-layed OSA treatment and, consequently, more comorbidities. Thus, a simple-to-use and reliable method to identify and triage patients at high risk for OSA is urgently needed.
Well-designed questionnaires [i.e., the STOP-Bang ques-tionnaire (SBQ), STOP quesques-tionnaire (STOP), Epworth Sleepiness Scale (ESS) and the Berlin questionnaire (BQ)] have been designed as substitute methods for diagnosing OSA in the absence of standard PSG. How-ever, the results have been unsatisfactory. In a recent meta-analysis, pooled specificity was low, ranging from 42 to 65% [12]. Furthermore, questionnaires can be sus-ceptible to bias and snoring is not amenable to self-report, as OSA symptoms occur during sleep. Uncertainty exists about the accuracy and clinical utility of the above-mentioned screening tools [13]. An optimized diagnos-tic tool that combines multiple, objective clinical bio-markers, to avoid bias, has yet to be developed.
No study has determined whether using a combination of objective, clinical biomarkers confers a good diag-nostic ability for OSA. Therefore, the aim of our study was to develop and validate a simple-to-use nomogram that incorporated objective demographic, biochemical, and anthropometric parameters to determine whether this nomogram minimized the number of missed OSA diagnoses.
Methods
Our study used a cross-sectional design, was performed in accordance with Declaration of Helsinki and its amendments, and was approved by the Ethics Com-mittee of Shanghai Jiaotong University Affiliated Sixth
People’s Hospital, Shanghai, China. Written informed
consent was obtained from each subject before study enrollment.
Study population
Subjects who complained of snoring or other symptoms (such as daytime sleepiness) of OSA, and who were re-ferred to our sleep center between 2007 and 2016 were consecutively enrolled. All subjects completed question-naires, which were collected and checked by two inde-pendent investigators and captured medical history and health status of the subjects. The exclusion criteria were age less than 18 years; serious systemic disease (i.e., con-gestive heart failure, severe intrinsic pulmonary disease, chronic kidney disease or hepatic disease); pregnancy; had anti-diabetes and taken lowing-lipids drugs and pre-vious OSA treatment. Subjects with missing clinical data were also excluded from the final analysis on agreement among all authors.
Data collection and analysis Anthropometric measurements
Height and weight were measured with the subjects in light clothing and bare feet, as previously described [14]. Weight was measured by an electronic scale. Height was measured from the feet to the head, as the maximum distance when subjects were standing up straight. Body mass index (BMI) was defined as weight (kg) divided by
height in meters2. Neck circumference (NC) was
mea-sured at the level of the cricothyroid membrane; hip cir-cumference (HC) was measured as the maximum girth at the greater trochanters; waist circumference (WC) was measured at the middle of the lower costal margin and iliac crest. All anthropometric data mentioned-above were recorded twice.
Biochemical measurements
A fasting blood sample was drawn from the vein of each subject at 7 AM after PSG monitoring. The serum lipid profile, including total cholesterol (TC), triglycer-ides (TG), high-density lipoprotein cholesterol (HDL-C), low-density lipoprotein cholesterol (LDL-C), tein A-I (ApoA-I), apolipoprotein B (ApoB), apolipopro-tein E, and lipoproapolipopro-tein (a) [Lp(a)] were measured using routine procedures at our hospital laboratory, as previ-ously described [14]. Serum glucose levels were measured using an auto analyzer (Hitachi, Tokyo, Japan), and serum insulin levels were measured using an immunoradiological method [15].
Sleep evaluation
Objective sleepiness was evaluated by standard PSG (Alice 4 or 5; Respironics, Pittsburgh, PA, USA) ac-cording to the American Academy of Sleep Medicine (AASM) 2007 guidelines [16]. A posture and snoring sensor was equipped and an electroencephalogram, bi-lateral electrooculogram, modified lead II electrocar-diogram, bipolar chin electromyogram, oral airflow, nasal airflow (with nasal cannula), pulse oximetry, thoracic and abdominal respiratory effort were obtained. The sleep recordings were staged automatically and then checked by a skilled technician manually.
Apnea was defined as an absence of oronasal airflow
by at-least 90% relative to baseline and lasting ≥10 s.
Hypopnea was defined as any upper airflow reduction of 50% for at least 10 s, accompanied by either a decrease in oxyhemoglobin saturation at least 3% or terminated by awakening. Arousal was defined as abrupt shifts in
EEG electroencephalographic frequency lasting for ≥3 s
[16]. The apnea-hypopnea index (AHI) was given by the number of apnea and hypopnea events per hour of sleep. The oxygen desaturation index was defined as the total
number of episodes of oxyhemoglobin desaturation≥3%
as the average number of arousals per hour of sleep.
OSAS was diagnosed as the AHI≥5 times per hour.
OSAS was classified as mild (5~ 15), moderate (15 ~ 30), or severe (≥30), respectively [16].
Statistical methodology
The statistical analysis was conducted using R (ver. 3.0.1, Vienna, Austria) and MedCalc software (ver. 12.7.3, Ostend, Belgium). The glmnet package in R was used for the least absolute shrinkage and selection operator (LASSO) logistic regression, and significant factors there in were used to construct the nomogram [17], for detail,
please see Additional file 1. Validation was conducted
using one thousand bootstrap analyses. Calibration dia-grams were established as previously described [18]. To evaluate the predictive or discriminatory abilities of this model, an index of probability of concordance (C-index) was calculated among predicted and actual outcomes [19].
The C-index had a range from 0.5 to 1.0, with 0.5 was considered to be random chance; 1.0 was denoted as per-fect discrimination [19]. The LASSO feature regression model was used to distinguish OSA from non-OSA cases. Area under the curve (AUC) in receiver operat-ing characteristic (ROC) analysis was used to evaluate
predictive accuracy. Two-sided p-values < 0.05 was
con-sidered as statistical significance.
Results
Demographic characteristics of the study subjects
A total of 4162 consecutive participants who underwent full-night standard PSG were finally included in our study. We randomly selected 2913 subjects (70%) for inclusion in the training group, and the remaining 1249 (30%) were assigned to the validation group using a random number table. The demographic characteristics of the training and validation groups are summarized in
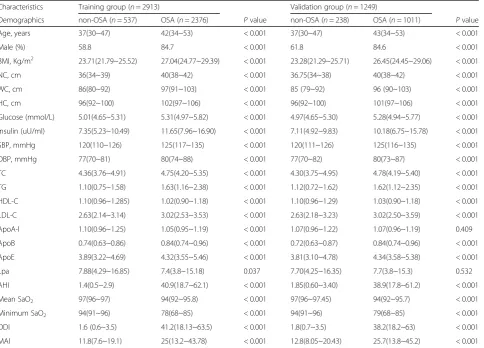
Table 1Clinical characteristics of the training and validation group
Characteristics Training group (n= 2913) Validation group (n= 1249)
Demographics non-OSA (n= 537) OSA (n= 2376) Pvalue non-OSA (n= 238) OSA (n= 1011) Pvalue
Age, years 37(30~47) 42(34~53) < 0.001 37(30~47) 43(34~53) < 0.001
Male (%) 58.8 84.7 < 0.001 61.8 84.6 < 0.001
BMI, Kg/m2 23.71(21.79~25.52) 27.04(24.77~29.39) < 0.001 23.28(21.29~25.71) 26.45(24.45~29.06) < 0.001
NC, cm 36(34~39) 40(38~42) < 0.001 36.75(34~38) 40(38~42) < 0.001
WC, cm 86(80~92) 97(91~103) < 0.001 85 (79~92) 96 (90~103) < 0.001
HC, cm 96(92~100) 102(97~106) < 0.001 96(92~100) 101(97~106) < 0.001 Glucose (mmol/L) 5.01(4.65~5.31) 5.31(4.97~5.82) < 0.001 4.97(4.65~5.30) 5.28(4.94~5.77) < 0.001 Insulin (uU/ml) 7.35(5.23~10.49) 11.65(7.96~16.90) < 0.001 7.11(4.92~9.83) 10.18(6.75~15.78) < 0.001 SBP, mmHg 120(110~126) 125(117~135) < 0.001 120(111~126) 125(116~135) < 0.001
DBP, mmHg 77(70~81) 80(74~88) < 0.001 77(70~82) 80(73~87) < 0.001
TC 4.36(3.76~4.91) 4.75(4.20~5.35) < 0.001 4.30(3.75~4.95) 4.78(4.19~5.40) < 0.001 TG 1.10(0.75~1.58) 1.63(1.16~2.38) < 0.001 1.12(0.72~1.62) 1.62(1.12~2.35) < 0.001 HDL-C 1.10(0.96~1.285) 1.02(0.90~1.18) < 0.001 1.10(0.96~1.29) 1.03(0.90~1.18) < 0.001 LDL-C 2.63(2.14~3.14) 3.02(2.53~3.53) < 0.001 2.63(2.18~3.23) 3.02(2.50~3.59) < 0.001 ApoA-I 1.10(0.96~1.25) 1.05(0.95~1.19) < 0.001 1.07(0.96~1.22) 1.07(0.96~1.19) 0.409 ApoB 0.74(0.63~0.86) 0.84(0.74~0.96) < 0.001 0.72(0.63~0.87) 0.84(0.74~0.96) < 0.001 ApoE 3.89(3.22~4.69) 4.32(3.55~5.46) < 0.001 3.81(3.10~4.78) 4.34(3.58~5.38) < 0.001 Lpa 7.88(4.29~16.85) 7.4(3.8~15.18) 0.037 7.70(4.25~16.35) 7.7(3.8~15.3) 0.532 AHI 1.4(0.5~2.9) 40.9(18.7~62.1) < 0.001 1.85(0.60~3.40) 38.9(17.8~61.2) < 0.001 Mean SaO2 97(96~97) 94(92~95.8) < 0.001 97(96~97.45) 94(92~95.7) < 0.001
Minimum SaO2 94(91~96) 78(68~85) < 0.001 94(91~96) 79(68~85) < 0.001
ODI 1.6 (0.6~3.5) 41.2(18.13~63.5) < 0.001 1.8(0.7~3.5) 38.2(18.2~63) < 0.001 MAI 11.8(7.6~19.1) 25(13.2~43.78) < 0.001 12.8(8.05~20.43) 25.7(13.8~45.2) < 0.001 The data are presented as means and standard deviation; skewed data are presented as the median (IQR), and categorical data as the number (percentage) Differences in the baseline characteristics among the two groups were examined using independent samples t test or Mann–WhitneyUtest for continuous variables and chi-square test or Fisher’s exact test for categorical variables
Table 1. No obvious differences were found between the two OSA groups or two non-OSA groups in terms of demographic characteristics. Patients in both OSA groups were older, more obese, and had poorer meta-bolic profiles and sleep variables, aside from ApoA-I
and Lp(a) in the validation group (Table1).
Factor selection for the predictive model
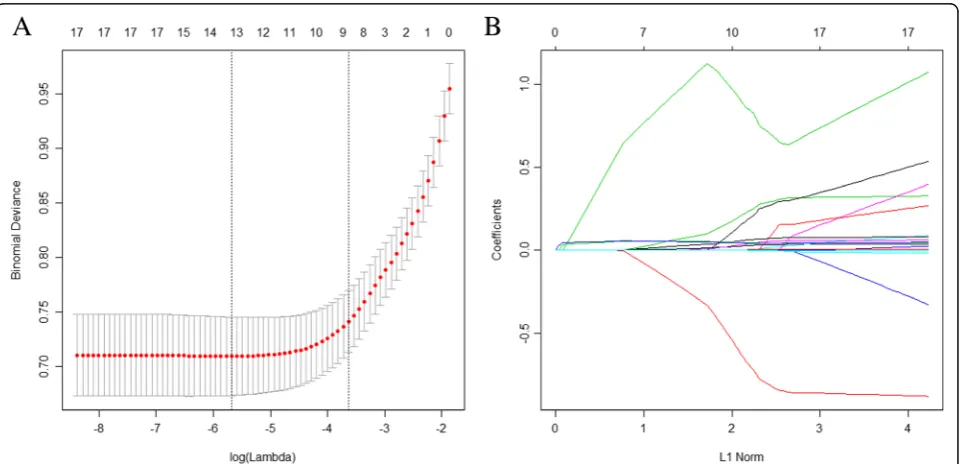
The LASSO method is suitable for regression of highly di-mensional data, as it can be used to extract the most im-portant predictive factors from a primary dataset. In this study, a risk score was calculated for each subject via a lin-ear combination of factors that were weighted by their co-efficients. Eighteen variables were reduced to eight potential predictors using the LASSO regression model.
Then, a coefficient profile plot was produced (Fig. 1a). A
cross-validated error plot of the LASSO regression model
is shown in Fig.1b. The most regularized and
parsimoni-ous model, with a cross-validated error within 1 standard error of the minimum, included eight variables. The path of the coefficients included in this model, with varying
log-transformed lambda values, is shown in Fig. 1b. The
model incorporated eight independent predictors (age, sex, glucose, ApoB, insulin, BMI, NC, and WC) and was
developed as a simple-to-use nomogram (Fig.2).
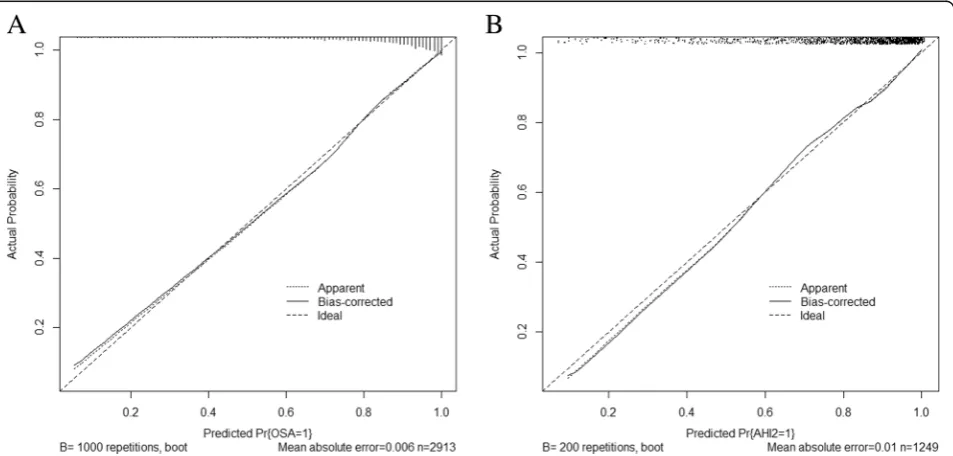
Validation of the nomogram
Validation of the nomogram was performed with a 1000 bootstrap analysis. In terms of the prediction of OSA,
the C-index for the nomogram was 0.839 in the train-ing group. In the validation group, the C-index was 0.820, which exceeded 0.7 and thus indicated that the model is suitable and sufficiently accurate for patients with OSA. The calibration plots demonstrated an excel-lent correlation between observed and predicted OSA
in both the training (Fig. 3a) and validation groups
(Fig.3b).
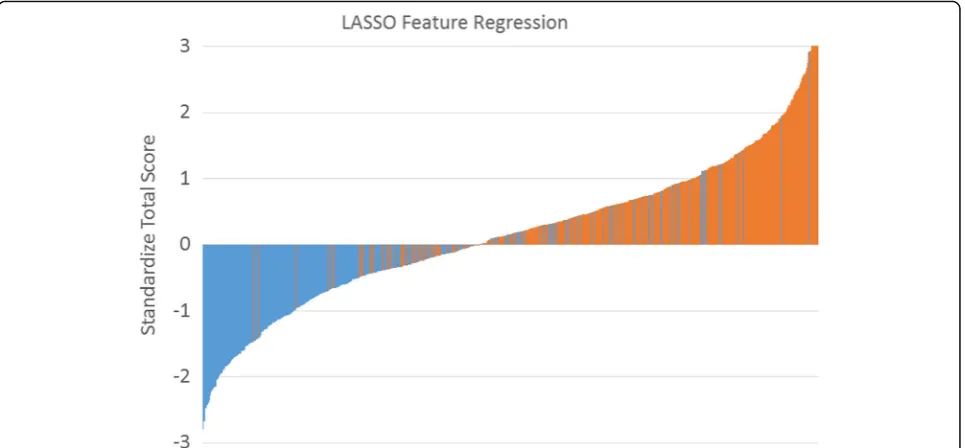
LASSO feature regression model
We established a LASSO feature regression model to visualize the differences between OSA and non-OSA dir-ectly. The cutoff point to distinguish OSA from non-OSA was 137.2 (which was calculated from the nomo-gram). All patients had a nomogram score, which were standardized using the following formula: (nomogram
score−137.2)/standard deviation. The y-axis represents
the calculated value; the x-axis represents each patient (green bars are non-OSA and red bars are OSA). In our study, we included more OSA participants than non-OSA participants; thus, too many subjects with non-OSA re-sulted in the accumulation of colored blocks. So we ran-domly selected 537 OSA and with 537 non-OSA patients together to establish the LASSO feature regression model
(Fig.4). We also used this nomogram to distinguish OSA
from non-OSA, non-moderate to severe and non-severe OSA using AHI cutoffs of 5, 15 and 30 events/hour. The ROC curves showed that the optimum diagnostic cutoff
point for the nomogram was relatively good (AUC = 0.84,
AUC = 0.80, and AUC = 0.78 respectively, Table2).
An example for nomogram usage
To help new users understand how to proceed with this nomogram, we took one severe patients with OSA (AHI =
43.5 events per hour) for example (Table 3). This subject
is male, 51 years old, with mean of glucose, ApoB, insulin,
BMI, NC, and WC 5.26 mmol/L, 1.02 g/L, 14.21μU/mL,
26.03 kg/m2, 40 cm, 95 cm, respectively. According to this nomogram, the total number of points for such a person is 158.5 (>cutoff of 137.2). This means this person referred
Fig. 2Our simple-to-use nomogram established for predicting OSA. The nomogram was developed in the training group by incorporating the following eight parameters: age (years), sex (0 = male; 1 = female), glucose (mmol/L), ApoB (g/L), insulin (μU/mL), BMI (kg/m2), NC (cm), and WC (cm). OSA, obstructive sleep apnea; ApoB, apolipoprotein B; NC, neck circumference; WC, waist circumference; BMI, body mass index
to our sleep center, 96% risk to be OSA. He will be ar-ranged to PSG monitoring earlier.
Discussion
In this study, we developed and validated an easy-to-use nomogram as a new approach to diagnose OSA in a large clinical sample. The nomogram incorporates eight items: age, sex, glucose, ApoB, insulin, BMI, NC, and WC. To our knowledge, this is the first study to establish an ob-jective model, including common demographic, anthropo-metric, and biochemical variables, to distinguish OSA from non-OSA. The nomogram showed good accuracy and discrimination.
In total, 18 candidate variables were used for construc-tion of the nomogram, which was reduced to eight po-tential predictors using the LASSO regression method. LASSO is suitable for analyzing large sets of clinical fac-tors and avoids overfitting [20]. Our nomogram sug-gested that obesity and presence of a glucose metabolic disorder may be good predictors of OSA. Furthermore, the nomogram may serve as a useful tool for optimal identification of patients at high risk for OSA. Thus,
therapeutic decisions will be better informed and the likelihood of early intervention for high risk patients would be increased, particularly in clinics lacking standard PSG equipment.
Luo M, et al. also established nomogram encompasses lots of subjective variables through an ordinal logistic regression procedure [21]. They found that the discrim-ination accuracies of this nomogram for non-OSA, moderate-severe OSA, and severe OSA were 83.8, 79.9, and 80.5%, respectively. Our study has a bit lower sen-sitivities, but with similar AUC (nearly 0.8). The biggest difference from the above-mentioned research is our study used objective parameters which could be avoid-ing bias caused by questionnaire recalled by patients. Besides, our study also had some advantages such as using LASSO regression for analyzing clinical factors, 10-fold subjects than previous study and had validation group. Other studies also used clinical nomograms to calculate AHI and even estimate median survival time/
event-free survival [7, 22]. We will also extend the
usage of nomograms in OSA in further prospective studies.
Fig. 4The LASSO feature regression. Standardized total score for each participant in the training group. Green bars represent scores for subjects without OSA, and red bars represent scores for those with OSA
Table 2The efficiency of nomogram for detecting OSA
AUC Sensitivity Specificity Positive likelihood ratio (+LR)
Negative likelihood ratio (−LR)
PPV NPV
> 5 0.84 (0.83–0.86) 0.77 (0.76–0.79) 0.76 (0.72–0.80) 3.22 (3.10–3.40) 0.30 (0.30–0.40) 0.93 (0.92–0.94) 0.43 (0.41–0.46) > 15 0.80 (0.79–0.82) 0.75 (0.730–0.77) 0.72 (0.69–0.75) 2.66 (2.50–2.80) 0.35 (0.30–0.40) 0.83 (0.82–0.85) 0.60 (0.58–0.62) > 30 0.78 (0.76–0.79) 0.73 (0.71–0.76) 0.69 (0.66,0.71) 2.34 (2.20–2.50) 0.39 (0.30–0.40) 0.70 (0.68–0.71) 0.73 (0.71–0.74) Data in parentheses are 95% CIs
OSA remains underdiagnosed and undertreated in clinical settings, given the substantial burden that it con-fers. Thus, several questionnaire-based prediction tools for OSA have been developed and validated. For ex-ample, in a recent meta-analysis, the sensitivity (specifi-city) of the BQ, SBQ, STOP, and ESS for detecting mild OSA was 76% (59%), 88% (42%), 87% (42%), and 54% (65%), respectively; for moderate OSA, the correspond-ing values were 77% (44%), 90% (36%), 89% (32%), and 47% (62%); and for severe OSA they were 84% (38%), 93% (35%), 90% (28%), and 58% (60%) [12]. Although the SBQ seems to be more accurate than the other three questionnaires for screening OSA, its relatively low spe-cificity limits its clinical utility [12]. One study assessed the ability of a simple, two-part questionnaire to predict OSA in a clinical setting; it showed high sensitivity (96.6%) but relatively low specificity (40.4%) [23]. How-ever, the sample size (128 patients) in that study was relatively small. Shah et al. established a predictive model for sleep apnea that included age, BMI, snoring, and sex, and had a sensitivity of 0.77 and specificity of 0.75 [24]. However, a portable PSG rather than stand-ard PSG was used in the Hispanic Community Health Study/Study of Latinos (HCHS/SOL) study, which may therefore have underestimated the severity of sleep apnea and also did not assess sleep stage, duration, or fragmentation (as noted by the authors [24]. The NoSAS score, a new screening tool that encompasses NC, BMI, snoring, age, and sex, was developed and validated in the HypnoLaus and EPISONO sleep cohort studies [25]. The NoSAS score seems marginally superior versus the BQ and ESS; however, its sensitivity and specificity are also low. Our objective nomogram seemed to perform better than traditional subjective questionnaires, however, this
conclusion needs to be treated with caution because of had no validation in other ethnic groups.
Our study was performed according to previously de-scribed screening principles (WHO, 1968). We employed a rigorous methodology and an appropriate cross-sectional study design. Although our study had strengths, such as a large sample size, and all samples were evaluated by stand-ard PSG, certain limitations should also be addressed. First, we only used demographic, anthropometric, and bio-chemical data to establish the nomogram; however, OSA is also affected by genetic factors, as evidenced by genome-wide association studies, and we did not consider genomic characteristics. Second, although our nomogram was de-veloped in the context of a large sample size, and internal validation and external validation were performed, it has not been validated in different ethnic groups and popula-tions. Third, the validation group was derived from the same institution as the training group, which makes it dif-ficult to generalize the results to other populations. There-fore, we plan to externally validate our predictive model at other institutions. Fourth, the prevalence of OSA in our sleep center is higher than that in the general population; this high prevalence of OSA may have affected our evalu-ation of the predictive parameters by inflating their posi-tive predicposi-tive value. Fifth, the assessment of biochemical variables raises concerns in term of money, time, and ef-fort when compared with simple screening questionnaires. Lastly, the use of AASM 2007 scoring rules was not justi-fied and could also be one of the potential limitations of our study.
Conclusions
In conclusion, our simple-to-use nomogram, which in-corporates demographic, anthropometric, and biochem-ical parameters, is considered to be a convenient tool for identifying undiagnosed OSA. This intuitive risk assess-ment tool may be useful for high-risk OSA subjects in clinical settings.
Additional file
Additional file 1:Introduction of and how to perform LASSO regression method (described by Pripp AH, et el’s study). (DOCX 18 kb)
Abbreviations
AHI:Apnea-hypopnea index; ApoA-I: Apolipoprotein A-I; ApoB: Apolipoprotein B; AUC: Area under the curve; BMI: Body mass index; ESS: Epworth Sleepiness; HC: Hip circumference; LASSO: Least absolute shrinkage and selection operator; Lp(a): Lipoprotein (a); NC: Neck circumference; OSA: Obstructive sleep apnea; PSG: Polysomnography; ROC: Receiver operating characteristic; SBQ: STOP-Bang questionnaire; Scale BQ: Berlin questionnaire; WC: Waist circumference
Acknowledgements
The authors thank the medical and nursing staff of Department of Otolaryngology Head and Neck Surgery & Center of Sleep Medicine, Shanghai Jiao Tong University Affiliated Sixth People’s Hospital.
Table 3an example of our simple-to-use nomogram usage
Characteristics Person
Value Points
age (years) 51 17.5
sex (0 = male; 1 = female) 0 12.5
glucose (mmol/L) 5.26 18
ApoB (g/L) 1.02 20
insulin (μU/mL) 14.21 12.5
BMI (kg/m2) 26.03 28
NC (cm) 40 12
WC (cm) 95 38
Total number of pointsa (−) 158.5 Person: patients with severe OSA (AHI = 43.5 events per hour), male, 51 years old, with mean of glucose, ApoB, insulin, BMI, NC, and WC 5.26 mmol/L, 1.02 g/L, 14.21μU/mL, 26.03 kg/m2, 40 cm, 95 cm, respectively
OSAobstructive sleep apnea,ApoBapolipoprotein B,NCneck circumference, WCwaist circumference,BMIbody mass index
a
Funding
This study was supported by grants-in-aid from the following funds: National Key R&D Program of China (2017YFC0112500); National Natural Science Foundation of China (81770987, 81700896, 81701306, 81770988); Shanghai Sailing Program (17YF1414300); Innovation Program of Shanghai Municipal Education Commission (2017-01-07-00-02-E00047); multi-center clinical research project from school of medicine, Shanghai Jiao Tong University (DLY201502) and Shanghai Shen-Kang Hospital Management Center Project (SHDC12015101). The funding bodies had no role in the design of the study and collection, analysis, and interpretation of data and in writing the manuscript.
Availability of data and materials
The datasets used and/or analysed during the current study are available from the corresponding author on reasonable request.
Authors’contributions
The authors take responsibility and vouch for the accuracy and completeness of the data and analyses. SY, JG and HY had full access to all of the data in the study and took responsibility for the integrity of the data and the accuracy of the data analysis. Study design: HX, JG, HY and SY; Data collection: HX, XZ, XL, YQ, JG, HY, and JZ; Statistical analysis: HX, JG, HY, HH, YS; Manuscript draft: HX, JG, HY and SY. All authors have seen and approved the manuscript.
Ethics approval and consent to participate
The study was conducted according to the World Medical Association Declaration of Helsinki in 1975, as revised in 1983, and was approved by the Ethic Committee of Shanghai Jiao Tong University Affiliated Sixth People’s Hospital. All subjects provided their informed written consent.
Consent for publication Not applicable.
Competing interests
The authors declare that they have no competing interests.
Publisher’s Note
Springer Nature remains neutral with regard to jurisdictional claims in published maps and institutional affiliations.
Author details
1
Department of Otolaryngology Head and Neck Surgery & Center of Sleep Medicine, Shanghai Jiao Tong University Affiliated Sixth People’s Hospital, Yishan Road 600, Shanghai 200233, China.2Otolaryngological, Institute of Shanghai Jiao Tong University, Yishan Road 600, Shanghai 200233, China.
3
Shanghai Key Laboratory of Sleep Disordered Breathing, Shanghai Jiao Tong University Affiliated Sixth People’s Hospital, 600 Yishan Road, Shanghai 200233, China.4Department of Epidemiology, School of Public Health, Shanghai Jiao Tong University, 225South Chongqing Road, Shanghai 200020, China.
Received: 25 June 2018 Accepted: 7 January 2019
References
1. Jordan AS, McSharry DG, Malhotra A. Adult obstructive sleep apnoea. Lancet. 2014;383(9918):736–47.
2. Martinez-Garcia MA, Capote F, Campos-Rodriguez F, Lloberes P, Diaz de Atauri MJ, Somoza M, Masa JF, Gonzalez M, Sacristan L, Barbe F, et al. Effect of CPAP on blood pressure in patients with obstructive sleep apnea and resistant hypertension: the HIPARCO randomized clinical trial. JAMA. 2013; 310(22):2407–15.
3. Tan X, van Egmond L, Chapman CD, Cedernaes J, Benedict C. Aiding sleep in type 2 diabetes: therapeutic considerations. Lancet Diabetes Endocrinol. 2018; 6(1):60–8.
4. Xu H, Yi H, Guan J, Yin S. Effect of continuous positive airway pressure on lipid profile in patients with obstructive sleep apnea syndrome: a meta-analysis of randomized controlled trials. Atherosclerosis. 2014;234(2):446–53. 5. Leng Y, McEvoy CT, Allen IE, Yaffe K. Association of sleep-disordered breathing
with cognitive function and risk of cognitive impairment: a systematic review and meta-analysis. JAMA Neurol. 2017;74(10):1237–45.
6. Fu Y, Xia Y, Yi H, Xu H, Guan J, Yin S. Meta-analysis of all-cause and cardiovascular mortality in obstructive sleep apnea with or without continuous positive airway pressure treatment. Sleep Breath. 2017;21(1):181–9.
7. Kendzerska T, Gershon AS, Hawker G, Leung RS, Tomlinson G. Obstructive sleep apnea and risk of cardiovascular events and all-cause mortality: a decade-long historical cohort study. PLoS Med. 2014;11(2):e1001599. 8. Young T, Palta M, Dempsey J, Skatrud J, Weber S, Badr S. The occurrence of
sleep-disordered breathing among middle-aged adults. N Engl J Med. 1993; 328(17):1230–5.
9. Peppard PE, Young T, Barnet JH, Palta M, Hagen EW, Hla KM. Increased prevalence of sleep-disordered breathing in adults. Am J Epidemiol. 2013; 177(9):1006–14.
10. Heinzer R, Vat S, Marques-Vidal P, Marti-Soler H, Andries D, Tobback N, Mooser V, Preisig M, Malhotra A, Waeber G, et al. Prevalence of sleep-disordered breathing in the general population: the HypnoLaus study. Lancet Respir Med. 2015;3(4):310–8.
11. Flemons WW, Douglas NJ, Kuna ST, Rodenstein DO, Wheatley J. Access to diagnosis and treatment of patients with suspected sleep apnea. Am J Respir Crit Care Med. 2004;169(6):668–72.
12. Chiu HY, Chen PY, Chuang LP, Chen NH, Tu YK, Hsieh YJ, Wang YC, Guilleminault C. Diagnostic accuracy of the Berlin questionnaire, STOP-BANG, STOP, and Epworth sleepiness scale in detecting obstructive sleep apnea: a bivariate meta-analysis. Sleep Med Rev. 2017;36:57–70.
13. Force USPST, Bibbins-Domingo K, Grossman DC, Curry SJ, Davidson KW, Epling JW Jr, Garcia FA, Herzstein J, Kemper AR, Krist AH, et al. Screening for obstructive sleep apnea in adults: US Preventive Services Task Force recommendation statement. JAMA. 2017;317(4):407–14.
14. Xu H, Guan J, Yi H, Zou J, Meng L, Tang X, Zhu H, Yu D, Zhou H, Su K, et al. Elevated low-density lipoprotein cholesterol is independently associated with obstructive sleep apnea: evidence from a large-scale cross-sectional study. Sleep Breath. 2016;20(2):627–34.
15. Bonora E, Targher G, Alberiche M, Bonadonna RC, Saggiani F, Zenere MB, Monauni T, Muggeo M. Homeostasis model assessment closely mirrors the glucose clamp technique in the assessment of insulin sensitivity: studies in subjects with various degrees of glucose tolerance and insulin sensitivity. Diabetes Care. 2000;23(1):57–63.
16. Iber C, Ancoli-Israel S, Chesson AL, Quan S. The AASM manual for the scoring of sleep and associated events: rules, terminology and technical specifications. Westchest IL Am Acad Sleep Med. 2007.
17. Friedman J, Hastie T, Tibshirani R. Regularization paths for generalized linear models via coordinate descent. J Stat Softw. 2010;33(1):1–22.
18. Sauerbrei W, Royston P, Binder H. Selection of important variables and determination of functional form for continuous predictors in multivariable model building. Stat Med. 2007;26(30):5512–28.
19. Wolbers M, Koller MT, Witteman JC, Steyerberg EW. Prognostic models with competing risks: methods and application to coronary risk prediction. Epidemiology. 2009;20(4):555–61.
20. Hepp T, Schmid M, Gefeller O, Waldmann E, Mayr A. Approaches to regularized regression - a comparison between gradient boosting and the lasso. Methods Inf Med. 2016;55(5):422–30.
21. Luo M, Zheng HY, Zhang Y, Feng Y, Li DQ, Li XL, Han JF, Li TP. A nomogram for predicting the likelihood of obstructive sleep apnea to reduce the unnecessary polysomnography examinations. Chin Med J. 2015;128(16):2134–40. 22. Bucca C, Brussino L, Maule MM, Baldi I, Guida G, Culla B, Merletti F, Foresi A,
Rolla G, Mutani R, et al. Clinical and functional prediction of moderate to severe obstructive sleep apnoea. Clin Respir J. 2011;5(4):219–26.
23. Fenton ME, Heathcote K, Bryce R, Skomro R, Reid JK, Gjevre J, Cotton D. The utility of the elbow sign in the diagnosis of OSA. Chest. 2014;145(3):518–24. 24. Shah N, Hanna DB, Teng Y, Sotres-Alvarez D, Hall M, Loredo JS, Zee P, Kim
M, Yaggi HK, Redline S, et al. Sex-specific prediction models for sleep apnea from the Hispanic Community Health Study/Study of Latinos. Chest. 2016; 149(6):1409–18.