Int. J. of Engg. Sci. & Mgmt. (IJESM), Vol. 6, Issue 2: April-June: 2016, 85-93
85INTERNATIONAL JOURNAL OF ENGINEERING SCIENCES
&
MANAGEMENT
PERFORMANCE ANALYSIS AND RECIRCULATION OF DIESEL ENGINE
EXHAUST GASES
1
Deepika Panthi* and
2Sohail Bux
1
Research Scholar,
2Professor,
1,2Department of Mechanical Engineering
Agnos College of Technology, Bhopal, Madhya Pradesh, INDIA.
*Corresponding Author’s Email ID: deepikapanthi@gmail.com
ABSTRACT
A diesel engine is an internal combustion engine that sparks a fuel spray at the starting of compression stroke by using highly compressed air. Diesel engine emission consists of gases such as Oxygen (O2), Carbon Monoxide
(CO), Carbon Dioxide (CO2), Nitrogen Oxide (NO), Nitrogen Dioxide (NO2), and Hydrocarbons (HC’s). An
exhaust gas analyzer can measure these parameters in percentage or ppm.Diesel fuel is a mixture of hydrocarbons which would produce only carbon dioxide (CO2) and water vapor (H2O).Also, diesel exhaust gases are primarily
composed of CO2, H2O and the unused portion of engine charge air. The objective of this paper is to do analysis of
engine performance and emissions analysis of the exhausted gases of diesel engines with Exhaust gas analyzer and recirculate them with EGR.
Keywords: Analysis, Diesel Engine Emission, Gas analyzer
INTRODUCTION
During this century, the world was facing environmental problems; air pollution is one of them. Air pollution leads to global environment problem. The combustion of fossil fuels i.e.
petroleum, coal, natural gas etc. results in global environment problems, involves global
warming, acid rain, climate change and ozone layer depletion.[1]
A diesel engine is a type of internal combustion engine. The meaning of word internal is inside and combustion means burning, thus an internal combustion engine is one where the fuel is burned inside the main part of the engine (the cylinders) and power is produced.
The diesel engine is the most efficient engine among all known types of internal combustion engines. Heavy trucks, urban buses, and industrial equipment are powered almost exclusively by diesel engines all over the world and diesel powered passenger cars are also increasingly popular. For the foreseeable future, the world’s transportation needs will continue to rely on the diesel engine and its gasoline counterpart. However, both engine technologies are evolving at an ever increasing pace to meet two major challenges: lower emissions and increased energy efficiency.
The exhaust gases from internal combustion engines are complex mixtures consisting oxidants of sulphur and nitrogen, products of complete of complete
combustion and derived compounds of fuel and lubricants. [2]
In the world most of the energy needs are fulfilled through petro-chemical sources, coal and natural gases, but these sources are finite and according to the current usage rates, they will be consumed shortly. Diesel fuels have an important function in the industrial transports and agricultural goods due to its low cost and high thermal efficiency. The largest producer of CO2 emissions are fossil fuels and the
significant use of fossil fuels is broaden the CO2
blanket over the Earth. This blanket subterfuge ultra-violet (UV) rays that has been originally received by the Earth from the Sun. With the increasing advances in technology, requirement of energy is changing accordingly. It is necessary to improve the efficiency with the consumption of natural resources, and enhance renewable alternatives to protect resources on which the requirements of present and future generations depend. The diesel industry is facing problems regarding particulate emission and to find methods to reduce particulate matter, such as NOx, smoke, HC and CO emissions.
Int. J. of Engg. Sci. & Mgmt. (IJESM), Vol. 6, Issue 2: April-June: 2016, 85-93
86 technology in terms of power, fuel economy andemissions. Diesel emissions are categorized as carcinogenic [4]. The stringent emission legislations are compelling engine manufacturers to develop technologies to combat exhaust emissions. To meet these emission regulations with competitive fuel economy, exhaust gas after-treatment and optimized combustion are necessary. However, it is still unresolved which concept will succeed considering production and economic feasibility [5]. Diesel engines are very popular power plants for decentralized power production in rural areas all over the world as well as for powering the farm equipment due to their fuel economy, ease of maintenance and robustness due to the reason that diesel engine posses high efficiency, durability and reliability at lower cost.[6]
1.1 AN OUTLOOK TO INDIAN AND GLOBAL SCENARIO OF DIESEL FUEL
1.1.1 INDIAN SCENARIO
India only produces diesel, which is designated as High Speed Diesel (HSD).The growth of the Indian economy has lead to increasing demand for energy for transportation and industry since the recent 10-15 years. As India is predominantly a diesel based economy, the demand for diesel has been increasing at a quick pace.India's consumption of High Speed Diesel in 2008-09 is estimated to be 15.9 billion gallons in 2008-09, which is up by 30% from 2004-05 consumption of 12.2 billion gallons.High Speed Diesel exports from India have grown substantially, with it jumping from 2.6 billion gallons in 2005-06 to 4.2 billion gallons in 2008-09, representing an increase of above 60%, exposing the exporting Indian refineries to the huge volatility in global prices.
1.1.2 GLOBAL SCENARIO
Globally, more than three-fourths of the distillate sales, as diesel are for transportation and only a little more than 10% is used for residential heating.US is the largest refiner of crude oil 3holding 20% of the total world refining capacity of 87,700 kilo barrels per calendar day, followed by China (8.9%), Former Soviet Union (8.8%), Japan (5.3%) and India (4.1%).However, the production of heating oil or diesel in any country depends on the type of economy it follows. For eg, while US has adopted a gasoline based economy, India is largely a diesel based economy, leading to more production and consumption of gasoline in US and High-Speed Diesel (HSD) in India.
1.2 BASICS OF EMISSION ANALYSIS
While running any internal combustion undesirable emissions are generated during the combustion process emphasis is given on reducing the emission coming out of an engine. The emissions which are exhausted into the surrounding pollute the atmosphere and causes various problems like global
warming, acid rain, smog, odours and respiratory hazards. Usually running an engine with diesel as fuel emission parameters are not specifically ideal that results in more emission of unburnt hydrocarbon HC and carbon monoxide CO and oxide of nitrogen NOx .
Retarded injection is an effective method employed in diesel engines for NOx control. However, this method leads to increased fuel consumption, reduced power, increased HC emissions and smoke. Water injection is another method for NOx control however this method enhances corrosion of vital engine components. In addition, it adds to the weight of the engine system because of requirement of a water storage tank. It is also difficult to retain water at a desired temperature during cold climate [7].
1.3 GAS ANALYZER
Gas analyzer is an instrument which is capable of analyzing the species of chemical gases is present in the sample. Not only it identifies the species but it also has capability to give measurement value of the quantity which it displays either in numerical form. [8]
In various engine types, exhaust gas levels are analyzed at the tailpipe and indicate unburned Oxygen, hydrocarbon, carbon monoxide, oxides of nitrogen, oxides of sulphur and represent a lean air/fuel mixture.The measurement of these gases is represented either in terms of ppm (parts per million) or percentage (%). Modern automobiles in good running order frequently show 10ppm or less.The level of CO2 as indicated in analyzer is a product of
combustion and represents the amount of fully burned fuel. Thus, a higher level of CO2 indicates
higher engine efficiency.
1.4 Exhaust Gas Recirculation
Int. J. of Engg. Sci. & Mgmt. (IJESM), Vol. 6, Issue 2: April-June: 2016, 85-93
87 efficiency, brake specific fuel consumption (BSFC)were calculated. Reductions in NOx and exhaust gas temperature were observed but emissions of particulate matter (PM), HC, and CO were found to have increased with usage of EGR. The engine was operated for normal running conditions with EGR and the performance and emission readings were observed.
Exhaust Gas Recirculation is an effective method for NOx control. The exhaust gases mainly consist of carbon dioxide, nitrogen, etc. and the mixture has higher specific heat compared to atmospheric air. Re-circulated exhaust gas displaces fresh air entering the combustion chamber with carbon dioxide and water vapor present in engine exhaust. As a consequence of this air displacement, lower amount of oxygen in the intake mixture is available for combustion. Reduced oxygen available for combustion lowers the effective air–fuel ratio. This effective reduction in air–fuel ratio affects exhaust emissions substantially. In addition, mixing of exhaust gases with intake air increases specific heat of intake mixture, which results in the reduction of flame temperature. Thus combination of lower oxygen quantity in the intake air and reduced flame temperature reduces rate of NOx formation reactions [9] and [10]. The EGR (%) is defined as the mass percent of the recirculated exhaust (MEGR) in the total intake mixture (Mi).
Desantes et al. used Non-Dispersive Infrared Detector (NDIR)-based CO2 concentration
measurement at the intake ([CO2]int) and exhaust
manifold ([CO2]exh) for the determination of EGR
rate [11].
The engines using EGR emit lower quantity of exhaust gases compared to non-EGR engines because part of the exhaust gas is re-circulated.
In the process of exhaust gas recirculation, a portion of exhaust gases is passes through an EGR control valve and to EGR cooler, which is then proceeds to a throttle valve assembly where mixing of filtered, high pressure, fresh combustion air and exhaust gases takes place. This mixture is then enters in the engine through the Inlet valve. [12]
PROPOSED WORK
2.1 PROJECT OBJECTIVES
The project objectives includes-
To analyze different gases emitted from diesel engine. The exhaust gases from internal combustion engines are complex mixtures consisting oxidants of sulphur and nitrogen, unburnt products of complete
combustion and derived compounds of fuel and lubricants.
To study and done the evaluation of the performance on characteristics curves after recirculation of exhaust gases.
MATERIALS AND METHODS
3.1 PERFORMANCE PARAMETERS [13]
3.1.1 INDICATED POWER (I.P.)
Indicated Power is the amount of fuel consumed for each unit of brake power per hour. It indicates the efficiency with which the engine develops the power from fuel. It is used to compare performance of different engines.
Where, IP = indicated power (kW)
= indicated mean effective pressure (N/m2)
L = length of stroke (m)
A = cross-sectional area of piston (m2)
n = number of power strokes
n=N/2 for four strokes, and n=N for two-stroke
N = crankshaft speed (revolutions per minute) K = number of cylinders
3.1.2 BRAKE POWER (B.P.)
Brake power is the output power measured at the engine crankshaft. Brake power is also termed as Shaft power or Delivered power.
Where, BP = Brake power (kW)
= brake mean effective pressure (N/m2)
L = length of stroke (m)
A = cross-sectional area of piston (m2)
n = number of power strokes
n=N/2 for four strokes, and n=N for two-stroke
N = crankshaft speed (revolutions per minute) K = number of cylinders
3.1.3 HEAT SUPPLIED BY FUEL
It is the thermal power released by burning fuel inside the engine. It is the product of mass of fuel burned per second and calorific value of the fuel.
3.1.4 SPECIFIC FUEL CONSUMPTION (ISFC) 3.1.4(a) INDICATED SPECIFIC FUEL CONSUMPTION (ISFC)
Int. J. of Engg. Sci. & Mgmt. (IJESM), Vol. 6, Issue 2: April-June: 2016, 85-93
88 Specific fuel consumption is defined as fuel flow rateper unit power output. It is the measure of how efficiently the fuel supplied to the engine is used to produce power. Since for a given power level, less fuel is consumed, thus low value of specific fuel consumption is desirable.
In case of Indicated power, Indicated specific fuel consumption is given by,
In case of Brake power, brake specific fuel consumption is given by,
3.1.5 INDICATED THERMAL EFFICIENCY ( )
Indicated thermal efficiency is the ratio of energy in the indicated power to the input fuel energy in appropriate units.
Where, ip= indicated power (kJ/s)
h=heat supplied by fuel or Energy in fuel (kJ/s)
3.1.6 BRAKE THERMAL EFFICIENCY ( )
Brake thermal efficiency is the ratio of energy in the brake power to the input fuel energy in appropriate units.
Where, bp= brake power (kJ/s)
h=heat supplied by fuel or Energy in fuel (kJ/s)
3.1.7 MECHANICAL EFFICIENCY
Mechanical efficiency is defined as the ratio of brake power (delivered power) to the indicated power (power provided by piston).
Where, = frictional power = – 3.1.8 VOLUMETRIC EFFICIENCY
Volumetric efficiency is defined as the ratio of actual volume flow rate of air into the intake system to the rate at which the volume is displayed by the system.
Where, density at inlet
= number of intake stroke per minute
=N/2 (for four- stroke engine) N= speed of the engine (rev/min)
= Swept volume
3.1.9 SWEPT VOLUME
Where, D= diameter of bore of engine L= stroke of engine
n= n = number of power strokes n=N/2 for four strokes, and n=N for two-stroke
N = crankshaft speed (revolutions per minute) K = number of cylinders
3.1.10 TORQUE
Where, = Torque (N-m)
P= power (kW)
N= speed of crankshaft (rpm)
4. RESULTS AND CONCLUSION 4.1 PERFORMANCE CURVES
4.1.1 Carbon Monoxide (CO) Emissions-
The variations of carbon monoxide emissions at different loads are shown below. With increase in loads, reduction in emission of carbon monoxide can be observed.
0 500 1000 1500 2000 2500 3000 3500 4000 4500
5 10 15 20 25
DIESEL FUEL
DIES…LOAD
(N-m)
C
Int. J. of Engg. Sci. & Mgmt. (IJESM), Vol. 6, Issue 2: April-June: 2016, 85-93
89 4.1.2 Carbon dioxide (CO2) Emissions-The variation of carbon dioxide emissions at different loads are shown below. It is observed that emission increases with increase in loads. After recirculation of gases exhausted after combustion, emission of carbon dioxide is somewhat decreases.
0 500 1000 1500 2000 2500 3000 3500 4000
5 10 15 20 25
WIT HOU T …
LOAD
(N-m)
C
O
2 ( p p m )4.1.3 Oxides of Nitrogen (NOx) Emissions- Characteristic curve shown below indicates the variation in oxides of nitrogen (NOx) emission with varying loads. After recirculation of exhaust gases, sudden decrement in emission of oxides of nitrogen is observed at higher loads.
0 50 100 150 200 250 300 350 400 450
5 10 15 20 25
WIT HOU T EGR
LOAD(
N-m)
N
O
x
( p p m )4.1.4 Hydrocarbon (HC) Emissions-
The variation of hydrocarbon can be seen in the following characteristic curve at different loads. The value of unburnt hydrocarbon decreases significantly from 290ppm to 140ppm at initial load condition as a result of cooling of exhaust gases in recirculation system. 0 50 100 150 200 250 300 350
5 10 15 20 25
WIT HOU T …
LOAD
(N-m)
H
C
( p p m ) 4.1.5 Oxides of Sulphur (SOx) Emissions-
Characteristic curve shown below indicates the variation in oxides of sulphur (SOx) emission with varying loads. However, emission decreases from 138 ppm to 38 ppm with increase in load from 5 N-m to 2 5N-N-m, but this range of oxides of sulphur in diesel are harmful for the environment because they prevent the use of catalytic diesel particulate filters to control diesel particulate emissions.
0 20 40 60 80 100 120 140 160
5 10 15 20 25
WIT HOU T EGR
LOAD
(N-m)
S
O
x
(p p m)4.1.6 Oxygen (O2) Emissions-
Int. J. of Engg. Sci. & Mgmt. (IJESM), Vol. 6, Issue 2: April-June: 2016, 85-93
90 0 2000 4000 6000 8000 10000 12000 140005 10 15 20 25
WIT HO U…
LOAD
(N-m)
O
2 (p p m )4.1.7 Smoke Density-
The variations of smoke density for different rated loads are shown in the following curve. The smoke density is increasing with increase of load. After recirculation percentage of smoke emitted is increased from 53% to 64%, which is considerable.
0 10 20 30 40 50 60 70
5 10 15 20 25
WIT HO U…
LOAD
(N-m)
SM
OK
E
% ACKNOWLEDGEMENTThis research was supported by RKDF University, Bhopal. I am thankful to my guide Prof. Sohail Bux, who provided expertise that greatly assisted the research. I am also grateful to other faculty members, who moderated this paper and in that line improved the manuscript significantly.
REFERENCES
1. U.S.Jyoti, K.Vijaya Kumar Reddy,”Effect on Performance, Combustion and Emissions of Diesel Engine with Varied Piston Bowl Geometry”, International Journal of Research in Mechanical Engineering, Volume 3, Issue 5, September-October,2015,pp. 22-27
2. Martin A. Elliott, Gerge J.Nebel and Fred G. Rounds, “ The Composition of exhaust gases from Diesel, Gasoline and Propane
Powered Motor Coaches” 48 Annual Meeting of the air pollution control Association,Detroit,Michigan,May 22-26,1955,pp.103-108
3. Yalavarthi Sateesh 1, .Chintalapudi Anil Kumar 2 and Dev Satya , “Performance and Emission Analysis of Diesel Engine Using Oxygenated compounds”, International Journal of Advanced Science and Technology Vol.61, (2013), pp.9-16’ 4. Stewart K.M., Health effects of diesel
exhaust. Report from American Lung Association of Pennsylvania, 2001.
5. Moser F.X., Sams T., Cartellieri W., “Impact of future exhaust gas emission legislation on the heavy duty truck engine”, JSAE 2001-01-0186, 2001.
6. Resitoglu Ibrahim Aslan, Altinisik Kemal, Keskin Ali, “The pollutant emissions from diesel engine vehicles and exhaust aftertreatment system”, Springerlink.com, 11 june,2014.
7. Pradeep V., Sharma R.P., “Use of hot EGR for NOx control in a compression ignition engine fuelled with bio-diesel from Jatropha Oil and Renewable Energy”, 32 (7) (2007), pp. 1136–1154
8. Ury AllenB, “8 Advantages of Diesel Engines”,
http://news.wyotech.edu/post/2012/03/8-
advantages-of-diesel-engines/#.VsQcDLR95kg, Mar 6, 2012 9. Thomas Sibu 1 , Haider Nishi Shahnaj 2,
“A Study on Basics of a Gas Analyzer”, International Journal of Advanced Research in Electrical, Electronics and Instrumentation Engineering (An ISO 3297: 2007 Certified Organization) Vol. 2, Issue 12, December 2013
10. Ladommatos N., Balian R.,. Horrocks R, Cooper L., “The effect of exhaust gas recirculation on soot formation in a high-speed direct-injection diesel engine”, in: SAE 960841, 1996.
11. Abd-Alla G.H., “Using exhaust gas recirculation in internal combustion engines: a review”,Energy Convers. Manage., 43 (2002), pp. 1027–1042
12. MAN, 2011. “Tier III Compliance - Low Speed Engines”, MAN Diesel & Turbo,
Copenhagen, Denmark,
http://www.mandieselturbo.com/files/news/f ilesof15014/5510-0088-00ppr_low.pdf 13. Ganeshan V.,(2012) “Internal Combuation
Engines”, 4th edition, published by Tata
Int. J. of Engg. Sci. & Mgmt. (IJESM), Vol. 6, Issue 2: April-June: 2016, 85-93
91Table I: Engine specifications
Engine Diesel engine
Type 4 cylinder 4 stroke
Engine Speed 2000 rpm
Swept Volume (cc) 33490 cc
Cylinder Bore 80 mm
Stroke Length 100 mm
Compression Ratio 8:10
Table II: Summary of Experimental results at Loads
SPEED OF THE
ENGIN E (rpm)
LOAD/ TORQU
E (N-m)
CO (ppm )
CO2
(ppm) Withou t EGR
CO2
(ppm ) With EGR
NOx (ppm) Withou t EGR
NOx (ppm)
With EGR
HC (ppm) Witho
ut EGR
HC (pp
m) With EGR
SOx (ppm) Without
EGR
O2
(ppm) Withou t EGR
O2
(ppm ) With EGR
SMOK E (%) Without
EGR
SMOK E (%) With EGR
2000 5 3989 2200 1875 43 36 290 140 138 11000 7000 2 8
2200 10 2804 2600 2390 47 40 240 130 90 12000 6000 17 22
2100 15 2409 2800 2500 152 51 210 90 72 9000 5100 24 37
2000 20 1936 3300 2800 295 99 170 70 62 9000 4700 36 53
Int. J. of Engg. Sci. & Mgmt. (IJESM), Vol. 6, Issue 2: April-June: 2016, 85-93
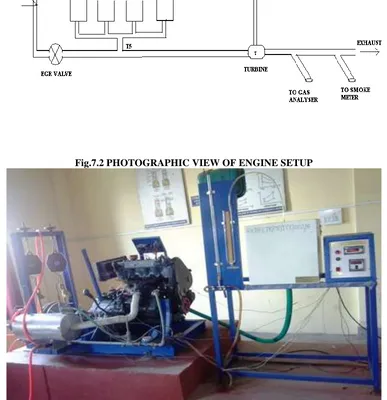
92Fig. 7.1 BLOCK DIAGRAM OF EXPERIMENTAL SETUP
Int. J. of Engg. Sci. & Mgmt. (IJESM), Vol. 6, Issue 2: April-June: 2016, 85-93
93Fig.7.3 GAS ANALYZER KIT