Research Article
CODEN: IJPNL6
SYNTHESIS OF A PRODRUG OF ACECLOFENAC AND ITS METHOD
DEVELOPMENT BY UV-SPECTROSCOPY
Niti Bhardwaj
1, P. Ahuja
2, Farah Iram
2, Asif Husain
2*
1
Department of Pharmaceutical Science, Bhagwant University, Ajmer-305004, Rajasthan, India
2
Department of Pharmaceutical Chemistry, Faculty of Pharmacy, Jamia Hamdard, New
Delhi-110062, India
*Corresponding author e-mail:
[email protected], [email protected]
ABSTRACT
An ester-based prodrug (2) of aceclofenac was synthesized using N-hydroxymethylsuccinimide (1) as promoiety and its structure established on the basis of IR, NMR and Mass spectral data. An analytical, rapid, cost-effective and accurate method using UV-spectroscopy has been developed for the synthesized prodrug (2). The value of R square obtained shows that the developed method is rapid, easy and precise.
Keywords: NSAIDs, UV, Method Development, Prodrugs
INTRODUCTION
A prodrug is defined as a biologically inactive derivative of a drug candidate that requires a chemical or enzymatic transformation within the body to release the active drug, and has improved delivery properties over the parent molecule[1,2]. Prodrug design is an important and fruitful area of medicinal chemistry research[1-4]. Non steroidal anti inflammatory drugs (NSAlDs) are used primarily to treat inflammation, mild to moderate pain and fever. The diverse uses of NSAIDs comprise the treatment
of headache, arthritis, gout, inflammatory
arthropathies, dysmenorrhoea, sports injuries, migraine, post-operative pain, tissue injury, sciatica and rheumatism. NSAIDs structurally consist of an acidic moiety which is represented by a carboxylic acid group, an enolic group, a hydroxamic acid group and a sulphonamide or tetrazole ring[5,6]. The centre of acidity is attached to a planar aromatic or hetero aromatic ring of NSAIDs. The anti inflammatory activity depends on the acidic centre attached to the planar aromatic or hetero aromatic ring. The lipophilicity of NSAIDs is due to the formation of alkyl chain or additional aromatic ring attached to the planar moiety[6].
NSAIDs with free carboxylic group produce gastrointestinal side effects like gastric irritation, ulceration, bleeding and perforation[7,8]. Aceclofenac is one of the non-steroidal anti-inflammatory drugs (NSAIDs) having good anti-inflammatory actions; several prodrugs of aceclofenac have shown improved therapeutic profile[9-11]. In view of this, it was planned to mask the free carboxylic acid group of aceclofenac in order to reduce its GIT side effects. Analytical method development and validation play important roles in the discovery, development, and manufacture of pharmaceuticals. Therefore, a prodrug of aceclofenac was synthesized and an
analytical method developed by
UV-spectrophotometric method as per ICH guidelines.
EXPERIMENTAL
Materials and Methods
All other chemicals and solvents used were commercially procured from various chemical units like E.Merck (India) Ltd. and S.D.Fine. Melting points were taken in open capillary tubes and are uncorrected. Dry solvents were used throughout the study. 1H-NMR spectrum was recorded on Bruker spectropsin DPX-300MHz with tetramethylsilane as internal standard in solvent CDCl3. Mass spectrum
International Journal of Pharmacy
was recorded on a Jeol JMS-D 300 instrument fitted with a JMS 2000 data system at 70 eV. Spectral data are consistent with the assigned structures. Microanalysis of the compounds was done on Perkin-Elmer model 240 analyzer and the values were found within ±0.4% of the theoretical values. For method
development, Spectrum SP2000UV (UV
spectrophotomete) was used. Whatmann paper no. 1 was used for vacuum filtration. The progress of the reaction was monitored on TLC, which was performed on silica gel (Merck No. 5554) in the solvent systems; Benzene: Acetone (9:1). Iodine chamber and UV-lamp were used for visualization of TLC spots.
Synthesis
Synthesis involved is a two step process:
Step 1: Synthesis of N-Hydroxymethylsuccinimide (1)
A solution of succinimide (1 gm) and formaldehyde in water was refluxed for 5 h. The solvent was removed under reduced pressure and the oily residue obtained was crystallized from ether/petroleum ether to give a TLC pure crystalline compound, m.p 57-58° C.
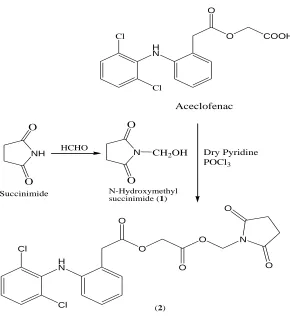
Step 2: Synthesis of prodrug (2)
A mixture of aceclofenac (4mmol; 1.417 g) and N
-Hydroxymethylsuccinimide (equimolar, 4mmol;
0.516 g) in dry pyridine (5 mL) in the presence of phosphorus oxychloride (0.5 mL) was stirred for 5 h maintaining the temperature below 5 °C. After completion of the reaction the reaction mixture was left overnight, then the contents poured into ice cold water in small portions while stirring. A solid mass separated out which was filtered, washed with water, dried and crystallized from methanol to give pure
compound, m.p. 96 °C. Rf value 0.79
(benzene:acetone, 9:1).
Analytical method development process[12,13] Prodrug (2) (100 mg) was dissolved in methanol and phosphate buffer (pH 7.4) was added and the volume was made upto 100 mL. This was stock solution with concentration of 1mg/mL. It was further diluted with various solvents and the absorbance was observed in order to prepare calibration curves. Solutions of concentration of 10-100 µg/mL were prepared and scanned at 200-400nm in UV-spectrophotometer. From the different absorbance values obtained the wavelength selected was 289nm for the synthesized
Step 1: Synthesis of N-Hydroxymethylsuccinimide (1)
Succinimide was reacted with formaldehyde to get compound (1). IR spectral data (KBr/νmax cm-1): 1423 (O-H), 3057 (Ar C-H), 1664 (C=O, ketone). 1H NMR (δ in ppm): 2.76 (m, 4H, 2x CH2), 4.71 (s, 2H, CH2), 10.17 (s, 1H, OH).
Step-2: Synthesis of prodrug (2)
Aceclofenac was condensed with N
-Hydroxymethylsuccinimide (1) in dry pyridine in the presence of phosphorus oxychloride. Usual workup of the reaction mixture followed by crystallization from methanol furnished the prodrug (2). Its structure was established on the basis of IR, 1H-NMR and mass spectral data. IRspectral data (KBr/vmax cm-1): 3065 (Ar C-H), 1683 (C=O, ketone), 1518 (N-H, aromatic amine), 1312 (C-N, aromatic amine) 1301 (C-O, ester) 1094 (C-Cl).1H-NMR spectral data (δ in ppm): 2.69 (m, 4H, 2xCH2), 3.91 (s, 2H,CH2CO), 4.74 (s, 2H, CH2CO), 5.42 (s, 2H, CH2N), 6.23 (s, 1H, NH), 6.84-7.04 (m, 3H, ring A), 7.24-7.54 (m, 4H, ring B). Mass (m/z) 464 (M+), 465 (M+1), 466 (M+2). Elemental anal: calc for C21H18Cl2N2O6; C 54.21, H 3.90, N 6.02, found C 54.15, H 3.62, N 5.87.
Analytical method development process
After finding out the wavelength of the prodrug (2), which was observed to be 289nm, the compound was further subjected to the UV-spectroscopy method development. For this, 100mg of the prodrug was dissolved in methanol and phosphate buffer (7.4 pH) solution. The stock solution was prepared of concentration 1mg/mL. This stock solution was further divided into different concentrations of 5,10,15,25 and 35 mL and the solvents which were used to make up the volume upto 100mL were methanol, ethanol, dimethylsulphoxide (DMSO) and acetone.
through UV-Spectroscopy. Methanol emerged as the best solvent with R square value 0.9987 for the prodrug, and gave the very good calibration curve. Therefore, it could be a simple, rapid, cost-effective and less time consuming method for the newly synthesized prodrug (2).
Acknowledgement:
The authors are thankful to the Director, R V Northland Institute, Dadri, U.P., for helping in the experimental work.
NH O
O
N CH2OH
O
O
Succinimide
HCHO
N-Hydroxymethyl succinimide (1)
Cl
H N
Cl
O O
COOH
Aceclofenac
Dry Pyridine POCl3
Scheme 1: Synthetic protocol for the preparation of prodrug (2). H
N Cl
Cl
O
O N
O
O
O
O
(2)
Table 1: Absorbance data of the prodrug (2) in different solvents.
S. No. Conc. (µg/mL) Absorbance
Methanol Ethanol DMSO Acetone
1. 5 0.013 0.017 0.014 0.027
2. 10 0.047 0.035 0.044 0.055
3. 15 0.077 0.068 0.072 0.080
4. 25 0.140 0.117 0.145 0.150
0 0.05 0.1 0.15 0.2 0.25
0 5 10 15 20 25 30 35 40
concentration (microgram/ml)
A
bs
or
ba
nc
e
Calibration curve 1: In methanol (R square value: 0.9987)
0 0.02 0.04 0.06 0.08 0.1 0.12 0.14 0.16
0 5 10 15 20 25 30 35 40
concentration (microgram/ml)
A
bs
or
ba
nc
e
Calibration curve 2: In ethanol (R square value: 0.7888)
0 0.05 0.1 0.15 0.2 0.25
0 5 10 15 20 25 30 35 40
A
bs
or
ba
nc
0 0.05 0.1 0.15 0.2 0.25 0.3
0 5 10 15 20 25 30 35 40
concentration (microgram/ml)
A
bs
or
ba
nc
e
Calibration curve 4: Compound in Acetone (R square value: 0.8359)
REFERENCES
1. Rautio J, Kumpulainen H, Heimbach T, Oliyai R, Oh D, Jarvinen T, Savolainen J. Nat Rev Drug Discov, 2008; 7(3): 255-70.
2. Kristina MH, Raunio H, Rautio J Pharmacol Reviews, 2011; 63: 750-71.
3. Paul L. Nature, 2012; 481(7382): 455-6.
4. Kristina MH, Rautio J. Current Topics Med Chem, 2011; 11: 2265-87.
5. Sostres C, Gargallo CJ, Arroyo MT, Lanas A. Best Pract Res Clin Gastroenterol, 2010; 24(2): 121-32.
6. Day RO, Graham GG. BMJ, 2013; 346: f3195.
7. Lanas A, Ferrandez A. Chin J Dig Dis, 2006; 7(3): 127-33.
8. Bjarnason I, Hayllar J, MacPherson AJ, Russell AS. Gastroenterology, 1993; 104(6): 1832-47.
9. Husain A, Ahuja P, Shaharyar M, Ahmad A, Mkhalid IAI, Alam MM, Akhter M, Zaman MS. Med Chem Res,
2014; 23(3): 1077-83.
10.Makhija DT, Somani RR, Chavan AV. Ind J Pharm Sci, 2013; 75(3): 353-7.
11.Makhija DT, Somani RR. Der Pharmacia Lettre, 2010; 2(2): 300-9.
12.Susmitha A, Hepcy KD, Venkatesh P, RavindraRK. Int J Pharm Pharm Sci, 2013; 5(3): 150-3.