http://www.sciencepublishinggroup.com/j/ijsqa doi: 10.11648/j.ijsqa.20170304.12
ISSN: 2469-8156 (Print); ISSN: 2469-8164 (Online)
Research Article
Effect of Nutritional, Sensory and Texture Properties of
Jackfruit Seed (
Artocarpus Heterophyllus Lam.
) Flour Burfi
Nilanjana Nandlal Dey, Bijal Keyur Amin
*Smt Kamlaben Pursotambhai Patel College of Home Science, Laboratory of Foods and Nutrition, Anand People’s Medicare Society, Sardar Patel University, Gujarat, Anand, India
Email address:
mahidey11@icloud.com (N. N. Dey), bijalpatel85@gmail.com (B. K. Amin)
*
Corresponding Author
To cite this article:
Nilanjana Nandlal Dey, Bijal Keyur Amin. Effect of Nutritional, Sensory and Texture Properties of Jackfruit Seed (Artocarpus Heterophyllus Lam.) Flour Burfi. International Journal of Science and Qualitative Analysis. Vol. 3, No. 4, 2017, pp. 42-48. doi: 10.11648/j.ijsqa.20170304.12
Received: June 14, 2017; Accepted: July 18, 2017; Published: December 12, 2017
Abstract:
The study was conducted to effect of nutritional, sensory and textural properties of jackfruit seed flour burfi. The jackfruit seed flour use in different proportion to find out the based composition for preparing burfi with khoa. The percentage of jackfruit seed flour used in the burfi are 60%, 70%, 80%. For different formulation of burfi BC (100:30), B1(60:60:36), B2(70:60:39), B3(80:60:42) were generated. They were evaluated of nutrients properties sensory attributes like in taste, color, texture, flavour, mouth feel, after taste and overall acceptability of burfi. Physical parameters were also monitor including cohesiveness, springiness, gumminess, chewiness, adhesiveness and stiffness among textural properties show wide variation among all types of burfi. Statistical analysis of the data was carried out using single factor one-way analysis of variance (ANOVA). The finding show that 60% jackfruit seed flour was more acceptable in term overall evaluations. Basing on texture profile analysis, sensory attributes analysis, and more preferable composite is recommended which can be possibly further applied to daily diets.Keywords:
Khoa, Jackfruit Seed Flour, Burfi, Nutritional, Sensory and Texture Properties1. Introduction
Jackfruit (Artocarpus heterophyllus Lam) a member of the family Moraceae is the largest tree borne fruit in the world. India is the second biggest producer of the fruit in the world and is considered as the motherland of jackfruit. The jackfruit is native to parts of south and southeast Asia and is believed to have originated in the rainforest ofWestern ghats ofIndia and is cultivated throughout the low lands in major jackfruit producing countries areMyanmar, Nepal, Thailand, Vietnam, China, the Philippines, Indonesia, Malaysia and Sri Lanka [8]. Jackfruit seed contains lignans, isoflavones, saponins all phytonutrients and their health benefits are wide-ranging from anticancer to antihypertensive, antiaging, antioxidant, antiulcer [6]. The two lectins present in the seed. Jacalin has been seen to inhibit the herpes simplex virus type 2 and has proved to be useful for the evaluation ofthe immune status of human immunodeficiency virus HIV1 infected patients [4].
The incorporation of seed flour to deep fat fried products has found to reduce the fat absorption to a remarkable extent [7]. The fresh seed contains protein, fat, CHO, ash and moisture. Information on food value per 100g of edible portion of dried seed is scarce. The presence of antinutritional factors such as tannin and trypsin inhibitors has been reported, resulting in digestive ailment when eaten raw [5]. Jackfruit seed flour are also potential benefits for heart, skin cancer and so on, the multitude of other health promoting effects in the body. Mostly the seeds are discarded as waste, except sometimes they are boiled or roasted for consumption. Seed flour can be alternative product, to be used in other food products. There have been few studies on jackfruit seed some functional properties of seed flour and it’s protein digestibility [10].
impressive array of burfi varieties [3]. Nature of the product which enhance the flavour and lower the cost of production. Therefore, it is expected that there may be greater demand and consumer’s appeal to the newly formulated product. Therefore this study aimed to effect of nutritional, sensory and texture properties of jackfruit seed flour burfi.
2. Materials and Methods
2.1. Procurement of the Materials
The jackfruit seed for this research were purchased from west bhuban ban, Agartala, West Tripura, pin-799002. Milk, sugar, ghee, almond, dry coconut powder were procure from the local grocery market of Vallabh Vidyanagar, Anand, Gujrat.
2.2. Preparation of Jackfruit Seed Powder
The jackfruit seeds were cleaned manually and white arils (seed coat) were manually peeled off. Seeds were lye Peeled remove the thin brown spermoderm which covered the cotyledons. The spermoderm layer was removed by rubbing the seeds within the hands and washing thoroughly under running water. The seeds were sliced into thin chips separately and tray dried chips were powdered in a grinder, passed through 80‐100 mesh sieves and stored in air tight containers for further use.
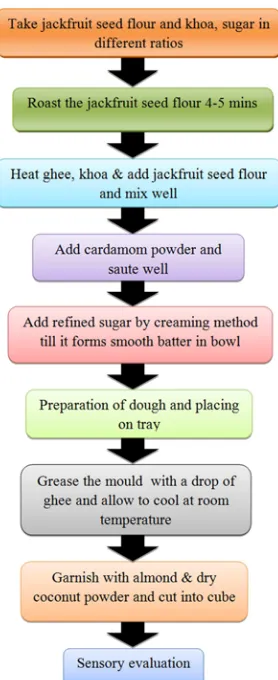
2.3. Burfi Preparation
Figure 1. Preparation of burfi.
2.4. Chemical Analysis of Burfi
Chemical analysis of the burfi was carried out by using the Association of Official Analytical Chemist (AOAC, 1980) standard methods.
2.5. Estimation of Moisture (AOAC, 1980)
Moisture content of the product was determined according to oven method. A sample of 5gm was accurately weighed into a clean dry petri dish and dried in an oven at 100c for 2-3 hours, and cooled in desiccator and weighed till consecutives weights were obtained. % moisture content of sample.
Moisture (gm%) = 100
2.6. Estimation of Protein (AOAC, 1980)
The protein content of the dried samples was estimated as percent total nitrogen by the Kjeldahl procedure. Protein percent was calculated by multiplying the percent nitrogen by the factor 6.25.
%N = . "# $
Protein (gm% )= %N ×6.25 (std value)
2.7. Estimation of Fat (AOAC, 1980)
Fat was estimated as crude ether extract using moisture free sample. The solvent was removed by evaporation and the residue of fat was weighed.
Fat (gm %)= % & % 100
2.8. Estimation of Ash (AOAC, 1980)
Total ash was estimated by taking about 5g of the sample into a crucible (which has previously been heated to about 600̊ C and cooled). The crucible was placed on a clay pipe triangle and heated first over a low flame till all the material was completely charred followed by heating in a muffle furnace for about 4 to 5 hours at about 600̊C. It was then cooled and weighed. This was repeated till two consecutive weights were same and the ash was almost white or grayish white in color.
Ash (gm%) = ' ( ( ) % ( ( ) 100
2.9. Preparation of Mineral Solution
The mineral solution was prepared by dissolving the ash obtained after ashing the sample in a muffle furnace and ash was mixed with dilute hydrochloric acid.
2.9.1. Estimation of Calcium (AOAC, 1980)
ammonium until the pink colour changed to yellow. The solution was heated to boiling and 10ml of 6 percent ammonium oxalate was added. The mixture allowed was heated to boiling for a few minutes and glacial acetic acid was added until the colour turned distinctly pink. The mixture was then kept overnight and when the precipitate settled down, the supernatant was tested with a drop of ammonium oxalate solution to ensure the completion of the precipitate. The precipitate was then filtered through whatman filter paper and was hed with water until it was free of oxalate. The precipitate was then transferred along with the filter paper to be free of oxalate. The precipitate was then transferred along with the filter paper to the same beaker and about 5mL of 2N dilute H2SO4 was then titrated against N/KMnO4 solution. 1ml of
N/100 KMnO4=0.2004 mg of calcium.
Calcium (mg%)
= )
$
* ( ( +, -.
' / 0
100
2.9.2. Estimation of Iron (AOAC, 1980)
The iron content of the sample was estimated by using automatic absorption spectrophotometer and the results were expressed in mg per 100 grams of the sample.
Iron (mg%)= * (. 0.
-.1. 0.
-.1.- ' /
2 , 0 3 $
$
2.9.3. Computation of Carbohydrate (AOAC, 1980)
Carbohydrate content was calculated by differential method.
Carbohydrate (g/100 g) = 100 – [Protein (g) + Fat (g) + Ash(g) + Moisture (%)].
2.9.4. Computation of Energy (AOAC, 1980)
Energy was calculated by differential method
Energy (kcal) = Protein (g)x4 + Fat(g)x9 + Carbohydrate (g)x4 2.9.5. Sensory Analysis
A panel of 9 untrained judges of both gender aged 25-45 years
evaluated the burfi random number. All the selected 9 panelist were asked to evaluated different burfi and all the essential quality attributes were needed to be score by each panel member. Different sensory attributes such as visual and organoleptic attributes like texture, aroma, flavour. Among all the sensory characteristics of burfi were given score range 10-20. This minimum score was (zero) while the maximum score was (twenty) the test was done to assess each attributes for all the products. The development sensory score card was presented to the panelist for the sensory evaluation of burfi. Each panelist had to given score from (9-19) according to their judgment.
2.9.6. Texture Profile Analysis
Texture profile analysis (TPA) of burfi was carried out room temperature using a TA-XT2 Texture Analyzer (Hemetek Loyyed instruments Ltd. UK) in A. D. Patel Institute of Technology, New Vallabh Vidhyanagar. 25 gm of the burfi where evaluated by compressing twice to 50% their original height with a cross-head speed was 0.5 to 1270 mm/min. Data sampling rate 8kHz with supply voltage 115/230 V AC ± 10% 50-60Hz. Textural variables from force and area measurements were hardness = peak force (g) during the first compression cycle; cohesiveness = ratio of the positive force area during the second compression to that during the first compression; springiness = height that the sample recovers during the time that elapses between the end of the first bite and the start of the second bite (cm) and chewiness = hardnes× cohesiveness × springiness (g cm). Three burfi from each formulation were used to evaluate textural parameters. A test parameter were analyzed by using software NEXYGEN+.
2.9.7. Statistical Analysis
Statistical analysis of the data was carried out using single factor one-way analysis of variance (ANOVA), (M.S office excel) to determine the acceptability of the types of burfi. The significance level of p ≤ 0.01 & p ≤ 0.05 and F value were considered.
(B3) (B2)
Figure 2. Burfi products.
Table 1. Formulation ofBC and B1, B2 and B3 Burfi.
Ingredients (gm) BC B1 B2 B3
Khoa 100(74.94) 60(34.09) 60(37.03) 60(39.60)
Jackfruit seed flour - 60(34.09) 70(31.74) 80(29.70)
Sugar 30(22.22) 36(20.45) 39(20.63) 42(20.79)
Ghee 5(2.84) 5(2.84) 5(2.64) 5(2.47)
Almond - 5(2.84) 5(2.64) 5(2.47)
Cardamom - 5(2.84) 5(2.64) 5(2.47)
Coconut powder - 5(2.84) 5(2,64) 5(2.47)
Total 135(100) 176(100) 189(100) 202(100)
Burfi control=BC (100:30), Burfi1=B1 (60:60:36), Burfi2=B2 (70:60:39), Burfi3= (80:60:42).
3. Results and Discussion
Table 2. Nutritional properties of the jackfruit seed flour burfi per 100gm.
Sample Ash (gm%)
Moisture (gm%)
Fat (gm%)
Protein (gm%)
Calcium
(mg%) Iron (mg%) CHO (gm%)
Energy (Kcal) BC 3.16±0.28 24±1.05 12.66±1.44 35±0 244.44±4.81 2.43±0.15 25.16±0.23 354.66±12.55 B1 2±0.5 47.13±7.44 1±0.5 19.71±2.10 227.77±12.72 7.88±0.41 30.15±9.27 208.46±33.67 B2 1.5±1 42.53±0.57 0.66±0.28 20.88±0.53 222.22±4.81 8.71±0.48 34.41±0.60 227.2±3.27 B3 1.16±0.28 44.86±1.50 0.83±0.28 17.96±1.12 227.77±4.81 7.85±0.15 35.16±3.04 220.03±6.55
F-value 6.49 22.74 168.12 122.60 4.8 217.78 2.65 41.84
Significan tdifference HS HS HS NS S NS NS HS
Values are means ± standard deviations from the means. Means with different latter within a column are S = Significant difference *P ≤ 0.05, HS = Highly significant difference **P ≤ 0.01, NS = Non significant difference≥ 0.05
The prepared jackfruit seed flour burfi at different ratios i.e BC(100:30), B1(60:60:36),B2(70:60:39), B3(80:60:42). Table No 2 represents the nutritional composition of jackfruit seed flour burfi product. B1 (47.13±7.44gm%) had the highest moisture content percentage. Fat content was highest in BC (12.66±1.44gm%) and the lowest in B2 (0.66±0.28 gm%). BC (35±0gm%) had the highest protein and BC had also high in ash content (3.16±0.28gm%), Since BC are prepared from 100% khoa because khoa contain a high amount of fat (gm%) and protein (gm%). Ash (gm%), moisture (gm%), fat was highly significantly different and protein was non-significantly differences. Ash (gm%) fat (gm%) and protein (gm%) value increase in burfi control compared to B1, B2 and B3. It was also reported that the moisture content in burfi significantly increased in the
different levels ofjackfruit seed flour content. The BC khoa burfi had highest protein content.While B1, B2 and B3 burfi prepared with 70% seed flour had (20.88±0.53gm%) protein content. The averagefat content in the burfi was significantly affected due to addition of seed flour. Fat content in burfi was highest in BC. Fat was decreased as the preparation of seed flour in burfi increased. This might due to low fat content inburfi B2 (0.66±0.28gm%). The calcium mg% and iron mg% contain value of BC and Bl, B2 and B3 burfi. BC has the highest calcium contain (244.44±4.81 mg%) and iron contain was little bit high in B2 (8.71±0.48 mg%) compared to BC, B1 and B3 burfi. Calcium (mg%) and iron (mg%) was significantly and non significantly differences. It was also reported that the mineral composition of the burfis. There
B1-227.77±12.72 mg, B2-222.22±4.81 mg, B3-227.77±4.81 mg) in all the four kinds of burfi. Iron content in (BC-2.43±0.15 mg, B1-7.88±0.41 mg B2-8.71±0.48 mg, B3-7.85±0.15 mg). Therefore B2 would have contained some amount of iron. It is also represent the CHO (gm%) and energy (Kcal) contain value of BC and B1, B2 and B3 burfi. B3 has the highest CHO (35.16±3.04 gm%) contentand BC was highest content energy (354.66±12.55 Kcal). CHO (gm%) and energy (Kcal) was high significant and non-significantly differences. Energy (Kcal) and CHO (gm%)value increase in BC and B3 compared to experimental B2 and B3. B1, B2 and B3 burfi and BCare
(CHO content BC - 25.16±0.23 gm%, B1-30.15±9.27 gm%, B2- 34.41±0.60 gm%,B3- 35.16±3.04 gm% and energy content BC-354.66±12.55, B1 – 208.46±33.67, B2 – 227.2±3.27 and B3 – 220.03±6.55).
Jackfruit seed flour burfi by sensory evaluation and that prepared techniques flour burfi i.e sundry flour’s burfi. In the Sensory attributes the taste, color, texture, flavour, mouth feel, after taste and overall acceptability content value of BC and B1, B2 and B3 burfi, BC had the grate taste, colour, flavor contain. BC had the highest in taste and also color and texture, B1 and B3 was found to be highest in taste, color and texture.
Figure 4. (BC).
Figure 5. (B1).
Figure 6. (B2).
Figure 7. (B3).
Taste, color and texture value increase in BC and B3 compared to B1 and B2. The sensory scores given for various samples are BC, B1, B2 and B3. Samples in which 100%, 60%, 70% and 80 % seed flour was blended with khoa scored the highest score in the sensory attributes taste (BC-18.88±0.75, B1-17.18±2.38, B2-16.51±1.52 and B3-16.85±1.70), color
(BC-18±1.74 B1- 17.48±1.74 B2-17.25±1.40,
B3-17.18±1.11), texture (BC-17.81±1.14, B1-17.22±2.06, B2-17.11±1.62 and B3-17.11±1.39) sample. It was observed that increasing proportion of seed flour in the blended in the khoa decreased the score of color and flavour of burfi. The score in respect of taste and colour ranged between burfi B3 and B2 different ratios treatments combination. Sensory evaluation of Burfi samples containing different amount of jackfruit seed flour as compared to the BC. The score for color indicated that the color of BC and B1, B2, B3 sample were different. The colour of burfi changed from dark-brown to darken with the increasing seed flour. The results show that the overall acceptability of samples B2 were not equally acceptable. BC, B1 and B3 were most preferred. Were sample B2 marked with low score. There were highly in texture of BC, and B1, B2, B3 were not like BC sample. Among composite (BC-17.81±1.14) and (B1-17.22±2.06) was most preferred. There was highly difference in taste of BC compared to the B1, B2, and B3 samples. In the sensory attributes flavour score of the (BC-8.55±0.57, B1-8.18±1.17, B2-7.03±0.85 and B3-7.48±0.89). Sensory attributes mouth feel score of the (BC-8.55±0.80, B1-8±1.17, B2-7.33±1.17 and B3- 7.92±0.99), after taste score (BC-8.48±0.97, B1-7.96±1.12, B2-7.51±1.12 and B3-7.66±1.03), and overall acceptability score
(BC-8.62±0.96, B1-8.74±1.43, B2-7.62±1.36 and
B3-8.14±0.98).
pretest speed 1 mm/sec, test speed 1 mm/sec, post-test speed 1 mm/sec, count 3 test distance 1 mm; trigger type – auto, trigger force 1 Kn (225 Ibf) probe – 1 mm compression platen. The burfi samples also showed wide variations among sample procured from different markets. cohesiveness (BC-0.07±0.03, B1-0.18±0.06, B2-0.17±0.02, B3-0.19±0.02), springiness
(BC-4.51±0.91, B1-4.04±2.73, B2-2.52±0.34 and
B3-5.37±0.08), gumminess (BC-0.03±0.02, B1-0.07±0.02, B2-0.06±0.01 and B3-0.03±0.01), chewiness (BC-0.17±0.14,
B1-0.33±0.31, B2-0.17±0.06 and B3-0.18±0.06),
adhesiveness ranged from (BC-0.01±0.8, B1-0.14±0.18, B2-0.13±0.16 and B3-0.02±0.01), stiffness (BC-0.24±0.9, B1-0.23±0.4, B2-0.20±0.2 and B3-0.04±0.4). B3 had the highest springiness contain comparedto BC, B1 and B2 burfi. Chewiness contain was found to be little bit high in B1 burfi.
4. Conclusion
After formulation it was found that nutritional improvement viz. protein, low fat and calcium, iron, was noticed. Thus, the micronutrient enhancement in the products may help to improve the nutritional security. The product was ranked “good” during the first sensory evaluation test. Furthermore improvements were done and sensory evaluation ranked the product “Excellent” by all the panel members and the product was then standardized. Khoa (Mawa) and jackfruit seed burfi the main ingredientare jackfruit seed rich in protein, and calcium barfi was further enriched with ghee, almond and dry coconut powder which have made this product a functional food with high biological value. These new food items made from jackfruit seeds can be incorporated in our daily diets as a valuable addition.
Acknowledgement
The authors wish to thank Mrs. Bijal Amin. Head. Department of Foods and Nutrition and Food Biotechnology
for helpfull suggestion
.
References
[1] AOAC (1980). Official methods of analysis. Association of official analytical chemists, Washington, D. C.
[2] Charis K. R, Umadevi S. Hiremath, Anitha S (2015) Formulated Nutri-Dense Burfi and Its Physico-Chemical Components. Journal of Food and Nutrition Sciences. Vol. 3, pp. 108-113.
[3] Gargade, D. A. (2004): Use of orange concentrate in the proportion of burfi. M.Sc. (Agri.) Thesis submitted to Dr. moisture content PDKV., Akola (M.S.) India.
[4] Haq N (2006). Jackfruit (Artocarpus heterophyllus). Southampton Centre for Underutilised Crops, University of Southampton. Southampton, UK.
[5] Morton J, Julia F, Miami F.L (1987). Jackfruit (Artocarpus heterophyllus). In: Fruits of warm climates, pp. 58 – 64. [6] Omale J, Friday E (2010). Phytochemical composition,
bioactivity and wound healing potential of Euphorbia Hetero phyllas (Euphorbiaceae) leaf extract. International Journal of Pharmaceutical and Biomedical Research (1) 54–63.
[7] Rajarajeswari H and Jamuna P. The Ind J Nutr Dietetics (1999). A study on a nutritional and functional properties analysis of jackfruit seed flour and value addition to biscuits. IJRET, vol 4, ISSN: 2278-0181.
[8] Sidhu A. S. (2012). Jackfruit improvement in the asia‐pacific region a status report, IIHR 1‐20.
[9] Shiresha Vilas D and Rupali S (2014) Formulation and evaluation of dates and flaxseed incorporated burfi Department of Clinical Nutrition and Dietetics, Dr. B.M.N College of Home Science 338, R. A Kidwai Road, Matunga, Mumbai.