Published online December 19, 2014 (http://www.sciencepublishinggroup.com/j/ijnfs) doi: 10.11648/j.ijnfs.20140306.25
ISSN: 2327-2694 (Print); ISSN: 2327-2716 (Online)
Percent body fat versus body mass index among Ghanaian
adults in different districts
Helena Nti
1, *, Matilda Steiner-Asiedu
1, Alex Kojo Anderson
21
Department of Nutrition and Food Science, University of Ghana, Legon-Accra, Ghana
2
Department of Foods and Nutrition, University of Georgia, Athens, GA 30602 U.S.A.
Email address:
helenanti@ymail.com (H. Nti), tillysteiner@gmail.com (M. Steiner-Asiedu), fianko@uga.edu (A. K. Anderson)
To cite this article:
Helena Nti, Matilda Steiner-Asiedu, Alex Kojo Anderson. Percent Body Fat versus Body Mass Index among Ghanaian Adults in Different Districts. International Journal of Nutrition and Food Sciences. Vol. 3, No. 6, 2014, pp. 586-591. doi: 10.11648/j.ijnfs.20140306.25
Abstract:
Background: The debate regarding use of WHO body mass index (BMI) cut-offs for the assessment of nutritional status continues in the scientific community. That is, BMI may not be a true reflection of body composition. Researchers have investigated BMI and percent body fat (%BF) as risk factors for some chronic diseases. Objectives: The current study sought to evaluate the use of BMI to assess %BF and their relationship with high blood pressure (HBP) among Ghanaian adults. Methods: A total of 512 men and women were enrolled in a cross-sectional study, conducted in urban (Accra Metropolitan District [AMD; 276]) and peri-urban (Upper Manya Krobo District [UMKD; 236]) Ghana. BMI and %BF were determined and proportions of underweight, normal weight, and overweight/obese participants were compared. Relationship between BMI, %BF and HBP was investigated. Results and discussion: Mean BMI was greater for participants in the AMD than UMKD (25.69±4.85 and 24.51±4.89; p=0.007). %BF was also greater for men (p=0.001) and women (p=0.012) in the AMD than UMKD, respectively. Participants in the AMD (underweight-7%, normal weight-48%, overweight-24%, obese-21%) and UMKD (underweight-14%, normal weight-55%, overweight-17%, obese-15%) had different %BF (p=0.009) but not BMI (p=0.090). A significantly higher number of participants in the AMD had HBP (26%) than UMKD (19%) (p=0.038). Overweight/obese participants had significantly higher blood pressure compared to underweight/normal weight participants, in both AMD (by BMI; p=0.002 and by %BF; p<0.0001) and UMKD (by BMI and %BF; p<0.0001). BMI correlated moderately and significantly with %BF in both urban AMD (r=0.578; p<0.0001) and peri-urban UMKD (r=0.693; p<0.0001). Conclusion: BMI seems to be a good indicator for the assessment of adiposity among Ghanaian adults and may be used to assess adiposity in the absence of %BF.Keywords:
Adiposity, BMI, Ghana, HBP, Obesity, Overweight, %BF1. Introduction
The prevalence of overweight and obesity continue to increase not only in developed countries but also in developing countries. Overweight and obesity may lead to serious health consequences and also increased risk of mortalities and morbidities [1] which include cardiovascular diseases (CVDs) [2]. High adiposity also affects the body’s response to insulin which may lead to insulin resistance and thrombosis [2]. Studies have shown variations for body fat distribution among different groups. This has led to a debate about the use of body mass index (BMI) for the determination of body composition among different populations. The World Health Organization (WHO) recommends that BMI be used as a simple tool for the assessment of body fat [3]. According to the WHO, BMI reflects risk for type 2 diabetes and CVDs which are rapidly
becoming major causes of death in all adult populations [4]. However, BMI is a reflection of excess weight and does not truly and entirely represent adiposity [2, 3]. Wang et al (2010) report that, studies have shown differences in BMI, percent body fat (%BF) and body fat distribution among different populations [2]. Presently, only Asian populations are known to have local BMI cut-offs to reduce discrepancies as they have lower BMI but higher fat mass [2]. The purpose of this study was to evaluate the use of BMI for the determination of adiposity among Ghanaian adults.
2. Materials and Methods
2.1. Ethical Clearance
Noguchi Memorial Institute for Medical Research (NMIMR), University of Ghana, Legon-Accra, Ghana.
2.2. Study Area and Population
The study was conducted in 2009, in two districts of Ghana; the Accra Metropolitan District (AMD) located in the Greater Accra Region, and the Upper Manya Krobo District (UMKD) located in the Eastern Region of Ghana. Study participants (512) were civil and public servants who consented to participate.
2.3. Study Design
The cross-sectional survey used convenience sampling for both the selection of institutions and the recruitment of participants. That is, institutions in both the AMD and the UMKD that were easily accessible were invited for participation.
2.4. Procedures
Interviewers were trained on questionnaire administration and anthropometry prior to data collection. Data were collected at the premises of each institution. Questionnaires were administered in languages participants preferred. Weight and height measurements were taken using standard techniques and calibrated equipments. BMI was computed as weight/height2 and categorized as follows: <18.5kg/m2 (underweight), 18.5kg/m2-24.9kg/m2 (normal weight), 25kg/m2–29.9 kg/m2 (overweight), ≥30kg/m2 (obese). Body fat was measured with an Omron HBF-306 (USA) body fat analyzer which measures %BF by bioelectrical impedance method. Classification of nutritional status by %BF was according to specifications provided in the manual of the analyzer (Table 1). Blood Pressure was measured using Omron HEM-7203 digital sphygmomanometer (U.S.A.). High Blood Pressure (HBP) was determined using high systolic (≥140mmHg) or diastolic (≥90mmHg) blood pressure.
Table 1. %BF cut-offs according to NIH/WHO guidelines
Sex Age (years) Under-wei ght (%) Norma l (%) Over-weight (%) Obese (%) Female
20-39 5-20 21-33 34-38 > 38
40-59 5-22 21-34 35-40 > 40
60-65 5-23 24-36 37-41 > 41
Male
20-39 5-7 8-20 21-25 > 24
40-59 5-10 11-21 22-27 > 27
60-65 5-12 13-25 26-30 >30
Classification was based on NIH/WHO guidelines for BMI as reported in the manual of the Omron HBF-306 (USA) body fat analyzer.
2.5. Statistical Analyses
Data were analyzed with the Statistical Package for the Social Sciences (SPSS) software, version 16. Pearson chi-square test was used to compare differences in background characteristics of the two districts. Spearman and Pearson correlations were used to determine significant associations between BMI, %BF and HBP. Binary logistic regression was
used to determine predictors of %BF. P < 0.05 was considered statistically significant.
3. Results
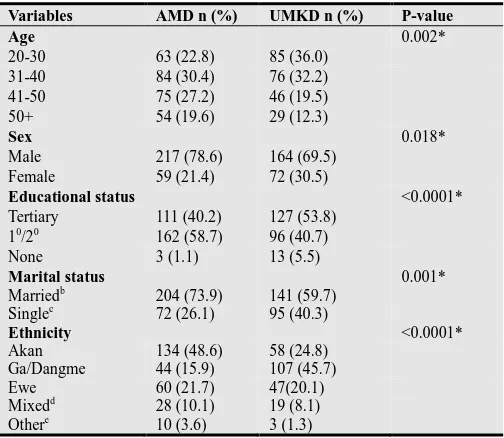
Table 2 shows background characteristics of participants in the AMD and UMKD. Participants from the studied districts were significantly different in age, sex, educational status, marital status and ethnic group (Table 2). Participants in the AMD were older and more educated, and had more men and married participants compared to participants in the UMKD.
Table 2. Socio-demographic characteristics of participants.
Variables AMD n (%) UMKD n (%) P-value
Age 0.002*
20-30 63 (22.8) 85 (36.0)
31-40 84 (30.4) 76 (32.2)
41-50 75 (27.2) 46 (19.5)
50+ 54 (19.6) 29 (12.3)
Sex 0.018*
Male 217 (78.6) 164 (69.5)
Female 59 (21.4) 72 (30.5)
Educational status <0.0001*
Tertiary 111 (40.2) 127 (53.8)
10/20 162 (58.7) 96 (40.7)
None 3 (1.1) 13 (5.5)
Marital status 0.001*
Marriedb 204 (73.9) 141 (59.7)
Singlec 72 (26.1) 95 (40.3)
Ethnicity <0.0001*
Akan 134 (48.6) 58 (24.8)
Ga/Dangme 44 (15.9) 107 (45.7)
Ewe 60 (21.7) 47(20.1)
Mixedd 28 (10.1) 19 (8.1)
Othere 10 (3.6) 3 (1.3)
10/20: Primary/Secondary education, b: Co-habiting, c: Single/divorced, d: Various ethnic groups from the Northern region of Ghana, e: Other ethnic groups, *: Significant at p<0.05
About 14% and 7% of overweight/obese participants in the AMD and the UMKD were wrongly classified as normal weight by BMI classification, respectively (p<0.0001). Similarly, majority of participants had higher adiposity by %BF than by BMI classification.
By %BF classification, participants in the AMD and the UMKD were significantly different in nutritional status (Figure 1). That is, participants in the UMKD were more lean and normal weight while participants in the AMD had more adipose tissue (p=0.009). Even though this was also observed by BMI classification (Figure 2), the difference between the two districts, AMD and the UMKD was not significantly different (p=0.092).
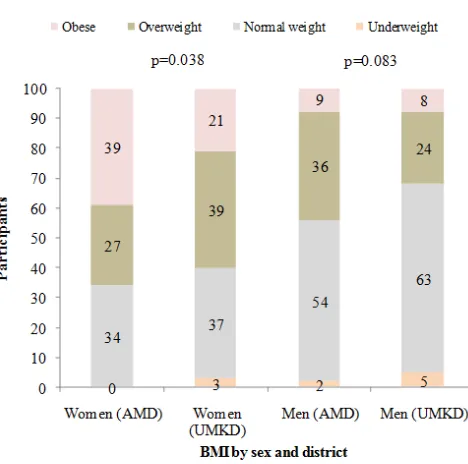
Figures 3 and 4 suggest that BMI may not be a true reflection of adiposity. %BF of men in both districts and also women in both districts was not significantly different (Figure 3). However, women in the AMD had higher BMI than women (p=0.038) in the UMKD (Figures 4).
Comparing nutritional status of men and women; %BF did not show significant difference between men and women in the different districts (AMD: p=0.154, UMKD: p=0.111).
However, BMI showed that women were heavier than men in the AMD (overweight/obese men and women: 44% and 66%, respectively; p<0.0001) and UMKD (overweight/obese men and women: 32% and 70%, respectively; p<0.0001).
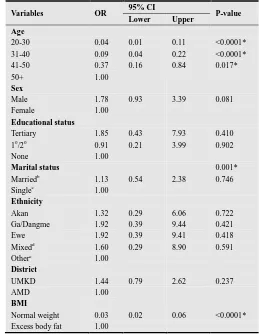
BMI was moderately and significantly correlated with %BF in the AMD (men; r=0.459; p<0.0001, women; r=0.719; p<0.0001) and the UMKD (men; r=0.722; p<0.0001, women; r=0.616; p<0.0001). In a binary logistic regression model and controlling for age, sex, education, marital status, ethnicity and district, BMI was a significant predictor of %BF (Table 3). %BF (AMD and UMKD: p<0.0001) and BMI (AMD: p=0.002, UMKD: p<0.0001) showed significant associations with HBP. The AMD and the UMKD recorded HBP prevalence of 26% and 19%, respectively (p=0.038). Majority of overweight/obese participants had HBP compared to normal weight and underweight participants (Figure 5).
Figure 1. Nutritional status by %BF and district (p=0.009)
Figure 2. Nutritional status by BMI and district (p=0.092)
Figure 3. Nutritional status by %BF and sex
Figure 4. Nutritional status by BMI and sex
Figure 6. Prevalence of HBP by sex and district
Figure 7. Participants with HBP according to age (p<0.0001)
Figure 8. Prevalence of excess body fat by age (p<0.0001)
Table 3. Predictors of %BF
Variables OR 95% CI P-value
Lower Upper Age
20-30 0.04 0.01 0.11 <0.0001*
31-40 0.09 0.04 0.22 <0.0001*
41-50 0.37 0.16 0.84 0.017*
50+ 1.00
Sex
Male 1.78 0.93 3.39 0.081
Female 1.00
Educational status
Tertiary 1.85 0.43 7.93 0.410
10/20 0.91 0.21 3.99 0.902
None 1.00
Marital status 0.001*
Marriedb 1.13 0.54 2.38 0.746
Singlec 1.00
Ethnicity
Akan 1.32 0.29 6.06 0.722
Ga/Dangme 1.92 0.39 9.44 0.421
Ewe 1.92 0.39 9.41 0.418
Mixedd 1.60 0.29 8.90 0.591
Othere 1.00
District
UMKD 1.44 0.79 2.62 0.237
AMD 1.00
BMI
Normal weight 0.03 0.02 0.06 <0.0001*
Excess body fat 1.00
10/20: Primary/Secondary education, b: Co-habiting, c: Single/divorced, d: Various ethnic groups in the Northern region of Ghana, e: Foreigners and other ethnic groups, *: Significant at p<0.05. Hosmer-Lemeshow goodness of fit: Chi-square value - 11.65, p-value – 0.168.
In both districts HBP correlated weakly with %BF, especially among women (AMD: Men; r=0.317; p<0.0001, Women; r=0.170; p=0.224, UMKD: Men; r=0.366; p<0.0001, Women; r=0.106; p=0.388). Similarly, HBP was weakly correlated with BMI (AMD: r=0.158; p=0.010, UMKD: r=0.335; p<0.0001).
Majority of men had HBP compared to women (Figure 6). This was evident in the AMD (p=0.003) but not the UMKD (p=0.406). Age was significantly (p<0.0001) associated with %BF, BMI (AMD; p=0.002, UMKD; p<0.0001) and HBP. Older participants had HBP (Figure 7; p<0.0001) and were more excess body fat (Figure 8: p<0.0001) compared to younger participants. That is, overweight and obese participants recorded a higher prevalence of HBP than normal weight and underweight participants.
less likely to have HBP than the obese (CI: 0.014-0.259; p<0.0001). Being of normal weight was 88% less likely to have HBP than the obese (CI: 0.002-0.092; p<0.0001).
4. Discussion
Our study shows that BMI compared to %BF does not tell significant differences in nutritional status and adiposity among different populations. This suggests that residents from the studied districts are different in adiposity but not heaviness (Figures 1 and 2).This finding implies that, BMI may not be a good indicator in evaluating differences in adiposity (body fat) between various groups, geographic locations or populations.
Population studies have shown that morbidity and mortality increase with relatively high body weight [5]. More often, in previous research, BMI is reported to correlate with %BF. Similar to Nakanishi et al’s (2000) study, BMI was moderately and significantly correlated with %BF [1]. Nevertheless, it is evident that BMI misclassified %BF significantly. That is, even though BMI has been reported to be accurate in the determination of body fat in different populations, there seems to be few exceptions.
Many healthy-looking individuals may be overweight but not excess body fat [6, 7]. In our study, BMI was found to overestimate proportion of overweight individuals and underestimate obese persons in the two different study populations (Figures 1 and 2). This finding explains why the overweight is considered excess body fat. As reported earlier in this paper, excess body fat is associated with some chronic diseases. Therefore, BMI may not be a good indicator for the determination of adiposity (obesity), to assess disease risk. Specifically, fat individuals may be considered normal weight or overweight; hence reducing their risk for obesity-related diseases and appropriate treatment or intervention.
Choi et al [8] in their study found positive correlation between total body fat and serum triglycerides. This relationship was observed strongly in males than females. Studies in Hong Kong and Singapore have shown higher risk for CVDs and diabetes at lower BMIs [3, 9]. Kesavachandran
et al (2010) have also found higher %BF and risk of diabetes
and hypertension at normal BMI range [3]. Considering that BMI under-estimates adiposity, it may be necessary for the development of alternate BMI cutoffs. This will help to capture individuals who have excess body fat and higher risk for obesity-related chronic diseases.
Body composition has been reported as a strong predictor of mortality and morbidity [1]. BMI is also used commonly as proxy for body composition in clinical settings and epidemiological studies [1]. Previous research findings suggest that adiposity is a risk factor for hypertension, diabetes and other physiological disorders [1, 10]. This implies that overweight and obese participants in the AMD may be at risk of some chronic diseases like diabetes. This may be influenced by age, sex, educational level, marital status and ethnicity as the two districts showed differences in these characteristics. Deurenberg et al (2002) report that %BF could be predicted from BMI with age and gender taken into
consideration [5]. This is in keeping with our findings as BMI was a significant predictor of %BF.
Being a woman may enhance the likelihood of being heavy but not necessarily being fat. BMI showed significant difference between women in the AMD and women in the UMKD but not men (Figure 4). AMD compared to UMKD may have their women being more sedentary among other unhealthy lifestyle behaviours. Conversely, women in the UMKD, a peri-urban area are likely to engage in active activities like farming, outside their formal employment unlike women in the AMD; hence, making them more active than their fellow women in the AMD.
According to Glaner [11], BMI is a better indicator of body fat for boys and girls. He however adds that, BMI does not show consistence in body fat determination of boys and girls. This appears to be similar to the findings of this study. BMI was not consistent among men and women. While Glaner’s report has shown that BMI is a better indicator of body fat for girls than boys, Carrasco et al. (2004) also have found that BMI is a better indicator among women than men [12]. These findings contradict findings of our relatively current study. In both AMD and UMKD, a higher proportion of women were misclassified as overweight/obese by BMI classification (Figures 3 and 4).
In Khongsdier’s (2005) study, the underweight, normal weight and obese were not different in self-reported morbidity [13]. We report otherwise, as the overweight had higher prevalence of HBP than the normal weight and underweight. Also, the older participants in both districts had HBP compared to younger participants.According to Brooks et al (2007), neither BMI nor %BF is a good indicator of health status of young adults [10]. Our study findings contradict this fact as HBP was associated with %BF and BMI. %BF and BMI were significant predictors of HBP in the AMD and UMKD, respectively.
5. Conclusion
Acknowledgments
This project was carried out with logistic support from Professor Matilda Steiner-Asiedu. The International Development Research Centre, Ottawa, Canada (Funding: IDRC grant HD43620) provided some financial assistance
during data collection in the peri-urban communities. Plan Ghana and Ghana Health Service provided accommodation at the UMKD during data collection. Helena Nti was involved in data collection and its supervision. She carried out data cleaning, data analysis and put the manuscript together. Dr. Amos Laar was instrumental during data analysis. Dr. Gloria E. Otoo was one of the key supervisors of this work during data collection and write-up. Dr. Jonathan Adjimani contributed to the write-up of this work. Professor Matilda Steiner-Asiedu and Dr. Alex Kojo Anderson proofread the manuscript. The following people contributed to data collection in the urban communities: Mabrouk Zacharia Adams, Phyllis Addo, Fredrick Adiiboka, Rosemond Duncan, Sena Nyamuame, Sika Kumordzie and Esther Abandoh-Sam.
References
[1] Nakanishi N, Nakamura K, Suzuki K, Matsuo Y, Tatara K. Associations of Body Mass Index and Percentage Body Fat by Bioelectrical Impedance Analysis with Cardiovascular Risk Factors in Japanese Male Office Workers. Industrial health 2000; 38: 273-279.
[2] Wang C, Hou X-H, Zhang M-L, Bao Y-Q, Zou Y-H, Zhong W-H, Xiang K-S, Jia W-P. Comparison of body mass index with body fat percentage in the evaluation of obesity in Chinese. Biomedical and environmental sciences 2010; 23: 173-179.
[3] Kesavachandran CH, Bihari V and Mathur N. The normal range of body mass index with high body fat percentage among male residents of Lucknow city in North India. Indian J Med Res 2012 (135): 72-77.
[4] WHO expert consultation. Appropriate body-mass index for Asian populations and its implications for policy and intervention strategies. Lancet 2004; 363: 157-163.
[5] Deurenberg P, Deurenberg-Yap M and Guricci S. Asians are different from Caucasians and from each other in their body mass index/body fat percent relationship. Obesity reviews 2002; 3: 141-146.
[6] Gallager D, Heymsfield SB, Heo M, Jebb SA. Health percentage body fat ranges; an approach for developing guidelines based on body mass index. Am J Clin Nutr 2000; 72: 694-701.
[7] Ocker LB. Examining the validity of body mass index cut-off score for obesity of different ethnicities. Journal of multicultural, gender and majority studies 2008; 2 (1): 1-7.
[8] Choi J-W, Pai SH, Kim SK. Associations between total body fat and serum lipid concentrations in obese human adolescents. Annals of Clinical & Laboratory Science 2002; 32 (3): 271-278.
[9] Villareal DT, Apovian CM, Kushner RF, Klein S. Obesity in the older adults: technical review and position statement of the American Society for Nutrition and NAASO, The Obesity Society. Am J Clin Nutr 2005; 82: 923-934.
[10] Brooks Y, Black DR, Coster DC, Blue CL, Abood DA and Gretebeck RJ. Body mass index and percentage body fat as health indicators for young adults. Am J Health Behav. 2007; 31 (6): 687-700.
[11] Glaner MF. Body mass index as indicative of body fat compared to the skinfolds.
[12] Carrasco FN, Reyes ES, Rimler OS, Rios FC. Exactitud del índice de masa corpo- ral en la predicción de la adiposidad medida por impedanciometría bioeléctrica. Arch Lationam Nutr 2004; 54: 208-286.