http://www.sciencepublishinggroup.com/j/her doi: 10.11648/j.her.20180305.11
ISSN: 2578-9341 (Print); ISSN: 2578-935X (Online)
The Exploring of Visual Imagery: In Their Relation to the
Students’ Mathematical Identity
Mohamad Rif’at
University of Tanjungpura, Mathematics Education, Pontianak, Indonesia
Email address:
To cite this article:
Mohamad Rif’at. The Exploring of Visual Imagery: In Their Relation to the Students’ Mathematical Identity. Higher Education Research. Vol. 3, No. 5, 2018, pp. 75-91. doi: 10.11648/j.her.20180305.11
Received: October 22, 2018; Accepted: November 28, 2018; Published: December 26, 2018
Abstract:
The learning principles usually not visually. The visual understood as an analytical and facilitate an idea. That is the visual is parallel to other representation. The visual ability is not only a tool, or a strategy, or a type of thinking, but also the chain of reasoning to achieve the formal analytic abilities. In this study, the visual ability examined, as a strategy or way of thinking to solve a problem. The question to be addressed is: How do students come to their mathematics identities based on visual imagery? The research conducted at classes of the preservice mathematics education students namely provides evidence for what is their identity relative to their experiences. The results conducted based on explorative studies for the visual abilities. The performance obtained during the teaching and learning, i.e., visualizing and answering analytically or visually, manipulating and answering analytically or visually or by formulas, and visualizing and the answering visually or analytically or based on the conditions. The performance linked to the visual representation and related to intuition underlies formal abilities. The visual perceptions disturbed by prior knowledge, and the level based on optical illusions, so the teaching and learning make a difference between potential and abilities. The analytical affects visual perception and the belief system, so difficult to construct knowledge. However, the level of thinking is different, i.e., not yet formal or new optical illusion. The visual model related to high-level thinking, which distinguished from the analytical thinking model. In the visual model, thinking activities based on the transformations and understood as the other operations in mathematics. The visual model also shows the analytic thinking and hierarchical. The visual and the analytical thinking integrated to develop a richer understanding of mathematical concepts. Through visual thinking, the mental processing was constructed and interpreted as mental objects and processed analytically. The next, exhibits the analytical, consist of the construction process from the visual, namely the reflective abstractions. The visual abilities not related to the duration of courses in the mathematics education department. The longer increases the analytic but in contrary to the visual. Through the learning of the visual abilities, the difficulties in solving the problems decrease, but resistant to the analytic show a specific performance. Visual learning reveals a hierarchical level of the thinking, so the best performance is the highest learning ability. When learning the visual abilities given, the performance increases.Keywords:
Visually, Visual Imagery, Visual Thinking, Analytically, Analytic Thinking, Spatial Ability, Mathematics Identity1. Introduction
The most prominent representation in teaching mathematics is analytical, namely symbolic or algebraic. Mathematics activity tends to solve problems practically and to manipulate symbols. Mathematics proposition proved analytically using an algebraic algorithm. Those representations are difficulty of the teaching and learning. The researcher tries to promoting other representation,
storage in memory. Constructing a visual need a competency for visualizing or manipulating it, so the solution tackled. The teaching in analytic representation generally enhanced the performance but a visual as an inductive approach [2] due to the cognitive process and not directed to promote a metacognitive belief.
A visual makes easy for understanding an analytic idea, especially makes the relationship as flexible as in the analytic. For example, a negative number represented using a visual. The most students did algebraically and not visually. The reason is that of no negative quantity. That contradicted to the fact in a coordinate system. In the analytic teaching, a visual is mainly as an illustration of a problem. But, N. Tadao [3] acclaims there are two other phases before attaining the analytic representation, i.e., to visualize and to verbalize. In the visualization, the visual manipulated so could be any relation to the visual. After getting a relation, a solution raised. In a verbalize phase, a verbal manipulated. A. H. Schoenfeld [4] argues that the visualization could generate a thinking process for the analytic. However the visual compiled into an analytic solution. E. Barbin [5] state that after forming the visual thinking, the student can construct mathematics principles from the visual representations.
There are mistakes when working in the analytic representation: (1) in using the procedure, concept, and principle and (2) in using deductive logic. D. H. Clements, and M. T. Battisda; M. Rif’at [6, 7] discovered that the students don’t separate analytic and visual representations, always neglect an interest of reasoning, the difficulty of analytic deduction, the deduction is still a combination between visual representation and the manipulation of algebra, and impediment of terms and logic. R. Zazkis; Dubinsky, Ed; and J. Dautermann [8] assert that the students conduct tasks on dihedral group D4 visually and then
analytics, and again visual, and analytics, and the analytics, and so on and on. The analytic representation made by students not yet seen as a formal competency holistically, i.e., the reasoned logic not right and still accompanied the picture. E. T. Ruseffendi [2] states that there are still people who have not been able to reach the analytic thinking phase even in college. Reported by O’Daffer, G. Phares and B. A. Thornquist; D. H. Clements, S. Swaminathan, M. A. Z. Hannibal, and J. Sarama [9, 10], that: (1) 25% of 1520 students can’t deduce analytically and (2) 20% of 255 students only deduce illustratively. However, the students taught deducing analytically, 30% of them with 75% mastery and just between 20% to 30% of deducing analytical. S. Vinner [11] state that the deduction from visual representation is more convincing than analytical, and the students chose or develop analytical not show an enhancing of algebra understanding, but of practice, routinely, and delight.
E. G. Begle [12] state, the analytical in teaching is a critical variable. In many studies, showed that the analytic representation is not an indicator of mathematics representation. As noted [13] that the deduction from a manipulated visual allowing the student the process of how
to know.
The importance of the visual teaching is a variation and a competency or a selection. As stated [14] that the solution method used by the students when interviewed based on task reflect visual orientation. Galindo also said that the students with higher score apply the visual, while the lower uses the analytic, i.e., numeric and symbolic. The research results of cognitive psychology also show the process and of visual activities than the others. M. W. Matlin [1] writes some of those are: (1) visual imagery linked to the visual exercises; (2) there is two visual representation in mind, i.e., stored in analog code and the proposition; and (3) visual stimuli examined easier and reinterpreted. H. W. Syer [15] argue when the students back to the analytic concept then it can be observed that the foundation of concept development is on perceptual based because they go to the visual when faced with many problems on analytic process. The teaching strategies and knowledge structure of the students explored from their imagery. M. Rif’at [16] suggests that the key to the improvement of students’ performance in a subject-matter domain especially in visual imagery is not the creation of an ever more elaborate and fine-tuned set of procedures, but rather by changing the nature of their identity. In essence, the change in students’ performance is grounded in an organization of materials to content knowledge and the pedagogical.
This research examined an understanding of the visual representations and the processes. The study explored the students’ cognition level of the visuals when used in solving mathematics problems. J. Boaler, & C. Humphreys; J. O. Masingila [17, 18] identified that the students possessed poor background with the manipulated visuals, and failed to provide an image of their understanding of the visualization. The researchers also investigated the students’ general cognitive level on the visual representation and explored the performances and potential factors contributing to their learning identities by answering the instruments.
The visual imagery thinking and learning style is very pleasant. The students need to put their visuals into control strategies before providing the answers. The students directed to thrive on consistency knowledge explored the visual ability they write down. That is not a behavioral issue but a significant identity for which they need to develop strategies and skills. Importantly praised for the efforts rather than concentration on achievement to develop strategies and skills.
intuitive grasp of complex memory systems. It recognized among others is missing a logical step. Simultaneously, processing of concepts, inductive reasoning, use of imagination and generation of ideas conducted by combining existing facts in new ways whirligig that looks not consistent with the mathematics. It influenced by visualization and constructed images of the space as a whole.
Whereas analytical thinking is step by step linearly, the visual influenced by imagery system where all knowledge interconnected in perception side. When left-brain thinkers are asked to answer a question, they will look for the answer based on the facts at their disposal. While the right brain thinkers usually respond with some form of telling more or it depends. As all their visual knowledge is connected, they can see, paths to answer and they want more information to decide to take to the required answer. Because one of the visual imagery attributes is a nondivergent form of thinking, their minds often veer into new principles. For instance, the students draw a line perpendicular to the available line for as their imagery. This result in illogical or often unsubstantiated conclusions. J. Freed [21] argue that they may view a problem from an entirely different angle, leading to the new one. Reference [16] invented that when the students view a visual representation problem, there is an oblique effect so not promoting the right answer. M. Piechowski, Overexcitabilities; M. Rif’at [22, 7] explains that there is the imagery of facilitating an invention chosen by the students. In the visual, it’s mean that a mathematics idea is a visual stimulation doing in the analytical representation. Therefore, it’s for enhancing problem-solving ability, not only of the analytical but also of the visual imagery.
The visual imagery appears the specific identity. The identity is analytical. So, the students have endless effort and a vivid imagination. They exhibit visual abilities combined with their imageries is an engagement identity. The visual imageries are the problem. That is the learning experience, such as to visualize although not required, to use a visual for analyzing a situation, to construct visual for solving a problem, that resulted in the solution so that the students experienced a development phase. In particular, the visual imagery is difficult in remembering and repeating the usual steps. So, they have difficulty with visual thinking and short-term memory. But the information process presented in a manner suited to their visual imagery.
When the information presented in the analytic expression, they have to translate back into their visual representation. The reality is temporary to translate, i.e., to visualize the current information presented analytically. Once the translation is complete, they return to external reality and continue to the external information and closing off that to translate. The result is a series of gaps where known the information and miss other bits of information. The gaps are especially apparent during the review and on tests at class. Also, the translation process takes time and means that they have difficulty finishing tasks and tests in the time allotted. The visual imagery frequently has difficulty with the verbal or linguistic representation. To communicate the students’
thoughts, first, they have to grab particular images in their heads and place them in order. Then they have to hold them in memory. Then they have to find a suitable illustration to describe their images. Then they have to hold them in order long enough to solve the problem.
In general, visual thinking is to follow the information arrangement principles that not just taken, but until an understanding reached. According to cognitive theory, the perception only explained as a set of stimuli. Based on the theory, [23] state that the students tend to the see structures according to their perceptions. The students’ visual responses tend to show the attribute of perception functions. In this case, a separated concept changed to visual context. According to Gerald’s Theory, a perception dominated by visual representation classified pieces of information. The visual perception is a thought and arranged by basic principle about solution pattern of a general. For example, a curve is not only considered as a combination of line segments and the curvature but perceptually regarded as wholeness geometric form. Therefore, the thinking process about the visual is to discover the wholeness.
Similarly, in solving complex problems, the perception has a role when the problem component can be observed in term of its function and by examining the structure of the problem. Through a structured study will be defined as the function of the component of the problem so applicable. M. Wertheimer [24] argue that an understanding of the problem structure is productive thinking. For example, the difficulty when give formulae contrasted to of constructing it. According to [24], the difficulty of the visual thinking caused by the students didn’t understand the functional equality among the visual representations.
The problem-solving process that based on a structure allowing the students find the relationships of their intuitions. From the relationships, the student can also transform the problems to a simpler one. For example, evidently when using an analytic representation is more complicated comparing with describing the visual. M. Wertheimer [24] state that often the formula steps made the solution is not structured. It understood that psychologically the manipulated visual representation of the problem is the learning needs. An understanding of Wertheimer’s interpretation is only a part of the thinking results of the structure.
In understanding and presenting the mathematical structure need to be understood the problem of the mental process, i.e., the problem-solving strategy. That is, there is no solution which readily raised. By the thinking, the visual teaching and learning are to implement. According to [25], the visual representation is also a strategy. For an understanding that is easier and can invent the basic structure of the problem. According to [26], from the visual representation, there is also a heuristic step, so the student has an understanding besides the productive visual. M. Wertheimer [24] states, through the heuristic step, would be seen the structure rapidly.
mental imagery and used for manipulating the spatial information. As a cognitive strategy, the mental imagery conducts a control process involving a choice and changing a way of thinking. After the imagery controlled, [27] argue that an elaboration took place and the mental imagery raises as a non-verbal representation of an object. In solving a problem it is required a process that is beginning from association, classification, and then attribution, so someone can be got a connection and finally to draw an inference. The inference means getting more information than directly found from an algebra expression. J. S. Bruner [29] also states that: (1) the intelligence growth related to the ability to process an idea and deliver it with the help of an image or a picture, and (2) the cognitive development is associated with an alternating thinking ability simultaneously. And, according to [30], to learn mathematics is to do that through finding and thinking of the perceptions. In this case, one of the importance of the learning math is to associate the analytic representation to that visual, so human intuition works better.
Nowadays, the mathematics teaching and learning need preparing to anticipate a research result that the imagery will be a mainstay. Therefore, at least there are two factors in the teaching and learning mathematics, those are: (1) the heterogeneous of the reasoning theory, and (2) the learning activity based on the brain. The heterogeneous of the reasoning theory explains that the human mind isn’t classified by only one representation system. If so far the analytic or abstract representation is the most prominent then the visual is also as a reasoning tool in the teaching and learning mathematics. The importance of the brain-based learning is for: (1) motivating mind; (2) acquiring information; (3) searching out meaning; (4) triggering memory; (5) exhibiting knowledge; and (6) reflecting how to learn.
The six importancies rely on the human imagination that tends to visualize the information. That is why the visual urgently to be implemented in the teaching and learning math. According to [31], the learning mathematics is: (1) to learn the relationships among the intuitive thinking, the visual, and the formal; (2) to explore the relationships between them; (3) to raise the genealogy; (4) to issue the sanity; (5) to enhance the learning ability; and (6) to increase the exegesis. For example, [32] state, the experience can bridge a gap between the knowledge, the skill, and the preparation of a proof. And, according to [33], the intuition, the insight, the experience, the diagram, and the graph have a role in solving a mathematics problem.
The importance of the intuition in solving the mathematics problem based on two arguments [34], those are: (1) the mathematics truth is not independently as the spirit of the mathematical thinking and (2) the truth directly caught by the mind. For example, in order to prepare the solution, firstly by constructing the illustrations. After that by developing conjectures although not all of those illustrations can help the student in organizing the solutions [35]. E. G. Begle; A. H. Schoenfeld [12, 36] state that the formal and the informal deduction must be interacted and also mutually reinforcing.
The informal is limited, but there is a research result showing that the deduction not negatively influenced the formal. For instance, the research conducted by Martin and Harel in [2] show that more than 50% of elementary teachers receive the informal. E. Fischbein [37] invented that the students of the higher education were still preserved the informal, although they already learn the formal. In a study to the higher education students, D. H. Clements, and M. T. Battisda [6] invented that 18% of the state that one counterexample isn’t enough for disproving a statement. F. H. Bell [38] feel confident that the students will not deduce formally before reorganizing the truth and observe the effect of general verification. Talyzina in [6] states that albeit an internal test gives in the formal deduction, the students not necessarily implemented it, even the consideration of an idea is still for the general proposition and an image separately. The students often used a visual in making an assumption and avoiding the reasoning.
According to Brown and Walter in [36], the deduction visually is a deep thinking phase because not depend on algebra equations. Psychologically, through the image, the students’ ability can be growth, like creativity. That was a visual ability, a kind of the beauty of the problem-solving that will raise and also can skive the students of the fear of being creative. At least there are two benefits of the visual deduction, i.e.: (1) pedagogic propadeutic and (2) humanistic links. The first is related to human activities which trying to fulfill the insight of the thinking hierarchy. While the second one based on the understanding that the teaching and learning mathematics not absolutely claimed the mental exercises for thinking logically, but also for answering a question: What a reflection of the mathematics experience used as the starting point in developing problem-solving ability.
According to [39], an understanding of the visual representation and to visualize the ideas are important. In learning, the thinking phase not needs to be directed to the formal but adjusted with the students’ psych development. For example, in determining a relation with the specific requirements, the students can use a Venn diagram or constructing a visual from a function to generate the images of the problem situation. Z. P. Dienes [40] state, a non-symbolic generated a deep understanding by using the models of the visual. While R. Gelman [41] state that the variation of the representation dimensions of a quantity gave the students a practical ability that enlarged. Therefore, the visual representation in teaching and learning are also the mathematics activity as stated [42] that, when faced with a problem, the students utilize the visual to hold the thinking process.
The visual ability understood as a processing system of a symbol configuration and is not the system of the verbal relationship. The system is an experimental solution to a problem in psychology and education. For instance are a strategic role and a heuristic process, the unconscious processing, a spatial visualization, a pattern recognition, and an insight.
G. A. Goldin [44] states that a system of symbol configuration needed in processing an image. According to [45-46], although a concept verbally, but represented visually (concept image). In cognitive psychology stated that the concept coded in analog and propositional.
The visual takes a role in the teaching and learning mathematics, i.e.,: (1) in accordance with a concept [47-48]); (2) the visual is in the spatial ability, as shown by [48] to understand the visual information used in calculus; and (3) the visual delivered to the formal thinking ability.
The visual ability is not the lower thinking level as stated by [49] that is individual. Also confirmed by [36] that the visual thinking ability considered as a strategy for someone. For example, in experimental physics, [50] invents that the experts think visually.
The visual is basically in mind. R. R. Skemp [51] states that a perception of the visual involved a concept although lowly. The visual can generate memory activity and simplify the concept representation learning. H. A. Simon [52] states that visual representation better than the formal. The visual is more related to a concept than the analytic. While the analytic is not a relation between the learning experience and understanding the concept. A. D. de Groot [53] states that doing mathematics used more the visual than the analytic representation. Piaget, in [8] state that someone ability is more in the visual comparing to the analytic. R. Zazkis; Dubinsky, Ed. and J. Dautermann [8] state that the students always used the combination of the two representations. Therefore, the visual and the analytic is not a scheme separately in the process of the teaching and learning process. Teaching and learning of the visual abilities linked to a belief system. The system defined in different ways and to the discussion in mathematics education. The components are of how mathematical problems solved. Prevailing beliefs have perceived as impediments to problem-solving based on the mathematics curriculum and of classroom teaching methods.
Mathematics education is to change and develop learning. The learning accommodates new insights and perspectives. In the approaches, the conflict occurs at teaching and learning activities. The belief is in the identity of learning to cognitive structures and not problematic. It organized as a mental process without changing. For example, mathematics is arithmetic analytically, computation and calculation, and extendable to algebra and geometry. In the classroom, the point of view encouraged, or the algebra disconnected from the arithmetic. There is no universal visual pattern, but in the context of change and development approaches mathematics education that modifying a curriculum entails far more than replacing the syllabi or the textbooks.
2. Method
This research scrutinized and probed the visual ability related to the visual representation. The question to be addressed is: How do students come to their mathematics identities based on visual imagery?
The intent was to explore the students’ visual imagery and to provide initiatives designed to improve the teaching performance. In this sense, the learning “changes whom we are by changing our ability to belong” [19]. This research involves the development of each student’s identity. Through relationships and experiences with the students, the researcher comes to know their relativity to the visual ability in solving mathematics problems.
This research was a teaching mathematics activity during 2017. For one month the researcher saw the students’ visual imagery as the learning identities and explored during the course. There is to date no formal assessment instrument for identifying visual imagery. Identification is best by taking a comprehensive discussion that includes the early and current visual, using a tracer format of the characteristics and asking the student to complete tasks involving visual processing and those utilizing visual abilities and comparing the results visually. The diagnosis of visual imagery complicated by the fact student who has been struggling with underachievement for many years tends to present just the right answer.
2.1. The Subject
This research concentrate on the type of visual imagery identity “at risk” in the class environment unless their learning identities identified and appropriate modifications made to the learning and teaching practices. The research subject is the students of mathematics education at Tanjungpura University, Pontianak, Indonesia, registered in 2015 until 2017. The performance of the test measured by the scoring of three item groups, which each group consisted of two items. The score of the first group based on (1) visualizing and solving the problem associated with that visual representation and (2) visualizing and solving analytically. The second group test based on (1) manipulating the visual and using that for solving the problem and (2) manipulating the visual and solving the problem analytically. And the third based on (1) constructing a visual and solving the problem visually and (2) constructing a visual and solving the problem analytically.
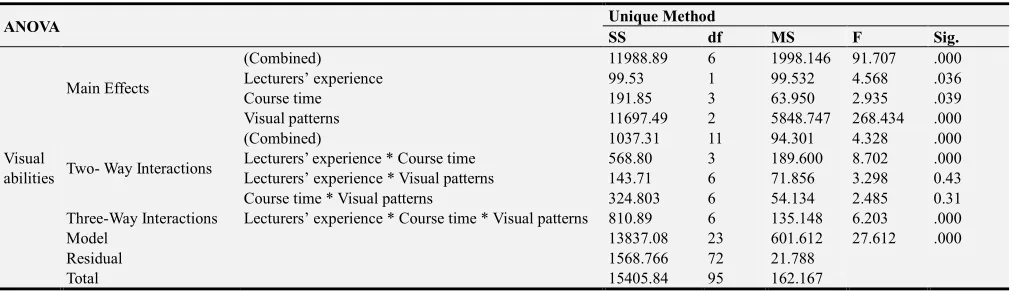
The visual performance tested by the Kolmogorov-Smirnov for normality. The asymptotic significance value is 0.56. The asymptotic is bigger than significance level 0.05. The absolute value is 0.15, smaller than in the table, 0.25. From the homogeneity testing by U Mann-Whitney obtained the counted value is 131.50 that is bigger than the table, 126 at α = 5%. Therefore, all groups are homogeny based on visual abilities.
critical values, 0.05, is smaller than 0.07, and the counted Levene, 0.64. So they are homogeny based on the visual abilities.
2.2. Instrument Development
Data collected and validated by the face and the content. The content validity weighed by five experts. The analysis used a statistic of Q-Cochran Test, that is 28.47, bigger than the Chi-Square of 18.48. The decision is that the raters weigh the validity of the instruments is the difference. Analysis of the face validity is the chi-square test. The values are χ2 = 10.00; 4.90; 4.90; 6,40; 4,90; and 4.90, comparing to χ2 value in the table for α = 5% and degree of freedom equal to 1, that is χ20,95(1) = 3.81. Founded that the probability of the raising
visual pattern is 0.75 for item number 1 and; 0.68 for item 2, 3, 5, and 6; and 0.70 for item 4. The degree of the relationship between the raising of visual pattern or not in every item high based on the contingency coefficient, i.e., C = 0.71. Therefore, the face validity of the research instruments are high, or it can measure the visual abilities.
The scoring is for each of the test instrument related to one or more of: (1) visualizing and solving visually; (2) using a method based on the analytic or the visual; (3) manipulating and solving the problem visually; (4) using the axiomatic system visually or analytically; (5) completing the visual visually or analytically; (6) relating between the conceptual and the structure; and (7) constructing the visual visually or analytically.
2.3. Comparison Instrument
After the teaching program, given a set instrument of the National College Entrance Test of Indonesia in 1999 as a comparison. Those are visual problems working with four abilities which measured in this research, namely visualizing, manipulating, completing and constructing a visual or figure for solving the problem. The instrument modified, i.e., from the multiple choice to an essay by the rsearcher. The modification was developed by adapting questions from a mathematics class issued by the researcher. The items are in the testing scope of this study and two experts in the field of mathematics education were used to assess the content validity. The alpha coefficient = 0.75 indicates the reliability of the instrument. The test is to see the changing of the visual ability. The visual patterns are related to (1) visualizing the problem; (2) completing a visual; (3) working illustratively by a perceptual viewpoint; and (4) thinking analytically.
2.4. Research Design
This research is teaching activity during two semesters. Data collected through the administration of the instrument to all students. The questions assessed the students’ mastery of content knowledge based on visual ability, evaluated quantitatively, and qualitatively by the categorized visual imagery.
Visual learning is a problem-based. In solving the problems: (1) visualize appropriately; (2) use the visuals
correctly; (3) complete the visual entirely; (4) manipulate the visual exactly; (5) change an analytic or algebraic representation to the visual appropriately; and (6) resolve the problem visually. The learning describes and develops the material of the visual abilities with five lecturers. After preparing it, the researcher gives to the lecturers for validating.
The objectives are (1) sharing of visual representation in solving math problems; (2) validating the material prepared, including descriptions, illustrations, questions and solutions; and (3) evaluating the researcher’s performance of the visual abilities. The abilities are: (1) visualizing; (2) completing and manipulating using the properties, (3) solving based on the visual; (4) connecting the formal symbols to the visual, (5) constructing of the algebraic, and (6) solving of the visual construct. The exploration conducted through three lectures, each for hundreds of minutes, and discusses the three visual abilities, i.e., the first, the second and the third visual ability. After finishing the first visual ability, the teaching material analyzed and revised. In the second meeting, the revised material discussed and reviewed for the second visual abilities. After the second meeting, the revised materialwas used at the third meeting and followed by a review. The last revision used as hands-out treatments in class. In the exploration was given questions to five lecturers for validating. The subjects work on a problem of higher algebraic analysis skills, namely to complete the visual in the expression. The purpose is to improve their visual abilities.
The visual ability examined by sorting into attributes regarding visual imagery. Questions categorized and provided for the data analysis. In explaining and extending the quantitative, narrative data from the follow-up examinations explored.
3. Result
Question 1: A pyramid cut at the top which is parallel to the base, i.e., a square. If the base side is equal to a unit and of the cutting plane is b, and the altitude of the pyramid is h, show that the volume of the lower pyramid is equal to (h
(a^2+ab+b^2))/3.
For the question, the visual ability aroused no holistically in the solving. The solution deduced is not from the right visual representation. For instance, drawing the altitude outside the pyramid, not put down the intersection point of the line exactly to the base plane, and not find the congruent triangles. The visual analysis not yet appeared in the solving. That related to mathematics learning so far, namely the visual analysis contained in geometry prioritizes the deductive system. The learning concepts emphasized the ability to analyze problems and apply rules to the systems. The learning increases the analytic ability, not to the visual. In Indonesia were found the identical [7], namely manipulating the analytic by cases and manipulating deductively or analytically.
Determine the minimum function value f (x, y) = 2x + 3y for the triangle area.
Figure 1. One of the visuals of problem 2.
There are nine types of answers to the problem. One of them illustrated in Figure 1. The shaded triangle decided to match the problem. So,: (1) the line of x - 5y = -20 not visualized correctly and (2) does not intersect the line of x - y = 0. The visual representation not stated because of the error, i.e., that representation is associated with the visual recognized. The solving of the constructed triangle from the three intersection lines based on their visual imagery, so there are some mistakes. The types of the mistake are: (1) not visualized line with equation x - 5y = 20, so the constructed triangle different to the problem situation and (2) visualization of that equation is not intersecting line x - y = 0. There is no visual, so the analytic solutions cannot bring them to conclude the minimum value of the function. There is an insection point of the two lines but no the minimum value. There is doubt whether the minimum value occurs at the point which is the intersection of lines x + y = 0 with x + y = 4 or the other line pairs. There is a misunderstanding of the dimension of the equation. Found that, the triangle XOY visualized in three dimensions. The visual is difficult in determining the intersection point having the minimum value of the function. And, the tabulating domain and the range values and function range analyzed does not have an answer.
Question 3: Given a regular pentagon ABCDE with one unit length of the sides. Show that the diagonal is (1+√5 /2.
The answers do not pay attention to the visual characteristics. The subject’ answer by specifying the triangle formed from two sides of a pentagon and the diagonal is a right triangle. They cannot see the diagonal as a dividing line, and not yet observe the existence of the corresponding triangles. The analytic representation always appears but no meaning, and the difficulty is in making connections. The solution of the analytic and visual was separated and interpreted that the analytics are misleading.
Linked to the performance was invented: (1) visualizing not all lines of equations; (2) no visual representation; (3) no the minimum value on the visual triangle; (4) mistakenly the spatial dimensions of the equation; and (5) tabulating the domain values and the function ranges.
Question 4: Given trapezoid ABCD and the rectangle EFGH. K is the middle point of EH and L of FG. Show that the area of the trapezoid is equal to the rectangle. The visual of the problem showed in Figure 2 below.
Figure 2. The same area of the trapezoid ABCD and the rectangle EFGH visually.
The most prominent type of the error in the analytic representation is in manipulating symbols to get a relation so that the problem solved. The question is, show that the area of the trapezoid same as the rectangle. However, the solution is not always as rigorous as the mathematical.
The solution compiled by the subject of Figure 2 as follow:
(KD)^2 = (KH)^2 + (HD)^2 and (KA)^2 = (AE)^2 + (EK)^2.
Then, the subject continued the solution by writing that sqrt (KH^2+ HD^2)=sqrt (AE^2+EK^2). From the answers, no solution obtained, but in the arrangement of the answers, it appears the manipulation of the symbols. Writing down that is the fact that the conclusions not done mathematically, but perceptually based on the subject's beliefs. The problem is in (1) manipulating the visual, using the properties or concepts applied to answer the given visually; (2) using the origin constructed visual, applying the rules to answers analytically; and (3) not manipulated, not using the rules to answer analytically; (4) manipulating the visual, using the rules to answer visually; (5) manipulating the visual, using the rules to the given and the answers analytically; and (6) not manipulated, not applying the rules but the answers analytically.
The solution still based on the perceptual. That is in: (1) concluding the AK line segment is equal to the KD; (2) using numbers, i.e., for EF, HD, and CG, and then calculate the rectangular and trapezoidal areas using the formula; (3) relying on the rules of transformation, without showing the rotated triangles congruence to the others to broad the similarities; and (4) still prioritizing the symbolic or analytic manipulation.
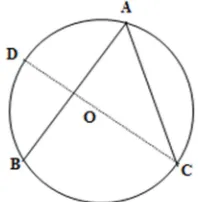
Question 5: Look at Figure 3. The circle centered at point O through the vertices of the triangle ABC, BC = a, AC = b, AB = c unit, and CD is the diameter of the circle. Show that a/sin A = b/sin B = c/sin C.
The solution comprises of (1) turning any triangle into a right one; (2) cannot take the visual given; (3) cannot complete the visuals based on the facts; (4) incorrectly applying the sine concept, that is not between the right side and the sloping; and (5) do not visualize the diameter correctly, i.e., not described through the center of the circle.
The answers are: (1) using the geometric properties and (2) using the and compiling analytically. The visual ability is the performance in (1) using the visuals and (2) manipulating the visual. The subject's performance regarding the ability is still prioritizing the power of algebraic manipulation rather than clarity of facts and the visual, i.e., the solution used analytical representation by the algebraic. They get a solution using symbolic or the analytic by a formula, but the visual concluded perceptually, and form an analytical solution. The solution changed visually but arranged algebraically. And, the formulation by visual manipulation, but the manipulation was carried out based on the initial belief.
The types of solutions still show consistency in the level of thinking of the subject, namely visual perceptual. However, the power of analytic manipulation influences the completeness of the subject's visual perception. In this case, only see parts of visual and use in preparing analytical solutions. The visual representation not associated with the analytic or between one way of presentation with other do not play a role together in solving the problems. Thus there is a difficulty or an inability of the students to construct mathematical knowledge. N. Tadao [3] states, there are five ways of representing, namely realistic, manipulative, illustrative, linguistic, and symbolic play an important role.
Question 6: Calculate the area of the shadow region in Figure 4.
Figure 4. The intersection of parabola function y=x^2 passing through points A, O, and D and two lines, BD and AC.
The problem visualized correctly, that is, PAB and PCD are not a triangle, because AB and CD are parts of the curve y = x^2. From the visual, required an understanding of the area obtained according to the appropriate analytic representation. The visual ability is high and gets kinds of the analytic. A solution to the problem, if analyzed according to the visual ability explained that: (1) the problem correctly visualized; (2) from the visuals, it saw that the problem requires a visual understanding of which then obtained
accordingly; and (3) If the visual ability is high, then the subject will get various of the analytic representations.
The errors are: (1) calculating the area of the BAO equal to
0 2
3 x dx
−
∫
; (2) calculating the area of ABCD equal to
9
4 y dy
∫
;(3) calculating the area of the BAO equal to
0
2
3
(x 6 x )dx. −
+ −
∫
; (4) viewing the visual PCD as a righttriangle as a belief system although different concept used; (5) understanding the lines BD and CD intersected and form an angle of 450; and (6) calculating the area of PCD by the formula.
Another solutions are: (1) the area of PCD =
6 6 and getting the
absolute value; (2) The area of PCD =
9
4 y dy−
∫
the areaDEP – CFP; (3) The area of PCD= 6
; (4) The area of PCD
= the area of trapezoid FCDP - 4 – the area of CFP; (5) The area of PCD = the area of trapezoid FCDP -
4 – the area GKLC – the area CFP; (6) The area
of PCD = the area of rectangle FLDE - 4 – the
area of DEP – the area of GFP; and (7) The area of PCD =
the area of PMD - 6 .
The composition of the answers is uniform, that is wrong
or using the same integral, that is
(
)
(
)
3 2
2 2
0 0
6 6 .
x+ −x dx− − + −x x
∫
∫
Subjects who answeredincorrectly because of the visual representation about the area under the curve with corresponding analytic presents in the form of certain integrals, although the direction of their answers was to use that definite integral. The error of using certain integrals in solving the problem can be understood as a mistake to understand the relationship between analytic presentation and visual presentation.
The answers are differences. The different showed the ability to analyze the visual and connecting to the analytic. There were no differences in visualizing the problem, but the answers are significantly different. According to the ability in visualizing, there are no differences, namely correctly visualization.
In the first question, the difficulties arisen are: (1) in making a wide range of visuals that equal to another; (2) get visuals after transforming; and (3) find a visual that extends the same as the network created. Based on these difficulties, researcher compiles the proofs of Pythagorean
sequentially, namely visualizing, completing,
next problem.
The difficulties in solving the second question: (1) getting a visual in the same area with the other; (2) getting a visual that has the same area as the visual, but tricky to get the visual with the same area; and (3) the results of the transformation of the produced visual do not clearly escort the subject to the answer. For the third question, found that: (1) the subject could not see that there are the same visuals and (2) they could not see the congruency in the given visuals. In practice found difficulties (1) the subject was not able to determine a visual formed from the sides of the visual and (2) they cannot see the existence of the congruency. The visual abilities are analytical skills and visual manipulations.
Reviewing the invented of the proposition was found difficulties: (1) linking analytical representations with the visual; (2) in completing the visuals to determine the analytic; (3) in recognizing negative numbers relating to the visuals; and (4) in understanding the relationship between an area and a quantity. Learning the visual is a reciprocal relationship between an analytic representation and the visual. The learning is an ability in making a relationship and building skills, namely the ability to solve problems based on the visual.
The answers analyzed according to the visual patterns. Visual patterns that should appear in the problem are: (1) visualizing the problem situation correctly and (2) completing the visual by using the properties.
After completing, the subject can see the existence of the visual properties and get a comparison of the visuals. However, from the visualization, there are still three kinds of answers, namely: (1) the subjects determined the ratio of the visuals; (2) the subjects drew visuals, but the conclusion is not right; and (3) the subjects perceptualized the same visuals and used the ratio. The visuals made are: (1) by measuring the visuals and get the ratio; (2) by solving visually; (3) not solving analytically; and (4) by completing the analytic.
The difficulty in solving the visual problems are: (1) not visualizing correctly or inappropriately; (2) not showing the visual in the analytical; (3) not using the visual in solving the problem ; (4) not based on the visual but perceptual; (5) not analyzing formally but illustratively; (6) not doing from the visual but rely on the rules; (7) because of changing the visual; (8) not utilizing the visual; (9) applying the concept inappropriately; (10) inconsistency in working on coordinate systems; (11) not linking the visual and the analytic; (12) not representing the symbol to a visual; and (13) not manipulating the visuals.
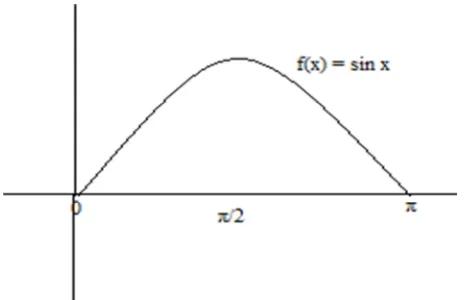
Statistical analysis of the data there was no relationship between the types of errors with the visual patterns. The data from the Weiner Model regarding the errors indicate that the students were not able to visualize the problem so that they cannot solve it. The visual is a reconciling factor and become a belief to solve problems. The researcher found from a matter of determining the volume occurs when a graph rotated around the X-axis, i.e., see Figure 5 below.
Figure 5. The graph of the function, f (x) = sin x, 0 ≤ x ≤ π, rotated 360 degrees around the X-axis.
That is the comparison test: To find the volume of the visual of sinus function between 0 and .π After visualizing the problem, did not use in the solving. They use a formula
(
)
20
sinx dx π
π
∫
to find the volume. However, even though theformula is correct and used, the difficulty is in determining the integrals because of the relationship between the function of sin2x and other goniometric. If the visual is equipped or manipulated, for instance by constructing a rectangle and the relationship between the regions under the curve f (x)= sin x and the function f (x) = 1 with the X-axis then, the problem appear easily. Although it may take longer, the chain of reasoning is not interrupted as in the analytical representation.
Visualization problem using the visual on R2 is an inaccurate fact. That must also be represented by the other dimension, like on R3. Although the visualization brought out in R3 is more difficult, it is not only using the practical method but the formal mathematics features.
The error of the visualizing turns out to be difficult for an analysis of the visual. The subject's perception of the visual disrupted so cannot use in solving the problems. In this circumstances, the students cannot relate the visual with its analytics. In the mathematics education literature, such events namely as a discontinuity of the analytical [54].
The other comparison test is to show visually that if a<b<0 then -a^2<-b^2. There are errors due to the inconsistencies using the rules in placing a positive and the negative numbers. At one time, the positive number placed parallel to the X-axis, but the negative to the Y-axis. The subject does not use the manipulated visual but composes an analytical solution. So, there is an error in making the analytic relations, i.e., from the visual obtained –a^2<-b^2, but the conclusion a^2 > b^2.
Completion of the problem, in connection with the visual, said that there is a belief system based on the perception. The belief system often influences performance in solving problems [56]. For example, the subject expects that a line segment is several times of the other.
Visual perception influences in solving the problems even that is often a belief. Also found that a level of thinking on a visual and a nonvisual perception might be different. For example, when solving a problem with a visual mainly acts as a tool, while the composition of the nonvisual shows the ability to think formally. When working that require the visual, the thinking stage is not yet a formal but a new optical illusion.
The last comparison test: Show that the radius of the sphere passes through the points of the cube with a side equal to 1 is π√3. Found that the subject had a good and correct understanding of the space diagonal of a cube, including the position when rotated. When the cube equipped with a sphere and the subject asked to find the radius, they cannot get the relationship between the diagonal and the diameter. For example, the subject calculates the radius of the ball is equal to half the lateral side plus the distance from the point of the diagonal intersected with the surface of the sphere. It turns out that optical illusions that become beliefs because someone's visual perception is not as well as can change the level of thinking.
The answer described a sphere by making a circle through the eight cube points. The visualization is incorrect, describing it as a circle with the diameter is the diagonal side of the cube. The answer does not show the visual in compiling the analytic, the analytic to the visual but the original visual does not exist. That is, the cube diagonal with side 1 unit is √3, and the spherical radius is equal to ½ times the diagonal or equal ½√3.
The difficulty grouped as (1) the diameter of the sphere equal to the diagonal of the cube, but no size of the plane diagonal; (2) inaccurately visualizing the planes; (3) the cube and sphere; and (4) does not show the visual used in the analytic.
Also found that the subjects solved the problem by using an event. They want to show the similarity between the two (or more) geometry figures by using the formulas. They were not formally or not do abstraction. This finding reinforces the results of research conducted by [7] that the subjects were still proved mathematical problems illustratively.
The researcher found: (1) the changing visuals made by the subjects are into a recognized figure and (2) they drew up a solution from a special event. For examples: (1) specifying the magnitude of the visuals objects; (2) making the relationship between the visual and based on the other; and (3) stipulating the recognized visual.
The solution to the problem visually is to use the existing facts and completes it to get the answer. In this idea, the visuals play an important role. For example, the subject requires a visual by connecting and drawing. The solution shown by the student is the procedure of a relation between a visual and a visual. According to [41], the connection
demonstrates an informal understanding, i.e., a triangular visual representation. That is an ability in the cognitive domain.
Regarding the requirements, the student connects a visual with a visual and constructs another visual. The ability is to make mathematical arguments or arranging the structure. For example is to get the visual and similarities. These abilities are closely related to a conceptual understanding and the arranging structure. Conceptual understanding is a relation between the concepts, while the arranging structure is an ability to relate the concepts.
In the matter of visualizing a problem, the student uses an analogy strategy. The students’power is to manipulate the analytic representations. Those are:(1)constructing visually but inconsistency in placing and using a scale, (2) doing an algebraic manipulation, (3) taking special events, and (4) constructing some parts of a visual construction of a whole.
The researcher also found that the longer time of a course did not affect the visualization performance. Their performance distinguished qualitatively only to a formal or analytic solution. The subjects who are in a higher semester tend to the analytic, but still illustratively.
In proving, the composition of the solution is correct. But, conceptually, that is wrong, because of a formal definition. Although the students made a valid logic, they show the hierarchical confusion of the stages of thinking, namely from formal to concrete or illustrative. The conclusions indicate an understanding of the visuals not as the concepts, but properties physically. The subject views the visualization in different shapes, or, they think of a visual object which converted into the others.
In constructing the analytical understood based on the pattern of mathematics learning, namely the more symbolic or abstract with the deductive logic. P. M. Van Hiele [57] states the learning pattern is not always suitable for students with smaller intuition and not feel the logic. Susanna's statement strengthened the results of this study, namely to develop the solutions that rely on the power of the deductive. For example, although given an example of a visualization that shows the truth of an algebraic relationship, the subject does it analytically. However, among the completion of the symbolic analytic, there is an answer structure that still relies on visual representation.
The finding means as abstract thinking [58]), but not effective [59]). According to [4], the visual thinking means as the thinking on the concretization. The researcher found that the visualization helped in preparing the representations, for example, many analytic decisions made based on the visual. From these findings, interpreted that: (1) there has been a manipulation and (2) the symbolic manipulation required the deductive difficult in solving the problems.
require practical skills.
4. Discussion
According to the results, the students are required to answer based on the visual representation and that thinking of their content knowledge. Since the questions were selected and modified from authoritative resources comparable to the traditional exam level, all students’ results were also evaluated at all level of the visual abilities to see whether they had sufficient content knowledge is visual.
Visualization of all items shows the consistency in determining a triangle shape, without visualizing the known line equation. In this case, it observed, whether the subject knows the problem, whether they think the problem, and whether they understand the concept of the triangle facts. The answers to these three questions depend on the ability to understand the informal representations. R. Gelman [41] states that understanding of informal is related to intuition about the characteristics of objects in a particular field. Such intuitions also underlie formal abilities which are abstract objects of mathematics. The inaccuracy of visualizing related to the lack of that because according to [59], people who have better visual abilities will reproduce the accuracy so that the problems solved.
The visual ability in mathematics learning included the intuitive or informal thinking that separated from the formal. Even though these two types of thinking abilities not easy to separate [41]. The other study indicates the students encoded the visual information in an analogous and non-propositional manner [60], and conceptual errors occur because of the visual, such as optical imagery and perceptual expectations [61].
The composition of visual that gradually constructed or visual knowledge possessed by the subject interferes with their perception so that the resulting are adjusted or understood to get a visual form, namely a triangle. That is accord with the research results [59] that in visualization tasks, a person's knowledge can interfere with his perception so, that produces something expected to understand from the conditions. Thus, the visual ability has not become a source of expertise in solving mathematical problems, but especially those with visual features.
The visual perception that interrupted by prior knowledge caused the visualization of systematic error when linked to the correct composition of answers. For example, the students do it by trial and error strategy to form the visual constructed visually. The solution, when connected with the opinion of [58] that the subject visualizes the perception structure directed to the known or recognizable. The composition of visual perception known by a person emerges as a perceptual. Thus, as stated by [41], that the response produced by a person is not specific to the situation, but tends to the type described.
When examined the visuals, a solution still shows the role of perception that not specifically addressed to the visualized situation. For example, from the visualization, resolves a
problem by writing the others object of the visual. The solution proved that the subject does not have a visualized scheme that allows them using it effectively and efficiently in solving problems, especially those with visual features.
The subject's performance often also brings to the wrong solution. For example, there are still subjects who have not able to distinguish between a space diagonal and a lateral diagonal, have not been able to recognize a circle from a ball, and visualize the problem situation carelessly.
The subject's performance in accordance with [62] are: (1) categorizing into the natural identities, (2) grouping new experiences with the previous even that not analyzed, (3) scheming information of the characteristics that useful in solving new problems based on experience, and (4) using the knowledge to interpret new problems.
This research found the visual problems solved by the perception. For example, the length of a line segment is the same as another, but they are different. G. A. Goldin [44] states at the visual perception describe reasons based on optical illusions. There are still students who are at the level. Therefore, learning mathematics formally made a difference between visual ability and perceptions.
The results of other studies concerning visual mathematics show that the students only inclined to formulate answers formally. For example, [21], in their research, found that students still think intuitively, their arguments are formal, that is, showing the truth by using numerical examples, and even that happens not only to the lower levels but also appears for the students a major academic in mathematics.
This research conducted learning that prioritizes the visual problems or solving it visually. There are three abilities, namely: (1) visualizing a problem, (2) manipulating and completing the visuals, and (3) constructing visually from the analytical.
The visual saw as direct learning and the images are already known. The objective of the visuals are:(1)ability to make connections between the analytic and the visuals [22] to solve correctly; (2) ability to solve the problems visually so that the optical illusions and perceptions do not appear; and (3)ability to manipulate the visuals so that activities and thought processes can occur in the visual.
After learning, the ability to make relationships did not increase, i.e., the optical illusions appeared but statistically was not different, and the visual manipulations increased. The subjects tend to choose the analytic or compile the relationships from the visuals and the symbolic or abstractly. They still rely on the optical illusions are a less significant difference, while the ability of the visual manipulation increased significantly. In the connection, found that the visual was not accompanied by the analytic.
From a visual problem, the resolving distinguished between the explanations and the construction process. The first term relates to the composition of the symbolic analytic, and the second linked to a manipulative visual. According to [18], the visuals are more helpful in presenting the thinking processes than the language and symbols. The visuals manipulated more used than just as tools. The activity in the manipulating the visuals are abilities in presenting a chain of deductive reasoning. L. C. Hart [63] states that the verbal is sometimes difficult understood, whereas the visual can help in understanding the problem situation, especially when the problem is difficult represented only by the verbal.
After the visual learning, found that the types of errors changed, both quantity and quality. Before, the errors are the same types. Generally, due to (a) the visuals not used in solving the problems, (b) compilation of the analytical and of the manipulation, and (c) mistakes in understanding the visuals as concepts.
After learning, found that the subjects who relied on the analytic answer the problem incorrectly, while from the manipulated visual, they answered correctly. The error is about the completeness or in using the specific cases. But, the correct answers based on the visual and of the creations. The patterns of the analytic errors are similar, namely in making the relationship between the visual representation and the analytic is wrong, in using principles or the visual features, in visualizing the problems, and in using deductive logic.
W. E. Lamon [64] states that a solution by checking verbally or by linguistic is a difficulty. The difficulty could eliminate by improving the visual ability. L. C. Seng [62] states the verbal represntation is difficult to answer, but the visual can help in understanding the problems.
The research found that the formal ability was low and occurred because a visual not yet manipulated. Similar to the result of refrnce [20], i.e., through the manipulation, it is easier to find the answers. Through visual manipulation, the abilities increase in geometry and algebra. For example, [65], found that: (1) the visual test was significantly correlated to the algebraic, and (2) success in algebra tests requires the process of completing the visual patterns and the reasoning, but only requires visualization.
To understand the students’ cognitive understanding are in analyzing the problems visually. The students’ written work found similarities in certain features and the differences in others. Similarities between the problems consisted of: (1) assessing the students’ knowledge regarding the visual and their capability to associate the formula; (2) not providing the algebraic equations for the visual, which demanded the determination of the equation; and (3) a similar level of difficulty since the problem gives out explicit the visual.
Being able to determine the visual was the premise to answer by applying the formula identified from the representation. The results revealed that nearly half of the students responded incorrectly. Varied reasons are to address the misconceptions. The students were unable to pinpoint the visuals to identify the manipulated visual. For instance, wrote
a point that was not on the constructed visual. The students appeared to be unfamiliar with the formula of using the visuals.
The findings are related to the visual analysis in a geometry lesson unit featuring the deductive formal. Means that the ordered of mathematics study get started from a concept emphasizing on the ability of the problem analysis and implementing the rules of the axiomatic system. The resulting related to the finding of [21], states that mathematics teaching improves the ability of the analytic representation. The analytic that always arises in mathematics is still meaningless, so the students had difficulty in making relation or in making a connection and giving the meaning in the analytic. This finding is analogous to [66] that the students still separate between the two representation. The statement of [55] interpreted that the analytic is often wrong meaning. For instance, the students do not relate the analytic and the visual representations when showing that: If a/b < c/d then a/b < (a+c)/(b+d) < c/d. As a result, there is no meaning for the visual representation of the proposition.
This difficulty is when compiling the solutions, namely the visual placed in a heuristic sequence. For instance, linked together however not written down the visual thinking. However, without observable connecting ideas, the information cannot take hold anywhere, it is like learning in a vacuum and seems to the student like pointless exercises. The researcher often misinterprets the student's difficulties with the instructional strategies as an inability to learn concepts and think that the student needs more drill to grasp the material. Rote memorization and drill are damaging to the visual ability since emphasize the students' weaknesses instead of their strengths [67].
There are two keys to teach the visual representation, i.e.,: (1) understanding that if the students are not visualizing a problem, then they are not thinking and so are not learning and (2) teaching to their strengths not concentrating on remediation for their weaknesses. It should be that material presented visually wherever possible and that motivation for these students be switched back on by their experiencing success.