DOI: 10.14738/abr.612.5832.
Diakomihalis, M. N., Mougios, N., & Diakomichalis, N. M. N. (2018). Taxation and competitiveness of the Greek travel agencies. Archives of Business Research, 6(12), 272-289.
Taxation and competitiveness of the Greek travel agencies
Mihail N. Diakomihalis
University of Ioannina. GreeceNikolaos Mougios
Ministry of Finance,
Miaouli 28 Peristeri, 12131. Greece
Nikolaos-Marios N. Diakomichalis
University of the Aegean (MSc). Greece
ABSTRACT
The purpose of this study is to investigate the impact of the tax burden on the travel agencies in Greece as compared to the corresponding effect of taxes on the travel agencies of the competitive countries, Spain, Italy, Croatia, Malta, Cyprus and Turkey. The aim of this paper is to reveal the impact of taxation on the tourism sector of Greece in relation to the travel agencies of the competitive countries. A primary research was conducted in the travel agencies of Athens metropolitan city. The results of the research showed that the gross sales increases with a decreasing trend in the years 2014–2016. Furthermore, package tours sales are falling with the highest decrease being recorded in external package tour sales (-6.17 %). The sales of internal package tours record a decrease of 1.44 %. The Greek travel agencies believe they have financial losses and competitiveness decline because of the increase in income tax and Value Added Tax (VAT). They consider that have experienced a fall of approximately -53.33 % in gross sales, as a results of losses from Cyprus, Turkey and Spain. However, the Greek travel agencies appreciate that the level of their competitiveness (based on the differences in income tax and VAT rates) is the lowest in relation to the aforementioned competitor countries, assessing the most competitive travel agencies to be those of Cyprus, Turkey, Spain, Croatia, Italy and Malta. The limitations of this work include the issue of fiscal policy which focuses on and explores the main taxation of income and VAT and their rates, ignoring other “secondary” taxes, fines, etc.
Keywords: Taxation, Tourism, Travel agencies, Competitiveness, Greece
Jel: H250, L830, D400
This paper is a revised and expanded version of a paper entitled “The influence of taxation on the competitiveness of the Greek tourist agencies: A case study” presented at the 5th Aegean
University Tourism Conference and 13th IMIC Conference: «Tourism: Trends, Prospects and
Implications for Enterprises and Destinations», 19-21 October, Santorini, Greece
ACKNOWLEDGMENT
The authors would like to thank the editor and the anonymous reviewers for their constructive comments and suggestions which helped them to improve the quality of the paper
INTRODUCTION
May 2010 in repeated programs of memoranda since May 2010; all of which were funded by the European Union (European Bank, etc.) and the International Monetary Fund.
Economic growth in this increasingly competitive international market depends, to a significant extent, on a supportive regulatory environment, with taxation being the foundation component [31]. It becomes obvious that taxes are affecting tourism prices, even if it depends on whether businesses decide to absorb a tax increase in order to maintain its competitiveness or pass the extra tax imposition to consumers. The extent to which taxes affect tourism prices depends on the degree to which businesses in the sector choose to absorb this to maintain competitiveness or pass them through to consumers [31].
Table 1. WEF Tourism Competitiveness Index Rankings [30]
PricewaterhouseCoopers LLP (PwC) conducted a research aiming to understand how taxes are related to tourism sector across the EU and to measure their effects on the competitiveness of the tourism sector [31]. Among the study’s objectives were the estimation of the impact of tax policies on the tourist sector and the economy as a whole and to recommend an appropriate mix of taxation in order to reduce the impact on tourism business competitiveness.
Travel agents and tour operators are subject to the same tax regime as other businesses in Greece as well as in the economies of most EU countries. Literature precisely on “how tourism taxes affect travel agents and tour operators is limited” [31].
The present study aims to investigate how the travel agencies believe that they have been influenced by the changes that took place in taxation comparative to the travel offices of competitor countries and to determine the level of their competitiveness comparative to those of other countries.
From our initial investigation regarding the effect of taxation on travel agencies in Greece and in the competitors countries, we found that there are no other relevant studies neither in Greece nor internationally.
from academic point of view because it provides elements for an important branch of the tourism sector while the specific results of this study can constitute the basis for future study. The research subject may also be considered important from a practical/business point of view. Since travel agents are the intermediary in the sale of tourism products, their opinions should be taken seriously and be considered in the configuration of tax and tourist policy.
The results of this research may contribute to a statistical recording of data regarding travel offices in Greece, especially at the level of their competitiveness. It may also contribute to the imposition of a more rational tax policy for the travel offices that will increase their competitiveness. The contribution of this paper to the “limited research on tourism taxes impact on travel agents and tour operators” is definite and obvious.
THEORETICAL FRAMEWORK
The role of tax rates level and its impact on development and competition has been a research subject of many studies.
Countries with lower tax rates have higher rates of growth [16] while progressive income tax rates have a positive impact on an economy’s growth [24].
Economic development and competition are related negatively with the level of taxation. A significant negative correlation is found between corporate tax rate and income per capita growth rate [11]. The tax revenue from personal income has a negative correlation with economic development [29] and income taxes of companies have more negative effects on growth [1].
Reducing the tax burden on companies accelerates economic development [3]. The reduction of the marginal rate of income tax by 10% could lead to an increase in the GDP (15.2% in less developed countries and 7.4% in the developed [13], while the reduction of marginal tax rates by 5% could lead to growth of 0.2%-0.3% [8]. The business environment is enhanced by reducing the tax burden and tax incentives to investors, while also increasing the voluntary tax compliance [12].
Within the EU of 28 member-countries the tendency for increasing Personal Income Tax has an impact of higher taxes on the Corporate Income Tax (CIT).
Tax imposition affects the competitiveness of accommodation suppliers, travel agents and tour operators, because tourists are able to compare prices and quality of different tourists products and determined to select the alternative product with the lowest Value/Quality index. Tour operators (big travelling organisms) and the travel offices or travel agencies (travel agents) are the operational entities that can structure, organize and offer a complex product for the recreational and travel needs of tourists [15], [2].
The branch of travel offices constitutes a particularly important element of the Greek tourist product as well and has proven to be one of the most precious sources of capital for the growth of the national economy [19], [21].
The tax costs on the travel services provided by the travel agents should be incurred as a “cost to the final consumers with the same effect as if the final consumers had sourced the travel services directly from the suppliers” [31]. Therefore it could be undoubtable that the competitiveness of the travel agents as well as of tour operators is affected by the level of the tax rates both in the country of residence and in the country of tourism destination.
The study by Ernst & Young regarding the impact of a potential increase in the VAT rate on Greek hotels in 2013 revealed that a significant portion of the VAT increase would be passed through to retail prices gradually, two years after the change. Besides, the demand for tourism services would suffer a significant decline of few hundred million euros in the first year [9].
The “Travel Agents’ Margin Scheme (TAMS) for VAT is the most notable tax feature specific to travel agents and tour operators across the EU” [10]. It is a compulsory VAT accounting simplification mechanism for any supplier that deals with customers in their own name and uses supplies of goods or services provided by other taxable persons, in the provision of travel facilities [5].
A number of studies on taxation and its repercussions have been held with their results varying proportionally to the object and the subject of the repercussion under study.
Venter and de Clercq conducted research in 2006–2007 in the region of Gauteng regarding the effect of taxation in the small and intermediate enterprises of the sectors of industrial, retail trade and services, aiming to determine how much the size of the enterprise and the branch to which it belongs affects the way the enterprise manages its tax obligations. The results showed that the size of the enterprise and the branch to which it belongs influences which taxes will be faced by exterior collaborators. In general the tax subjects for the small and intermediate enterprises are not considered especially important and the enterprises prefer to have reductions in fines than in taxation [26].
In the study “The Economic Effects of Tourism in Spain,” Adam Blake (2000) uses the computable general equilibrium (CGE) model for the analysis of tourist policy and the effect of tax imposition on tourism in Spain to propose that it is preferable that the tax policy makers impose taxation that will only be burdensome to incoming tourists and not other tourists.
The suppression of VAT in the accommodations sector can increase the number of tourists but will not increase the government’s income. On the contrary, an increase in accommodation tax would be advantageous because, inter alia, it is imposed mostly on incoming tourism with low elasticity [4]
Vlachos et al (2011) conducted research in 2006 regarding the tax imposition on hotels in the island of Kos, Greece, using a sample of 21 hotels of 4 and 5 stars. They arrived at the result that the hotel owners of the island do not believe that the taxation of (income, VAT) significantly influences the operational outcomes of their enterprise. On the contrary they have a negative opinion about the municipal taxes that are imposed on the gross revenue of the hotel, regardless of whether the net result is a profit or a loss for the hotel.
The study “Tax Competitiveness of Croatia and Slovenia as Tourist Destinations” by Kosi and Bojnec [14], concluded that the loss of competitive prices because of the high tax imposition in conditions of intense competitiveness can lead potential visitors to other destinations with more accessible prices. They believe that the most competitive countries of the Mediterranean are Spain, Cyprus and Greece due to the lower VAT. Croatia applies higher factors of VAT and is less competitive than countries with lower VAT and correspondingly lower final prices of goods and services. Slovenia is rather competitive concerning the VAT factors but has the disadvantage of the income tax imposition because it applies high factors like Croatia.
Romer and Romer (2007), in their research for the macroeconomic effects of taxation changes in the USA, came to the conclusion that with an exogenic increase of tax by 1 % of GNP, the GDP will decrease by roughly 3 %. Also an exogenic increase of tax will cause the investments to decrease [20].
Baranová and Janíčková [3] in their research in the 27 countries of the European Union for the effect of corporate taxation on the economic growth arrived at the conclusion that for the old members of EU, the relationship between the tax weight of enterprises and the economic growth was negative, while for the new members they were not explicit and evident.
Avi-Yonah, Reuven S., & Lahav, Yaron [2] in their research on 200 multinational companies (the 100 largest in the USA and the 100 largest in Europe) aimed to determine the effective/real tax rate and to appreciate the competitiveness of American companies against those of Europe. The results showed that the European effective/real tax rate is higher (34 %) than the American (30 %) in the entire examined period.
DaRin et al. [6], in their research on newly created companies in 17 European countries, aim to reveal how the taxation of companies influences the size of those entering the market by country and by industry. Among the results was the fact that a reduction of the corporate income tax rate results in the market entry of companies with a smaller amount of equity.
Djankov, et al.’s [7] research regarding the effect of corporate tax on investments and on entrepreneurialism in 85 countries led to the result that the effective corporate tax rates have a considerably negative effect on investments and on entrepreneurialism. The higher “real” factors in income taxation are connected with lower investments in the industrial sector. Helhel et al. [12] conducted a study with a sample of 74 enterprises of the tourism sector (hotels, travel agencies, restaurants, food stores, etc.) of the country of Georgia. The results showed that the payment of taxes is an indication of devotion to the state, and the unwillingness of some people to pay their taxes it influences all taxpayers.
Tsangari [25] studied the determinants of tourism for Cyprus, and among other results it was revealed that relative prices between Cyprus and its main competitor, Greece, affected tourism expenditure in Cyprus. The effect on tourism expenditure in Greece could probably be similar, based on relevant research findings which illustrate that the impact on total spending from an increase in tax, in countries with a large share of coastal tourism, for example Greece, is expected to decrease tourism spending [10].
tourist sector” or a specific tourist sector,” etc. Among the specific tourist sector studies, those regarding the hotels have attracted the most interest.
Our research is considered original because of the primary data of the enterprises we retrieved from the questionnaires and also because it attempts to give a more complete picture for the competitive place of the travel offices comparative to the corresponding enterprises in competitors’ countries under the existing economic situations in Greece and worldwide.
Greece in the competitive environment
According to the World Economic Forum, for the period 2016–2017, Greece is rated 86th out of
138 countries (its previous classification was in the 81st place). Spain is found in the 32nd place
(previous classification in the 33rd place), Malta in the 40th place (previous place 48th ), Italy in
the 44th place (previous place 43rd ), Turkey in the 55th place (previous place 51st), Croatia in
the 74th place (previous place 77th ), and Cyprus in the 83rd place (previous place 65th).
Switzerland is ranked first, with Singapore second and the USA third, while last place (138th) is
Yemen. The following table presents Greece and its competitors’ countries; however, the data determining their competitive place comes from the classification in the last five-year period.
Table 2 The competitive place of Greece among its competitive countries the last decade [30]
Country 2012/2013 2013/2014 2014/2015 2015/2016 2016/2017
Greece 96 91 81 81 86
Cyprus 58 58 58 65 83
Croatia 81 75 77 77 74
Italy 42 49 49 43 44
Malta 47 41 47 48 40
Spain 36 35 35 33 32
Turkey 43 44 45 51 55
The total competitiveness of each country (concerning taxation) is based on the factors “taxation on investments,” the “tax factor on profits” and the “effect of taxation on employment.”
According to the “taxation on investments,” Greece is classified in 136th position; based on “tax
factor on profits,” it is classified in 109th place; and based on the “effect of taxation on
employment,” it is classified in 135th place.
In the following table, Greece and its competitive countries are presented based on the general competitiveness index and on each individual factor concerning competitiveness.
Table 3 The competitive place of Greece among its competitive countries for 2016/2017 [30]
Country
general competitiveness
index investments” “taxation on “tax factor on profits” “effect of taxation on employment”
Greece 86 136 109 135
Cyprus 83 20 23 27
Croatia 74 132 13 134
Italy 44 137 129 130
Malta 40 18 86 25
Spain 32 82 110 103
Turkey 55 73 83 67
For Greece, the political instability (17.6), tax rates (17.1), governmental ineffective bureaucracy (15.6), the access to financing (14), tax regulations (12.1), etc.
For Croatia, governmental ineffective bureaucracy (20.8), tax rates (15.3), the political instability (degree 14.2), tax regulations (11.7), etc.
For Cyprus, the access to financing (24.9), corruption (14.7), governmental ineffective bureaucracy (13.8), job market regulations (8.6), etc.
For Italy, tax rates (19.6), governmental ineffective bureaucracy (18.9), the access to financing (12.8), tax regulations (12.6), etc.
For Malta, insufficiently educated workforce (15.4), governmental ineffective bureaucracy (14.6), the access in financing (11.5), etc.
For Spain, tax rates (14.5), governmental ineffective bureaucracy (14), job market regulations (13.2), insufficient faculties for innovation (12.1), etc.
For Turkey, insufficiently educated workforce (12.3), the access to financing (10.6), governmental ineffective bureaucracy (10.5), political instability (9.9), etc.
Greece is found in the last place due to investment and operational taxes; this is in contrast to Cyprus, which is found in first place, followed by Croatia, Turkey, Spain and Italy.
METHODOLOGY
The methodological approach of the research includes two techniques: A) With extracting data that already exists in the literature.
B) With the collection and evaluation of data and elements via primary research, in the tourism sector.
The travel agencies of Athens correspond numerically roughly to one quarter of the travel agencies of Greece (1162 out of 4790); they do not necessarily function on the seasonal level, while roughly two-thirds of them operate as legal entities.
In order to address the purpose of the research, a questionnaire has been used among a random sample of tourism offices, from 20 January 2017 to 15 May 2017, resulting in 34 properly answered questionnaires. This refers to roughly 2.93 % of 1.162 tourism offices in metropolitan Athens and to 0.71 % of the 4790 travel offices of the country. The questionnaire includes 20 questions including those concerning the demographic data of the interviewee, economic data for the travel agency and the opinions of the owners or directors of the travel agencies regarding the research aim. Based on these questions, we created variables that express all of the factors related to the research questions.
The sample included 13 corporations, 12 limited-liability companies, 6 partnerships and 3 proprietorships enterprises. The analysis of the data was realized with computational SPSS 21 (Statistical Package for the Social Sciences) [17].
RESULTS OF THE RESEARCH
The age distribution of the sample is judged as relatively equable. Specifically, about 38.24 % of the participants belong to the age-group between 36–50, another 32.35 % declared themselves to belong to the ages of between 51 to 65 years and the remaining 29.41 % corresponds to respondents between 26 and 35 years of age.
The education level of the interviewee is judged to be relatively high because 58.82 % the respondents were graduates of universities or technological colleges, 20.59 % are holders of postgraduate degrees and the remaining 20.59 % have finished the basic study of high school. More than 3 out of 10 enterprises (30 %) exceeded the 30 years of activity. Additionally, 17.65 % of the sample enterprises have been activate in the tourism industry for a period of between 16 to 30 years. Another 23.53 % of the enterprises have been active for 11 to 15 years, and the remaining roughly 26 % have been in business up to 10 years.
Enterprises with gross sales above 10.000.001 euros consisted of only 5.88 % of the sample; 14.71 % had gross sales from 5.000.001 to 10.000.000 euros, 32.35 % had gross sales from 1.000.001 to 5.000.000 euros, 14.71 % enterprises had gross sales from 500.000 to 1.000.000 euros, 20.59 % from 100.001 to 500.000 euros and the remaining 11.76 % of the enterprises had gross sales under 100.000 euros.
In response to the question “which was the percentage change in the gross sales of enterprise from year to year, taking 2012 as the base year {eg 2013= -10% (or 90), 2014=+5 % (or 105), etc.}”, the answers of travel offices were either positive or negative. The median percentage change in the gross sales of the enterprise is presented in the following table:
Table 4 Mean Value and Standard Deviation of the percentage change in the gross sales of the enterprises, taking 2012 as the base year
the percentage change in the gross sales of enterprise, taking
2012 as the base year Valid Answers
Mean Value
Standard Deviation
2013 23 6.48 23.53
2014 24 6.64 30.47
2015 27 4.88 30.09
2016 22 0.56 35.58
A declining tendency of the percentage change in the gross sales of the travel agencies is observed in the table above.
The income of the travel agencies comes from 1) incoming tourism at approximately 26.50 %, 2) outgoing tourism at 21.00 %, 3) internal tourism at 12.75 %, 4) transfer services at 18.69 %, 5) cruises at about 1.06 %, 6) fees for air tickets sales at 9.44 %, 7) fees for coastal tickets sales at 4.70 %, 8) commissions for intermediary services as agents for tourist packages at 2.61 %, and 9) from other services at about 3.25 %.
Table 5 Mean Value and Standard Deviation of the revenue by activity
the income of your enterprise emanates from Answers Valid Value Mean Deviation Standard
Incoming tourism 32 26.50 35.45
Outgoing tourism 32 21.00 29.55
Internal tourism 32 12.75 17.79
Transfer 32 18.69 31.65
Cruising 32 1.06 2.85
The percentage of their sales regarding the outgoing tourist packages for the years 2015–2016, have decreased by about 6.17 % as compared to previous years (23 valid answers, 26.01 % standard deviation). The percentage of their sales regarding the domestic tourist packages for the years 2015–2016, have decreased by about 1.44 % as compared to the previous years(27 valid answers, 22.15 % standard deviation). This could mean either a further worsening of the economic situation of the Greek tourist consumer or that the tourists, exploiting the possibilities of technological development, organize their holidays themselves without the mediation of travel office.
The increase of the income taxation factor has influenced the enterprises, (on a scale of from -4 to +4), as stated in the answers in the following table:
Table 6 Mean Value and Standard Deviation of the effect value from the increase of the income taxation factor
The increase of the income taxation factor from 26% (in 2013, 2014), to 29% (the following years), for S.A., LTD, P.C., and from 25% (in 2012) to 29% (for 2014,2015, 2016) for Partnerships, how much affected the following:
Valid Answers
Mean Value
Standard Deviation
The profit margin from tourist packages sales 30 -1.87 1.50 The profit margin from tickets sales 28 -1.29 1.56 Gross sales of the enterprises 32 -1.78 1.60 Profitability in general 32 -2.19 1.64 The competitiveness of the enterprises 32 -2.13 1.50 The quality of the tourist packages 31 -0.32 0.87 The liquidity of the enterprises 33 -2.39 1.43
The answers for the effect of the VAT factor increase on the enterprises, (on a scale from -4 to +4), are stated in the following table:
Table 7 Mean Value and Standard Deviation of the of the effect value from the increase of V.A.T. factor
The V.A.T. factor increase from 23% in 2015 to 24% in 2016 has affected the following:
Valid Answers
Mean Value
Standard Deviation
The profit margin from tourist packages sales 32 -2.13 1.39
The profit margin from tickets sales 28 -1.61 1.52 Gross sales of the enterprises 32 -1.97 1.36 Profitability in general 32 -2.16 1.44 The competitiveness of the enterprises 33 -1.73 1.48 The quality of the tourist packages 32 -0.56 0.98 The liquidity of the enterprises 32 -2.19 1.40
factor (mean of effect in all them -1.70*), which is judged as statistically significant at the 1 % (pv < 0.01) level for income taxation and for each of the above individual economically values. The gross sales was influenced to a moderately negative degree because of the difference in the VAT factors that exists between Greece and the competitor countries (mean value: -1.89).
Regarding the question, does the difference in factors of VAT that exists between Greece and the competitor countries influences the gross sales of travel agencies?, the answers of the interviewees were expressed in form of an eleven-grade scale (from -5 until +5) and are displayed in the following table:
Table 8 Mean Value and Standard Deviation of the percentage of sales reduction because of the differences in the V.A.T. factors
Which of the competitive countries of Greece is taking part of your sales because of the difference in the VAT
factors
Valid
Answers Value Mean Deviation Standard
Italy 32 1.78 1.58
Croatia 32 1.28 1.85
Spain 32 2.13 1.77
Malta 32 1.38 1.76
Cyprus 32 2.44 1.89
Turkey 32 2.34 2.07
The difference in the income taxation factors in Greece and in the competitor countries influences the gross sales of the travel agencies in Greece. The interviewees expressed their opinion on a scale from -5 to +5. The gross sales was influenced to a moderately negative degree from the difference in the income taxation factors between the competitor countries concerning the gross sales of travel offices in the competitors countries (Mean value: -1.80). The travel agencies in Greece believe that they are losing part of their sales because of the difference in the taxation factors in the other countries as displayed in the following table (the marking scale used is 0 to 5):
Table 9 Mean value and standard deviation of the percentage of sales reduction because of the differences in the income tax factors (on a scale of 0 to 5)
Which of the competitive countries of Greece is taking part of your sales because of the difference
in the income tax factors
Valid Answers
Mean Value
Standard Deviation
Italy 32 1.41 1.70
Croatia 32 1.78 1.95
Spain 32 1.66 1.81
Malta 32 1.16 1.69
Cyprus 32 2.66 1.99
Turkey 32 2.34 2.09
Factor 3: The representatives of travel agencies have a negative opinion about the effect of diversity of the income taxation factors in competitors countries (Italy, Croatia, Spain, Malta, Cyprus, Turkey), the gross sales of their business in Greece, on average (- 1.80) *, which is judged as statistically significant at 1 % (pv < 0.01) * level (on a scale of evaluation from -5 to +5).
Table 10 Mean Value and Standard Deviation of the mean business competitiveness
Mean value of the competitiveness of travel agencies, by country, based on the income tax and VAT factors
Valid Answers
Mean Value
Standard Deviation
Greece 30 1.57 1.66
Italy 30 2.40 1.57
Croatia 30 2.60 1.43
Spain 30 2.87 1.59
Malta 30 1.93 1.29
Cyprus 30 3.23 1.36
Turkey 30 3.00 1.72
The interviewees consider that the level of competitiveness of the Greek travel agencies is low (Mean price: 1.57, on a scale of evaluation from -5 to +5). In Italy the level of competitiveness of travel agencies is considered a little below average (Mean price: 2.40), in Croatia it is a little higher than average (Mean price: 2.60), in Spain it is above average (Medium price: 2.87), in Malta the level of competitiveness is low (Mean price: 1.93), in Cyprus it is well above average (Mean price: 3.23) and in Turkey it is also above average (Mean price: 3.00).
Factor 4: The representatives of travel agencies have a negative attitude about the effect of diversity of the VAT factors applied in the competitors’ countries (Italy, Croatia, Spain, Malta, Cyprus, and Turkey) on the on the competitiveness of travel agencies in Greece, which is on average (- 2.67)* and is judged as statistically significant at 1 % (pv < 0.01)* (on scale of evaluation from -5 to +5).
Eight out of ten (80 %) interviewees believed that “with the existing economic situation, it is considered that the near future of their enterprise will be negative, and only 20 % are expecting a positive future. More than 70 % believe that in the long term, the situation of their enterprise will be positive, and roughly 25 % consider that in the long-term, the course of their enterprise will be negative.
More than eight out of ten (84.85 %) interviewees agree or absolutely agree with the opinion that the changes of last five years in the taxation decreased Greeks’ demand for tourist packages (excursions, etc.) with the remaining 12.12 % expressing a neutral opinion. Only 3.03 % of the interviewees disagree with the opinion that the taxation changes of last five years decreased Greeks’ demand for tourist packages. One-hundred percent of the sample believed that the existing tax system is “bad” or “very bad.” We conclude that all the travel agencies view the existing tax system in Greece in a negative light.
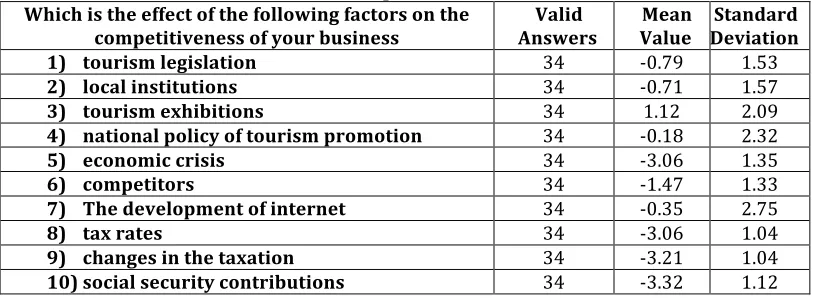
Table 11 Mean Value and Standard Deviation of the effect of each factor on business competitiveness
Which is the effect of the following factors on the
competitiveness of your business Answers Valid Value Mean Deviation Standard
1) tourism legislation 34 -0.79 1.53
2) local institutions 34 -0.71 1.57
3) tourism exhibitions 34 1.12 2.09
4) national policy of tourism promotion 34 -0.18 2.32
5) economic crisis 34 -3.06 1.35
6) competitors 34 -1.47 1.33
7) The development of internet 34 -0.35 2.75
8) tax rates 34 -3.06 1.04
9) changes in the taxation 34 -3.21 1.04
10)social security contributions 34 -3.32 1.12
• The effect of tourism legislation on the competitiveness of Greek tourism agencies is judged neutral or slightly negative (Medium price: -0.79).
• The effect of local institutions on the competitiveness is also judged to be neutral or slightly negative (Medium price: -0.71).
• The effect of tourist exhibitions on the competitiveness is judged to be neutral or slightly positive (Medium price: 1.12).
• The effect of national policy on tourism promotion is judged to be neutral or slightly negative (Medium price: -0.18).
• The effect of the economic crisis on the competitiveness of the Greek travel agencies is judged to be strongly negative (Medium price: -3.06).
• The effect of the agencies from competitive countries is slightly negative (Medium price: -1.47).
• The effect of the Internet development is neutral to slightly negative (Medium price: -0.35). • The effect of the height of tax rates is strongly negative (Medium price: -3.06), as is the
effect of changes to taxation (Medium price: -3.21).
• The effect of social security contributions is also perceived to have a strongly negative impact on the competitiveness of Greek travel agencies(Medium price: -3.32).
Factor 5: The travel agencies have a negative attitude towards the effect of the taxation on their competitiveness, (on average - 3.12), which is judged as statistically significant at the 1 % (pv < 0.01) level.
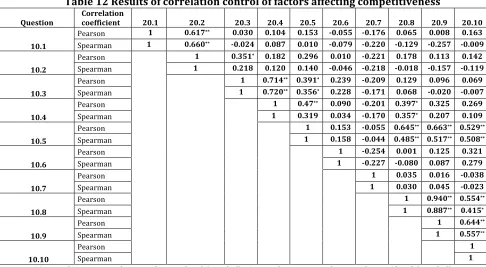
Table 12 Results of correlation control of factors affecting competitiveness
Question Correlation coefficient 20.1 20.2 20.3 20.4 20.5 20.6 20.7 20.8 20.9 20.10
10.1
Pearson 1 0.617** 0.030 0.104 0.153 -0.055 -0.176 0.065 0.008 0.163
Spearman 1 0.660** -0.024 0.087 0.010 -0.079 -0.220 -0.129 -0.257 -0.009
10.2
Pearson 1 0.351* 0.182 0.296 0.010 -0.221 0.178 0.113 0.142
Spearman 1 0.218 0.120 0.140 -0.046 -0.218 -0.018 -0.157 -0.119
10.3
Pearson 1 0.714** 0.391* 0.239 -0.209 0.129 0.096 0.069
Spearman 1 0.720** 0.356* 0.228 -0.171 0.068 -0.020 -0.007
10.4
Pearson 1 0.47** 0.090 -0.201 0.397* 0.325 0.269
Spearman 1 0.319 0.034 -0.170 0.357* 0.207 0.109
10.5
Pearson 1 0.153 -0.055 0.645** 0.663** 0.529**
Spearman 1 0.158 -0.044 0.485** 0.517** 0.508**
10.6
Pearson 1 -0.254 0.001 0.125 0.321
Spearman 1 -0.227 -0.080 0.087 0.279
10.7
Pearson 1 0.035 0.016 -0.038
Spearman 1 0.030 0.045 -0.023
10.8
Pearson 1 0.940** 0.554**
Spearman 1 0.887** 0.415*
10.9
Pearson 1 0.644**
Spearman 1 0.557**
10.10
Pearson 1
Spearman 1
**. Correlation is significant at the 0.01 level (2-tailed) - *. Correlation is significant at the 0.05 level (2-tailed)
1. The variable “Tourist Legislation” presents:
• High, positive statistically significant correlation within the variable “Local Institutions” (r = 0.660, pv < 0.01).
• Positive, though statistically insignificant correlation within the variables “National policy of tourism promotion” (r = 0.087) and “Economic crisis” (r = 0.010).
• Negative, low-to-moderate statistically insignificant correlation within the variables “Tourist exhibitions” (r = -0.024), “competitors” (r = -0.079), “development of internet” (r = -0.220), “tax rates” (r = -0.129), “changes in taxation” (r = -0.257) and “social security contributions” (r = -0.009).
2. The variable “Local Institutions” presents:
• Positive, low-to-moderate statistically insignificant correlation within the variables “Tourist exhibitions” (r = 0.218), (r = 0.120) and “Economic crisis” (r = 0.140).
• Negative, low-to-moderate statistically insignificant correlation with the variables “competitors” (r = 0.046), “development of internet” (r = 0.218), “tax rates” (r = 0.018), “changes in taxation” (r = 0.157) and “social security contributions” (r = -0.119).
3. The variable “Tourist exhibitions” presents:
• Positive, high statistically significant correlation within the variables “National policy of tourism promotion” (r = 0.720, pv < 0.01) and “Economic crisis” (r = 0.356, pv < 0.05). • Positive, low-to-moderate statistically insignificant correlation within the variables “tax
rates” (r = 0.068) and “competitors” (r = 0.228).
4. The variable “National policy of tourism promotion” presents:
• Positive, high statistically significant correlation within the variables “Economic crisis” (r = 0.319, pv < 0.05) and “tax rates” (r = 0.357, pv < 0.05).
• Positive, low-to-moderate statistically insignificant correlation within the variables “competitors” (r = 0.034), “changes in taxation” (r = 0.207) and “social security contributions” (r = 0.109).
• Negative, low-to-moderate statistically insignificant correlation with the variable “development of internet” (r = -0.170).
5. The variable “Economic crisis” presents:
• Positive, high statistically significant correlation within the variables “tax rates” (r = 0.485, pv < 0.01), “changes in taxation” (r = 0.517, pv < 0.01) and “social security contributions” (r = 0.508, pv < 0.01).
• Positive, statistically insignificant low-to-moderate correlation within the variable “competitors” (r = -0.158).
• Negative, low-to-moderate statistically insignificant correlation with the variable “development of internet” (r = -0.044).
6. The variable “competitors” presents:
• Positive, low-to-moderate statistically insignificant correlation within the variables “changes in taxation” (r = 0.087) and “social security contributions” (r = 0.279).
• Negative, low-to-moderate statistically insignificant correlation with the variables “development of internet” (r = -0.227) and “tax rates” (r = -0.080).
7. The variable “development of internet” presents:
• Positive, low-to-moderate statistically significant correlation within the variables “tax rates” (r = 0.030) and “changes in taxation” (r = 0.045).
• Negative, low statistically insignificant correlation within the variable “social security contributions” (r = -0.023).
8. The variable “tax rates” presents:
• Positive, powerful and statistically significant cross-correlation, within the variables “changes in taxation” (r = 0.887, pv < 0.01) and “social security contributions” (r = 0.415, pv < 0.05).
(Moreover, as more we report, this variable manifests powerful, positive statistically significant cross-correlation within the variables “National policy of tourism promotion” and “Economic crisis.”)
9. The variable “changes in taxation” presents:
• Positive, high statistically significant correlation, with the variable “social security contributions” (r = 0.557).
(Moreover, as we reported earlier, there exists within this variables positive, high, statistically significant correlation with the variable “Economic crisis.”)
Results of the cross check of “equality of means” for the medium-assessed level of competitiveness of travel offices by country
the durable controls Welch and Brown-Forsythe. This means that the level of competitiveness of travel agencies is influenced by the country.
Table 13 Results of control of equality of means for the medium estimated level of competitiveness of travel offices as for the diversity of country
Variable Country
Mean Value (standard deviation)
Test of homoscedasticity (Levene Statistic)
(p-value)
Statistical value F (ANOVA)
Level of statistical significance
(p-value)
medium estimated level of competitiveness of
travel offices
Greece 1.57 (1.68)
0.363>0.10 4.582 pv<0.01
Italy 2.40 (1.57) Croatia 2.60 (1.43) Spain 2.87 (1.59) Malta 1.93 (1.28) Cyprus 3.23 (1.36) Turkey 3.00 (1.72)
The medium estimated level of competition of Greece is lower than all other remaining countries (1.57). Greece’s competitiveness level has a considerably lower mean price than all the countries with which it is compared (aside from Malta (1.93)), by at least 5 % (pv < 0.01). Consequently, the corresponding result can be generalized in the corresponding population. That is to say, the medium-estimated level of Greece’s competition is lower than that of all the remaining countries and does not differ from the medium estimated level of competition of Malta. This result is confirmed by the table of multiple comparisons (LSD-Post Hoc Tests— multiple Comparisons).
CONCLUSIONS AND PROPOSALS
The travel agencies, an integral part of the tourist product, appear to follow developmental progression up to a point at least. The increasing tax imposition however influences the price of the tourist product and has an effect on the competitiveness of tourist enterprises. The results of our research showed that the gross sales of travel agencies has increased in 2013 and 2014 at roughly 6.5 % per year, 4.88 % in 2015 and only 0.56% in 2016. The representatives of travel agencies believe that because of the tax imposition they have lost an effectual part of their sales as well decreased in other financial avenues, such as the profitability, profit margin, and liquidity. The representatives of travel offices believe that they have also suffered losses in their gross sales from the competitive countries because of the differences in the income and VAT factors of taxation. They consider the largest losses to be from Turkey and Cyprus. The small negative effect (- 0.32 because of the differences in the income and -0.56 because of the differences of VAT taxation) also exists in the quality of tourist packages.
The travel agents believe that their gross sales of tourist packages have fallen in 2015–2016, for domestic tourism by - 1.44 and - 6.17 for the outgoing. In addition to other reasons, this could mean that the economic situation of the Greek consumer/ tourists has been worsened.
Nevertheless, the travel agents believe that (statistically significant) negative effects on the competitiveness of their enterprises have the variables a) changes in taxation, b) tax rates, c) economic crisis, and d) “social security contributions.”
The effort of the present work was to determine, based on the opinions of the travel agencies’ representatives, the repercussions of the new tax policy on the competitiveness of Greek travel agencies and of the tourist products they sale.
Among the limitations of this work, however, is the limited focus of the research, which only examines Greek travel agencies (travel agencies of competitive countries were not surveyed). Additionally, while the subject of tax policy was investigated, the primary focus was on income tax, VAT and their consequences; other “secondary” taxations, fines, etc. were ignored. The timeframe of the research was limited, and therefore other parameters that influence the competitiveness of travel offices was also limited (or if they were considered, they were only cursorily examined).
Another limitation is that the answers of the questionnaire were not weighted with parameters such as “size of enterprise” or “gross sales.”
The subject of competitiveness (of a travel agency, destination or enterprise) is not only related to the tax policy but also is influenced by other parameters, such as safety, proximity to markets, economic situation in the countries of origin of tourists, economic situation of the host country, capabilities of competitors, infrastructures, education levels of the enterprises’ personnel, modernization the product and costs of enterprises.
The above variables, either individually or in combination, may be the subject of a future study regarding their effect on the competitiveness. Additionally, the interactions between the above-mentioned variables with taxation and their effect on the economic values and the competitiveness of tourist enterprises will always constitute interesting an research subject.
Tax burdens affect tourist activity and negatively affect the competitiveness of the tourist product, of the tourist enterprises and therefore of the travel agencies.
These effects ought to be taken into account by the government and tax policy makers.
References
Arnold, J., 2008. Do Tax Structure Affect Aggregate Economic Growth? Empirical Evidence from a Panel of OECD Countries, s.l.: Economics Department Working Papers, No. 643, ECO/WKP(2008)
51. doi:10.1787/236001777843
Avi-Yonah, Reuven S., & Lahav, Yaron. (2011). The Effective Tax Rate of the Largest US and EU Multinationals. Law & Economics Working Papers. Paper 41 in
http://repository.law.umich.edu/cgi/viewcontent.cgi?article=1150&context=law_econ_current /accessed 20 July 2017.
Baranová Veronika & Janíčková Lenka. (2012). Taxation of Corporations and Their Impact on Economic Growth: The Case of EU Countries, Journal of Competitiveness, 4, (4), 96-108. DOI: 10.7441/joc.2012.04.07
Blake Adam (2000) The economic effects of tourism in Spain,
http://scholar.google.gr/scholar?hl=el&q=THE+ECONOMIC+EFFECTS+OF+TOURISM+IN+SPAIN&btnG / accessed 18 July 2017.
Council of the European Union, (2006), COUNCIL DIRECTIVE 2006/112/EC of 28 November 2006 on the common system of value added tax, available from:
Da Rin, Marco and Di Giacomo, Marina and Sembenelli, Alessandro, Corporate Taxation and the Size of New Firms: Evidence from Europe (September 15, 2009). TILEC Discussion Paper No. 2009-036. Available at
SSRN: https://ssrn.com/abstract=1474197 or http://dx.doi.org/10.2139/ssrn.1474197
Djankov Simeon, Ganser Tim, McLiesh Caralee, Ramalho Rita, and Chleifer Andrei (2010) The Effect of Corporate Taxes on Investment and Entrepreneurship, DASH, Harvard University.
https://dash.harvard.edu/bitstream/handle/1/8705900/AEJMacro.pdf?sequence=1 (accessed 20/7/2017) Engen, E. M. & Skinner, J., 1996. Taxation and Economic Growth, Cambridge: National Bureau of Economic Research Working Paper 5826.
Ernst & Young, (2015), "VAT increase in the Greek hotel industry: Economic impact assessment", available from: http://www.insete.gr/portals/_default/Skins/Insete/meletes/VAT_rise_Economic_Impact_Assessme
nt_Executive_summary-EY.pdf [April 2018]
European Commission, (2017), “Special Schemes”, available from:
http://ec.europa.eu/taxation_customs/business/vat/eu-vat-rules-topic/special-schemes_en [April 2018] Gordon, R. H. & Lee, Y., 2005. Tax Structure and Economic Growth. Journal of Public Economcis, Τόμος 89, pp. 1027-1043.
Helhel, Y. & Varshalomidze, M., 2015. Determinants Of Tax Attitude And Tax Compliance Among Small And Medium Enterprises (SMEs) In Tourism Industry: A Survey Study In Georgia. Archives of Business Research, 3(5), pp. 14-23.
Koester, R. B. & Kormendi, R. C., 1989. Taxation, Aggregate Activity and Economic Growth: Cross-Country Evidence on Some Supply-Side Hypotheses. Economic Inquiry, 27(3), pp. 367-386.
Kosi T., & Bojnec S. (2010). Tax Competitiveness of Croatia and Slovenia as Tourist Destinations, Academica Turistica, Year 3, No. 1–2, 38-52
Koutoulas D, Tsartas P, Papatheodorou A, & Prountzou E (2009). Understanding the tour operators’ point of view for effectively marketing a tourist destination: The case of Athens - Tourism Today, 9, 65-77
Marsden, K., 1983. Links between taxes and economic growth: some empirical evidence, s.l.: World Bank Staff Working Papers no. 605 .
Noba-Kaltsouni X. (2006). Methodology of empirical research in Social Sciences. Analysis of Data with the use of SPSS 13. Athens: Gutemberg. (in Greek)
Papageorgiou A. (2007). Organization and Operation of tourist agencies, Travel planning, Composition of tourist packages. Athens: INTERBOOKS Editions (in Greek)
Papatheodorou Andreas. (2001). Why people travel to different places. Annals of Tourism Research, 28, (1), 164-179,
Romer Christina D. & Romer David H. (2017). The Macroeconomic Effects of Tax Changes: Estimates Based on a New Measure of Fiscal Shocks, National Bureau of Economic Research, Working Paper 13264 JEL No.
E32,E62,H30,N12 in https://core.ac.uk/download/pdf/6716271.pdf / accessed 22 July 2017
Sarantakou E , and Tsartas P. (2015). A critical approach to the new framework for creating tourism investment during the current period of economic crisis 2010-2014. Special Issues of Financial Developments, 26, 46-56 (ISSN:1109-6284) http://www.kepe.gr/images/oikonomikes_ekselikseis/oik_exel_26_eng.pdf
Sigala, M. (2008). A supply chain management approach for investigating the role of tour operators on sustainable tourism: the case of TUI. Journal of Cleaner Production, 16, 1589–1599
Spearman, C. (2009). The proof and measurement of association between two things. American Journal of Psychology, 15 (1904), 72–101
Tanchev, S., 2016. The role of the proportional income tax on economic growth of Bulgaria. Ikonomicheski Izsledvania, 25(4), pp. 66-77.
Tsangari,H. (2012), Determinants of Tourism for “Sun and Sea” Cyprus, available from: http://www.ersj.eu/repec/ers/papers/12_3_p9.pdf [January 2018]
Vitouladiti U. (2015). The enrichment of tour operators’ product by incorporating sustainable elements. a tourism and travel marketing approach. TOURISMOS: An International Multidisciplinary Journal of Tourism. 10, (1), 131-147
Vlachos T., Diakomihalis M. & Lagos D. (2011). Taxation and Competitiveness in the Hotel Branch: the case of 4 and 5 star hotels of Kos island, Journal of Management Sciences and Regional Development, 7, 123-140 / accesses 18 July 2017
Widmalm, F., 2001. Tax Structure and Growth: Are Some Taxes Better than Others?. Public Choice, Τόμος 107, pp. 199-219.
World Economic Forum ranking, (2017), available from:http://reports.weforum.org/travel-and-tourism-competitiveness-report-2017/ranking/#series=TTGOVEXP [April 2018]
![Table 1. WEF Tourism Competitiveness Index Rankings [30]](https://thumb-us.123doks.com/thumbv2/123dok_us/8592885.1721624/2.595.189.428.226.466/table-wef-tourism-competitiveness-index-rankings.webp)
![Table 2 The competitive place of Greece among its competitive countries the last decade [30]](https://thumb-us.123doks.com/thumbv2/123dok_us/8592885.1721624/6.595.78.535.590.731/table-competitive-place-greece-competitive-countries-decade.webp)