http://www.sciencepublishinggroup.com/j/ijaas doi: 10.11648/j.ijaas.20170301.13
ISSN: 2469-7877 (Print); ISSN: 2469-7885 (Online)
Screening of Rice (Oryza sativa L.) Genotypes for Salinity
Tolerance in Ethiopia
Dawit Asnake
1, *, Hussien Mohammed
21
Wheat Breeding and Genetics, Kulumsa Agricultural Research Center, Assela, Ethiopia
2
Department of Plant and Horticultural Sciences, Hawassa University, Hawassa, Ethiopia
Email address:
apari199@yahoo.com (D. Asnake), aamina68@yahoo.com (H. Mohammed)
*
Corresponding author
To cite this article:
Dawit Asnake, Hussien Mohammed. Screening of Rice (Oryza sativa L.) Genotypes for Salinity Tolerance in Ethiopia. International Journal of Applied Agricultural Sciences. Vol. 3, No. 1, 2017, pp. 25-31. doi: 10.11648/j.ijaas.20170301.13
Received: December 27, 2016; Accepted: January 9, 2017; Published: March 6, 2017
Abstract:
This study was carried out to investigate the effect of 4 different salinity levels (0, 4, 8 and 12 dSm-1) on yield of 13 rice genotypes along with a salt-tolerant and susceptible check genotypes to identify salt tolerant rice genotype to be used under irrigation. A factorial combination of the fifteen genotypes and four salinity levels was laid out in completely randomized design (CRD) in two replications in a mesh house. The experiments were conducted at Werer Agricultural research Center, eastern Ethiopia, from December, 2008 to May, 2009. Since all plants of all genotypes died under salinity level of 12 dSm-1, grain yield data obtained from three salinity levels are included in the analysis. Statistical Analysis of Variance (ANOVA) revealed highly significant difference among the test genotypes in all traits studied, witnessing the availability of ample genetic variability which can be used in breeding rice for tolerance to salinity. Salinity levels affected all measured traits. The Genotype x Salinity interaction was also significant for all traits except for Plant Height during Heading, Panicle Length, Number of Panicle, Number of Grains per panicle and Number of Tillers per plant, indicating the inconsistency of the performance of genotypes by many of the traits over the salinity levels and the need for selection of rice genotypes specifically adapted to a particular salinity level. In the pot experiment an increase in salinity from 0 to 4 and to 8 dSm-1 consistently reduced growth parameters, biomass, grain yield and its components, but delayed phenology. Genotypes IR66946-3R-176-1-1 (G15) and IR68144-2B-2-2-3-2 (G8) were tolerant to salinity both during early growth and later during vegetative growth, and seed setting. IR59418-7B-21-3 (G1), IR59418-7B-27-3 (G2) and IR72593-B-18-2-2-2 (G13) were found to be salt tolerant during vegetative growth and seed setting. These five genotypes can therefore be recommended for further testing under salt stress. Higher grain yield and its components under salt stress and smaller reduction of these parameters under salt stress as compared with values under normal growth condition should be used as selection criteria to develop salt tolerant rice genotypes. AMMI biplot analysis enabled clear discrimination of genotypes response against root zone salinity stress.Keywords:
Salinity, Tolerance, Rice, Genotype1. Introduction
Irrigated land is only 15% of total cultivated land, but as irrigated land has at least twice the productivity of rainfed land, it may produce one-third of the world’s food [20]. Irrigated agriculture, however, is accompanied with the problem of salinity. Soil salinity has become a major factor limiting crop productivity worldwide, especially in arid and semiarid regions. In general, salt affected soils have very low productivity because of dominance of the soluble salts
should be directed towards improving the level of management of soils already under cultivation, and by bringing new areas of the dry land ecosystems, under cultivation. Therefore, solutions that include agronomic and breeding approaches for efficient utilization of such soils have to be devised.
Rice became a potential cereal crop which can be used for food and feed in the arid and semi-arid environments. Under lowland irrigated conditions, it can give 6-8 tons per hectare. The recent surge in demand for rice combined with the sky rocketing import price challenged the country’s policy makers to seriously consider the country’s potential to grow the grain for itself. Subsequently, successful lobbying has pushed rice to be named as “a millennium crop”. This favors rice research and promotion on a large scale. Moreover, some research activities on developing well-adapted and high yielding rice genotypes for lowland irrigated areas are currently under way.
Breeding crops for salt tolerance would be likely to provide economic and efficient methods of overcoming problems of saline soils. Such a crop improvement and selection program must be based on adequate variability for salinity tolerance and such variation has been observed within species. Rice is sensitive to salinity like other cereal crops, this limiting its production under salinity prone areas; however, cultivar differences were observed for salt tolerance in rice. Rice breeders have used such genetic variability to produce high yielding and salt tolerant cultivars. Screening efforts are also being made in different parts of the world exploiting this diverse genetic potential to identify rice genotypes tolerant to salinity [21, 8, 16]. However, in Ethiopia little has been done to identify rice genotypes adaptable to adverse soil conditions such as salinity and to investigate morphological characters associated with grain yield under salt stress. This study, was therefore, conducted
to identify rice genotypes with sufficient tolerance and adaptation to salinity; and to assess the nature and magnitude of the existing genotype X salinity interaction under irrigated condition.
2. Material and Methods
2.1. Field Experimental Set-Up
The study was carried out during 2008 growing season at Werer Agricultural Research Center (WARC), which is 280 km North East of Addis Ababa. It is located at 9° 60’ N latitude and 40° 9’ E longitude and at an altitude of 740 meter above sea level. Light textured alluvial soil with a pH 7.1 to 8.4 is the soil type of the centre [25]. The soil organic matter varies from 0.46 to 2.08% in the surface soil (0-30 cm). The mean annual temperature is 34°C while the mean annual rainfall and evapo-transpiration are, 560 mm and 2600 mm, respectively. The weather is very hot and dry and rainfall is very erratic [25].
Fifteen rice genotypes, which were developed by International Rice Research Institute (IRRI) particularly for salt tolerance, were assessed at four levels of salinity (0, 4, 8 and 12 dSm-1). The rice genotypes used in the study are given in Table 1. Soil collection and preparation: For this pot experiment, soils were collected from Werer Agricultural Research center. The soils were air dried for 10 days followed by crushing, mixed thoroughly and sieved through a 2mm sieve. The pH value, cation exchange capacity (CEC) and electrical conductivity (EC) of the soil were 7.4, 14.78 meq/100g soil and 1.02 dSm-1, respectively. The amount of NaCl which were applied corresponding to the four salinity levels was calculated and these values were: 12.8, 25.6 and 38.4 g NaCl per 5 kg soil, corresponding 4, 8 and 12 dSm-1.
Table 1. Test entries for the screening experiment with code, designation, pedigree, origin and their features.
Code Designation Pedigree Origin Feature
G1 IR59418-7B-21-3 IR10198-66-2/IR32429-47-3-2-2/AT401 IRRI Early maturing
G2 IR59418-7B-27-3 IR10198-66-2/IR32429-47-3-2-2/AT 69-5 IRRI Early maturing
G3 IR61247-3B-8-2-1 BG367-4/AT69-5 IRRI Early maturing
G4 TCCP266-1-3B-10-2-1 - IRRI Early maturing
G5 IR68652-3B-22-3 IR20/POKKALI B IRRI Early maturing
G6 IR69588-4R-P-3-3 IR 26//IR 20/POLKALI B IRRI Early maturing
G7 IR70870-B-P-2-2 POKKALI B/IR20/IR 26 IRRI Early maturing
G8 IR68144-2B-2-2-3-2 IR 72/ZAWA BONDAY IRRI Early maturing
G9 IR68144-2B-2-2-3-3 IR 72/ZAWA BONDAY IRRI Early maturing
G10 IR72593-B-13-1-3-1 IR65195-3B-13-2-3//IR 20/IR 24 IRRI Early maturing
G11 IR72593-B-13-3-2-1 IR65195-3B-13-2-3//IR 20/IR 24 IRRI Early maturing
G12 IR72593-B-13-3-3-1 IR65195-3B-13-2-3//IR 20/IR 24 IRRI Early maturing
G13 IR72593-B-18-2-2-2 IR65195-3B-13-2-3//IR 20/IR 24 IRRI Early maturing
G14 IR29 IR 833-6-2-1-1//IR 1561-149-1//IR24 *4 / O. NIVARA IRRI Early maturing
G15 IR66946-3R-176-1-1 IR29/POKKALI B IRRI Early maturing
NB: G14 and G15 standard susceptible and tolerant genotypes, respectively
The experiment was conducted by raising plants in plastic pots of 25.4 cm top diameter, 14.6 cm bottom diameter and 21.6 cm depth filled with 5 kg sundried soil. Each pot was planted with ten seeds of each genotype. The pots were lined
Salt solution seepage was collected every 24 hours from each pot and returned to the pots to avoid seepage loss of salts. Weeds grown in the pots were removed by hands. Watering was done, as often as necessary, in each pot to hold the soil water level optimum.
2.2. Data Collection and Analysis
For this particular study, grain yield dataset were subjected to analysis of variance (ANOVA) for two factor completely randomized design using the General Linear Model (GLM) procedure of the SAS statistical analysis system [22]. Stability analysis was performed using SAS to calculate stability parameters like Wricke’s ecovalence (W), MUIRSTAB, heterogeneity of variances (HETERO), Lack of correlation (LACK-CORR) and variances of ranks, Si(2). Moreover, global chi-square test was employed to check whether variances of the ranks, Si(2), are significant or not. Based on grain yield data where each salinity level was considered as environment, GxE interaction was analyzed using additive main effects and multiplicative interaction (AMMI) biplot analysis to assess similarity and dissimilarity among three salinity levels and interaction patterns between
genotypes and salinity levels.
3. Results and Discussion
Analysis of variance revealed that grain yield plant-1 of 15 tested rice genotypes differed significantly (p ≤ 0.01, Table 2). Genotypes IR66946-3R-176-1-1 (G15), IR72593-B-18-2-2-2 (G13), IR59418-7B-21-3 (G1), IR59418-7B-27-3 (G2), and IR68144-2B-2-2-3-2 (G8) were genotypes with the highest mean grain yield per plant of 4.37 g, 3.67 g, 3.66g, 3.38g, and 2.92 g, respectively, across the three root zone salt concentrations. Average reduction in grain yield plant-1 over the two salinity levels (4 and 8 dSm-1) as compared to the control of these genotypes ranged between 36 for IR59418-7B-27-3 (V2) to 56% for IR72593-B-18-2-2-2 (V13) while for susceptible genotype, IR29 (G14) and IR72593-B-13-3-3-1 (GIR72593-B-13-3-3-12) this reduction was 74 and 70%, respectively. These genotypes with lowest reduction are all found to be promising genotypes for salt tolerance and over all adaptation. Genotype with the lowest mean grain yield per plant was genotype IR68652-3B-22-3 (G5) with mean grain yield plant-1 of 2.10 g.
Table 2. Mean squares from analysis of variance of 15 genotypes grown in control and two NaCl salinity levels for germination study.
Parameters Genotype (df=14) Salinity (df=2) G*S (df=28) Error (df=45) CV (%)
Number of panicle 76.987*** 707.24*** 16.84ns 10.49 25.00
Number of grains panicle-1 151.14*** 3321.03*** 29.23ns 20.92 13.23
Number of spikelet panicle-1 6.83*** 270.76*** 1.995** 0.946 6.51
100-grain weight 0.3346*** 4.313*** 0.241*** 0.0141 6.645
Grain yield per plant 2.67*** 65.73*** 0.47* 0.253 18.26
Spikelet fertility 403.38*** 224.4* 155.79*** 58.48 15.92
Where; ns = non-significant *, ** and *** significant at 5%, 1% and 0.01probability level, respectively
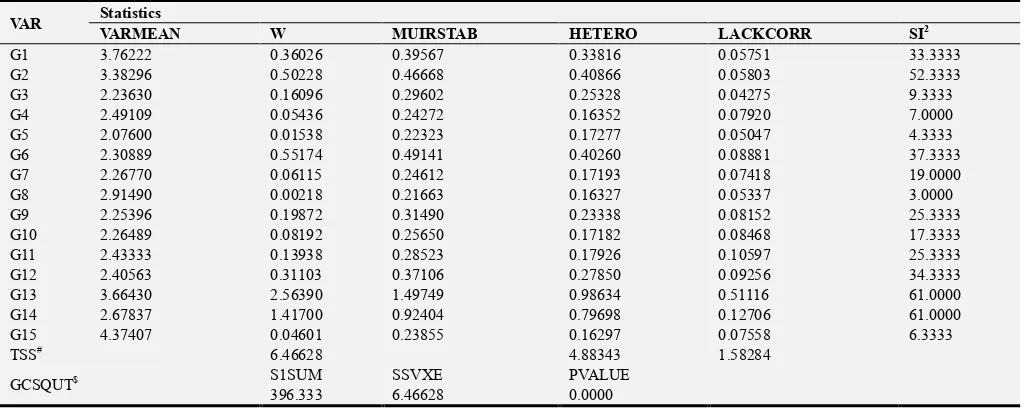
Table 3. Contribution of each genotype to rank change and heterogeneity of variances in grain yield (GYPP).
VAR Statistics
VARMEAN W MUIRSTAB HETERO LACKCORR SI2
G1 3.76222 0.36026 0.39567 0.33816 0.05751 33.3333
G2 3.38296 0.50228 0.46668 0.40866 0.05803 52.3333
G3 2.23630 0.16096 0.29602 0.25328 0.04275 9.3333
G4 2.49109 0.05436 0.24272 0.16352 0.07920 7.0000
G5 2.07600 0.01538 0.22323 0.17277 0.05047 4.3333
G6 2.30889 0.55174 0.49141 0.40260 0.08881 37.3333
G7 2.26770 0.06115 0.24612 0.17193 0.07418 19.0000
G8 2.91490 0.00218 0.21663 0.16327 0.05337 3.0000
G9 2.25396 0.19872 0.31490 0.23338 0.08152 25.3333
G10 2.26489 0.08192 0.25650 0.17182 0.08468 17.3333
G11 2.43333 0.13938 0.28523 0.17926 0.10597 25.3333
G12 2.40563 0.31103 0.37106 0.27850 0.09256 34.3333
G13 3.66430 2.56390 1.49749 0.98634 0.51116 61.0000
G14 2.67837 1.41700 0.92404 0.79698 0.12706 61.0000
G15 4.37407 0.04601 0.23855 0.16297 0.07558 6.3333
TSS# 6.46628 4.88343 1.58284
GCSQUT$ S1SUM SSVXE PVALUE
396.333 6.46628 0.0000
# Total sums of squares due to heterogeneity among variances and imperfect correlation $ Global chi-square test for difference between genotypes in stability
Moreover, grain yield per plant was decreased significantly (p ≤ 0.01) due to the effect of increased levels of salinity (Table 2). The mean grain yield ranged from 1.45 g to 4.35 g. The maximum value (4.35 g) of grain yield plant-1
0.0001). An increase in salt concentration from the control to 4 dSm-1 significantly decreased grain yield plant-1 by 44.4%. A further increase of salt concentration to 8 dSm-1 reduced grain yield plant-1 by 66.7%. The reduction in grain yield plant-1 of 22.3% between salt concentrations of 4 and 8 dSm-1 was also statistically significant. Between salinity levels of the control and 8 dSm-1, grain yield plant-1 was reduced more than 3-fold (by 66.7%). Regression of the mean grain yield plant-1 on the salinity levels shows that each 1 dSm-1 increase in salt concentration will reduce grain yield per plant by 0.36 g in salinity range between the control and 8 dSm-1.
The existence of significant (p ≤ 0.05) Genotype x Salinity interaction effect on grain yield plant-1 was also confirmed from ANOVA (Table 2). This revealed differential reaction of genotypes to stress at different salinity levels. Further analyses were made partitioning the significant GxS component in to variance heterogeneity and lack of correlation. Extended analysis of results showed that the Genotype x Salinity interaction due to rank change (LACKCORR) and due to change of scale (HETERO) are not equal, witnessing the fact that contribution of variance heterogeneity of genotypes is much more than the inconsistent ranks of the genotypes (Table 3). For instance, using Wricke’s ecovalence (W), genotypes IR59418-7B-21-3 (G1), IR59418-7B-27-3 (G2), IR72593-B-13-3-3-1 (G12),
IR29 (G14), IR69588-4R-P-3-3 (G6) and IR72593-B-18-2-2-2 (G13) had the highest contribution to the Genotype x Salinity interaction. Most of these genotypes also had the highest lack of correlation, which is the manifestation of the frequent rank changes. The global chi-square test on consistency of ranks is significant, indicating that the ranks of the 15 rice genotypes are inconsistent, the genotypes perform differently under different salinity levels; this is the cause of the significant Genotype x Salinity levels interaction.
Various studies at different times on different species pointed out that this deduction could be associated with its adverse effect on yield related attributes. For instance, yield related traits such as panicle length, number of spikelet’s per panicle, number of grains per panicle, and 100-grains weight showed a reduction with increase in root zone salinization but the effect varied in different rice genotypes. It was noted that terminal spikelet’s appeared earlier under salt stress. Salinity stress tended to shorten the duration of spikelet differentiation, resulting in fewer spikelets per panicle [19, 14, 10]. These authors also concluded that salinity significantly decreased the number of spikelet primordia on the main spike. The florets in the basal spikelets appear to be significantly less viable than those in the apical spikelet’s under saline conditions [13].
Figure 2. GxE biplot 15 Rice genotypes tested at different salinity levels.
Our results are in conformity with above findings; number of grains decreased with increased salinity and this effect was more pronounced in genotype IR61247-3B-8-2-1 (G3). Genotype 2B-2-2-3-3 (G9) followed by IR68144-2b-2-2-3-2 (G8) and IR66946-3R-176-1-1 (G15) gave significantly higher 100-grain weight than sensitive genotype IR29 (G14) even at 8 dSm-1. Grain weight is largely determined by the duration and rate of grain filling [18, 26]. Therefore, environmental stresses that tend to shorten the grain filling period will significantly reduce final grain weight [19]. Salt stress accelerates maturation and grain filling in some cereal crops [12, 9]. Therefore, nearly consistent reduction in grain weight at the higher salinity levels could be the result of shortened grain filling period [10]. Effect of salinity was most pronounced on the yield components, which were developing later. Consequently, salinity deprived their contribution to grain yield. These results are supported by the work of [10] who stated that yield components which were stressed by salinity during their development contributed less to grain yield. Grain yield was also adversely affected by increasing salt levels in rice genotypes under study. Grain yield reduction in this study as a result of salinity was characterized by poor seed setting, reduced number of seeds and also lower grain weight as compared those of the control treatment. Poor seed setting
characterized by sterile panicles is believed to be the consequence of pollen sterility in rice [1] and also in sorghum [4]. As compared to other plant attributes, grain yield per plant was more adversely affected by the two salinity levels in all genotypes, but the reduction was the same for all genotypes. Such results are also on the record in rice [2].
genotypes is very high here and more than compensates for the higher varietal effect of IR66946-3R-176-1-1 (G15), which has low GxE effect (less than 1/3 of IR59418-7B-21-3 (G1) and IR59418-7B-27-3 (G2)).
The GE biplot (Figure 3) which captures only the GE interaction effects distributes all the three salinity levels into different sectors. IR66946-3R-176-1-1 (G15) is again the winning genotype with the highest grain yield under S2, 4 dSm-1. IR29 (G14) is the winning genotype under S1, the
control. IR59418-7B-27-3 (G2) and IR69588-4R-P-3-3 (G6) and to a lesser extent IR59418-7B-21-3 (G1) and IR72593-B-13-3-2-1 (G11) are the winning genotypes under S3, 8 dSm-1. Although the mean grain yields of IR69588-4R-P-3-3 (G6) and IR72593-B-13-3-2-1 (G11) are not high under S3,8 dSm-1, these two genotypes have high GxE effects under this salinity level, as do IR59418-7B-21-3 (G1) and IR59418-7B-27-3 (G2).
Figure 3. GxE effects on grain yield per plant of 15 rice genotypes tested across three root zone salinity level.
The GxS interaction results were plotted to see the interaction pattern of each line against the three salinity levels (Figure 3). Accordingly, the interaction plot depicted that TCCP266-1-3B-10-2-1 (G4), IR68652-3B-22-3 (G5), IR70870-B-P-2-2 (G7), IR68144-2B-2-2-3-2 (G8) and IR66946-3R-176-1-1 (G15) have very short bars, have minimum interaction with any of the three environments; The sum of the absolute value of the interaction effects, or the sum of their squares, which is Wricke’s equivalence is minimal. Such genotypes are said to be stable and are adapted to all environments in the study. Such genotypes can be considered for use only if they have reasonable yields. Out of these, only IR68144-2B-2-2-3-2 (G8) and IR66946-3R-176-1-1 (G15) have high yields.
4. Conclusions
It is evident from the results of this study that the root zone salinity levels of 8 dSm-1 depressed the yield and yield components of all the genotypes under study. The magnitude of reduction varied not only for plant attributes but also the genotypes studied. This shows that genotypes of different genetic constitution show a differential reaction to salinity. The genotypes IR66946-3R-176-1-1 (G15), IR68144-2B-2-2-3-2 (G8), IR72593-B-18-2-2-2 (G13), IR59418-7B-21-3 (G1) and IR59418-7B-27-3 (G2) had high grain yield per plant. The salt-susceptible rice genotype, IR29 (G14) was found to be specifically adapted to non-saline growing
conditions. Although there was a tendency for IR66946-3R-176-1-1 (G15) to give high yield under 4 dSm-1, this genotype was found to be stable and to give high grain yield per plant under almost all the three salinity levels. In this particular experiment, the correlation analysis showed that negative and highly significant association was revealed between salt concentration and grain yield, indicating the adverse effects of different salinity levels on yield potential of rice crop. Although variations were observed among exotic genotypes in the present studies, it would be worthwhile to evaluate more genotypes over years and across locations under salinity stressed and non-stressed conditions in order to identify more diverse genotypes / land-races and confirm their salt tolerance.
The linear – bilinear AMMI biplot, statistical analysis procedure has been adopted for complex agricultural experiments. However, the results of this study confirmed their potential application for simple experiments without a blocking factor. AMMI was found to be useful in discriminating potentially stable and tolerant lines against salinity.
References
[2] Akbar, M., Sajjad, M. S. and Shakoor, A. 1979. Development of rice varieties for saline soils of Pakistan. Proc. Second National seminar on Rice Research and production, PARC, Pp: 79-84.
[3] Azhar, F. M. and McNeilly, T. 1987. Variability of salt tolerance in Sorghum bicolor (L.) Moench under hydroponic conditions. J. Agron., 159: 269–77.
[4] Azhar, F. M. and McNeilly, T. 1989. The response of four sorghum accessions/cultivars to salinity during plant development. Crop Sci., 63: 33-43.
[5] Burgueno, J., Crossa, J. and Vargas, M. 2001. SAS programs for graphing GE and GGE biplots. Biometrics and Statistics Unit, CIMMYT.
[6] Fentaw, A. 1995. Effects of subsurface drainage system on ground water table, soil salinity and crop yield in Melka Sadi Pilot drainage scheme. In: Woldeyesus Sinebo, Zerihun Tadele and Nigusie Alemayehu (Eds.), Increasing food production through improved crop management. Proceedings of the First and Inaugural Conference of the Agronomy and Crop Physiology of Ethiopia, 30-31 May 1995, IAR, Addis Ababa, Ethiopia, 139-148 pp.
[7] Flowers, T. J. and Yeo, A. R. 1981. Variability in the resistance of sodium chloride salinity within rice (Oryza sativa L.) varieties. New Phytol., 88: 363-373.
[8] Flowers, T. J. and Yeo, A. R. 1995. Breeding for salinity resistance in crop plants. Where next? Aust J Plant Physiol., 22, 875-884.
[9] Francois, L. E., Donovan, T. J., Maas, E. V. and Rubenthaler, G. L. 1988. Effect of salinity on grain yield and quality. Vegetative growth and germination of triticale. J. Agron., 80: 642–7.
[10] Francoise, L. E., Grieve, C. M., Maas, E. V. and Lesch, S. M. 1994. Time of salt stress affects growth and yield components of irrigated wheat. J. Agron., 86: 100–7.
[11] Francois, L. E. and Klieman, R. 1990. Salinity effects on vegetative growth, seed yield and fatty acid composition of crabme. J. Agron., 82: 1110-14.
[12] Francois, L. E., Maas, E. V., Donovan, T. J. and Youngs, V. L. 1986. Effect of salinity on grain yield and quality, vegetative growth, and germination of semi-dwarf and Durum wheat. J. Agron., 78: 1053-1058.
[13] Grieve, C. M., Lesch, S. M., Francois, L. E. and Maas, E. V. 1992. Analysis of main spike and yield components in salt stressed wheat. Crop Sci., 32: 697-703.
[14] Grieve, C. M., Lesch, S. M., Maas, E. V. and Francois, L. E. 1993 Leaf and spikelet primordia initiation in salt-stressed wheat. Crop Sci. 33: 1286-1294.
[15] IRRI. 1997. Standard evaluation system for rice. International Rice Research Institute. Manila. Philippines.
[16] Khan, M. S., Hamid, A. and Karim, M. A. 1997. Effect of sodium chloride on germination and seedling characters of different types of rice (Oryza sativa L.). Crop Sci. 179: 163-169.
[17] Kinfemichael G. 2005. Screening of some lowland teff accessions and varieties for NaCl-induced salinity stress during germination and seedling stage. Journal pf Dryland Agri.. 84p.
[18] Kirby, E. J. M. 1974. Ear development in spring wheat. J. Agric. Sci., 82: 437–47.
[19] Maas, E. V. and Grieve, C. M. 1990. Spike and leaf development in salt stressed wheat. Crop Sci. 30: 1309-13.
[20] Munns, R. 2002. Comparative physiology of salt and water stress. Plant Cell and Environ., 25: 239-250.
[21] Pearson, G. A. and Bernstein, L. 1959. Salinity effects at several growth stages of rice. J. Agron., 51: 654–657.
[22] SAS. 2001. Statistical Analysis System for Windows, release 8. 02. SAS Institute Inc., Cary, NC.
[23] Szabolcs, I. 1979. Review of research on salt affected soils natural resources research XV, UNESCO, Paris.
[24] Szabolcs, I. 1989. Salt affected soils. CRS press. Inc., Boca Ratan, Florida. pp. 274.
[25] WARC (Werer Agricultural Research Centre). 2009. Annual Climate record at Werer Agricultural Research Center. Annual Report, Werer Agro meteorology Research Section, Werer, Ethiopia. 6p.