http://www.sciencepublishinggroup.com/j/ijae doi: 10.11648/j.ijae.20200501.11
ISSN: 2575-3851 (Print); ISSN: 2575-3843 (Online)
Technical and Economic Efficiency of Irrigation Water Use
for the Farms of Blueberry and Raspberry in the Loukkos
Area in Morocco
Nassreddine Maatala
1, *, Younes Bekkar
1, Oumayma El Hassnaoui
1, Philippe Lebailly
21
Department of Humanities, Hassan II Institute of Agronomy and Veterinary Medecine, Rabat, Morocco
2Laboratory of Economy and Rural Development, University of Liege, Faculty of Gembloux Agro Bio-Tech, Gembloux, Belgium
Email address:
*
Corresponding author
To cite this article:
Nassreddine Maatala, Younes Bekkar, Oumayma El Hassnaoui, Philippe Lebailly. Technical and Economic Efficiency of Irrigation Water Use for the Farms of Blueberry and Raspberry in the Loukkos Area in Morocco. International Journal of Agricultural Economics. Vol. 5, No. 1, 2020, pp. 1-8. doi: 10.11648/j.ijae.20200501.11
Received: December 19, 2020; Accepted: December 30, 2020; Published: January 7, 2020
Abstract:
Water scarcity is a major constraint at national level, under the combined effects of irregular rainfall, the country’s growing needs to respond to demographic pressure and the call of competing economic sectors (agriculture, industry, drinking water, tourism, etc.). This situation is further exacerbated by the impact of climate change, so optimization and sustainable water management are a necessity. Within this framework, this research work aims to measure the performance of producers of red fruit farms at the Loukkos perimeter through an empirical analysis of their technical efficiency and efficiency of water use. To achieve this, a deterministic production frontier model (with a production technology represented by a translog functional form) has been specified using the software FRONTIER 4.1, allowing both the estimation of farm efficiency scores and the identification of the explanatory factors for technical inefficiency. Then the estimation of water use efficiency scores using the Reinhard derivative has been measured. Survey data collected from a sample of 40 raspberry and 20 blueberry farms in the Loukkos area were used for this purpose. The results show that a minority of the farms selected are below their production frontier and are characterized by technical inefficiency. The average technical efficiency is 91%, indicating a level ranging from 60% to 99% for raspberry and an average of 91% ranging from 80% to 99% for blueberry. Some of these producers could increase their technical efficiency without having to increase their input volumes. The technical efficiency of water use is higher than 80% for raspberry, for blueberry more than 98%. On the other hand, the economic efficiency of water use scores for both crops is high (99%). As regards the analysis of the determinants of the technical efficiency and efficiency of water use they were analyzed with GRETL using Tobit model, it follows that variables such as age of farm managers, level of education, and planting age for blueberries are significant and influence positively the level of technical efficiency and technical efficiency of water use in raspberry and blueberry operations. These various results were used to identify implications, in terms of development measures, with a view to improving the performance of these farms.Keywords:
Blueberry, Raspberry, Water Use Efficiency, Technical Efficiency, Irrigation1. Introduction
For the Mediterranean, climate constraints, particularly the scarcity of water resources, have always been structural characteristics. Societies have developed ingenious agricultural production systems to adapt to and cope with them. Today, this resilience is being tested. As a result of increasing population trends, the gaps between per capita water resources will
Morocco, significant progress has been made in irrigation water saving techniques and practices, in its collection and mobilization. As a Mediterranean country with a predominantly semi-arid and arid climate, Morocco’s water resources are limited by its geographical location and its exposure to climatic hazards. The Moroccan agricultural sector, a pillar of the country’s food security, is highly dependent on climatic hazards, particularly drought and the scarcity of water resources. Thus, the strategy of irrigation and water saving forms the basis of the country’s agricultural policy. In this respect, although irrigated agriculture covers only about 19% of the useful agricultural area, it contributes on average to about 50% of the agricultural value. Irrigation is a very important factor because it increases agricultural productivity and raises farmers' incomes. In other words, irrigated agriculture is considered an essential component of Morocco’s economy as a producer of wealth and creator of jobs. In this context, in April 2008, the Moroccan government launched an ambitious program called The Green Morocco Plan, which places agriculture at the top of the country’s priorities that aims to develop the entire agricultural potential of the territory and to break with the simplistic image of a dual agriculture which opposes a modern sector to a traditional one. Water is the key factor to agricultural production in a country where agriculture is a pillar of the national economy the control of water a technical and economic imperative and a privileged path for the economic and social development of the countries.
Hence the aim of this work, which is to measure the performance of red fruit producers in the Loukkos study area through an analysis of the technical efficiency and efficiency of irrigation water use and identifying the determinants that define them.
2. Materials and Methods
To achieve this object, an econometric model (using a translog functional form to represent the technology) has been specified, allowing both to estimate the efficiency scores, then the technical and economic efficiency scores of the use of irrigation water of the farms. Afterwards, the identification of the factors explaining the technical efficiency and the level of the technical efficiency of irrigation of water use is given. Survey data collected from a sample of 40 raspberry producers and 20 blueberry farmers in the Loukkos region in 2019 were used for this purpose.
2.1. Samplind Method
For the proposed study, a random sample was selected, this method allocates a chance for all individuals in a population to be selected. Adoption of this method is appropriate when the population is large and relatively homogeneous.
In this random sample, all individuals in the source population have a known and not zero probability of being selected to be part of the sample, there is no intervention from the researcher, only chance governs the inclusion or not of an individual in the sample and therefore the information collected on the sample can be inferred for the source
population.
2.2. The Sample Size
The sample size selected is 40 for raspberry farmers and 40 for blueberry. This size was respected for raspberry. For blueberry farms, the sample size was reduced to about 20 farmers. This reduction can be explained on one hand by two characteristics of blueberry farms: the first is that the majority of these farms are corporations or large investors who own several farms spread over the perimeter but under the same direction. Secondly, each farm is spread over a large area of land of hundreds of hectares or more, and thus the declared area in the region is subdivided into a small number of farmers with large areas. Thus, a minority of farmers with large holdings monopolizes the area for blueberry. On the other hand, small farmers with small acreages are poorly represented and are just beginning to develop, this is explained by the high investment in blueberry installation. Another limiting factor that led to the reduction of the sample is the difficulty of accessing large companies, especially those whose owners are foreigners who invested in Morocco. Moreover given the profitability of this speculation, producers prefer to keep their production practices secret to avoid competition.
2.3. Collection of Data
The primary data that fed the model came from a survey of raspberry and blueberry growers in Loukkos perimeter. The completion of the survey required the creation of a sample, the development of a questionnaire and the conduct of the survey. The instrument of measurement used in this study is the survey questionnaire, which is defined as a direct technique for interviewing individuals in a directive and identical manner, in order to establish relationships and comparisons. The direct interview approach was chosen as the survey method because it has the advantage of generally increasing the probability of obtaining a better response rate. It also facilitates the verification of the identity of respondents, as well as observing it directly in its environment. In addition, it establishes a relationship of trust with respondents, which ensures that the collection of responses is spontaneous and serves to better understand, dialogue and exchange information. Finally, this method offers the possibility of eliminating any ambiguity in relation to the question asked, in case of misunderstanding. Therefore, all of these reasons explain the choice of direct interview.
2.4. The Concept of Efficiency
practice in the sector. In other words, it measures how an operation optimizes the inputs that enter the production process. A production unit is technically efficient when it is on the frontier, that is, it consists of achieving as much output as possible for a given input level (orientation-output, maximization of output) or it consists in using as few inputs as possible for a given level of production (orientation-input). Technical efficiency is measured by the gap between the level of production observed and the optimal level of output determined by the production frontier [4-5].
Figure 1. Graphical representation of technical efficiency and allocative efficiency (case of two inputs and one output). (Farell 1957).
The figure above, proposed by Farrell [3], illustrates the distinction between types of efficiency, where there are two factors of production (labour L and capital K). The SS' isoquant represents the production frontier which is defined as the set of input combinations that are technically efficient for a given output level. Points above the isoquant characterize inefficient firms. The line (AA') represents graphically the ratio of market-determined input prices (the isocost curve). Thus, point Q represents a technically efficient firm, using the two production factors in the same ratio as the firm located at point P. All points located on the production frontier are technically efficient, and have a technical efficiency score equal to 1 while any point within the isoquant is technically inefficient for that production level. The technical efficiency of the operation at point P is given by the ratio OQ/OP, which varies between zero and the unit. Effective firms have a ratio equal to 1, and those with a ratio less than 1 must lower the input used by (1 – OQ/OP). For example, if the ratio is 0,85 it is necessary to decrease the input by 15% in order to become efficient and to position itself on the curve.
2.5. Methods for Estimating Efficiency
The literature reveals a variety of practical methods for estimating the production frontier and therefore the technical efficiency. Parametric approaches are proposed by Aigner and Chu, Aigner Lovell and Schmidt [6-7]. They require the specification of a particular form of production technology (most typically a Cobb-Douglass, translog, CES, Leontief, etc.). In other words, they require the imposition of a specific functional form of the production function known in advance, while linking independent variables to dependent variables. As their names indicate, parametric boundaries incorporate a number of parameters to construct the
production frontier. These parameters are estimated using econometric tools.
The estimation of the parametric deterministic frontier production function, carried out by Aigner and Chu [6], is based on the assumption of a production function giving the maximum possible production from the factors of production. A production, cost or profit frontier will be called deterministic, assuming that the differences between the estimated function and the actual observations correspond exclusively to productive inefficiencies. It therefore has a fixed frontier, in that it presents a single error term that is positive and makes it possible to detect inefficiency. The stochastic production frontier breaks down the error of the studied function into two independent elements: first, a symmetric component allowing purely random variations, reflecting measurement errors, the wrong specification of the model (variations related to variables not taken into account in the model) and uncontrollable factors implying that the firm has no decision-making power to improve its efficiency. The integration of this term gives the stochastic nature to this type of efficiency frontier.
The non-parametric approach overcomes the disadvantage of the parametric approach, since it does not require the specification of a particular analytical form of the production technology and does not introduce any parameters to formalize the relationship between inputs and outputs. In other words, it is not associated with a specific functional form and no distribution of inefficiency.
In this research, the deterministic parametric method is used to measure the level of efficiency because red fruit farms tend to control most of variables due to the fluctuations of climate since blueberry and raspberry are cultivated in a controlled atmosphere under greenhouses. Using a translogarithmic functional form that allows the interactive effects between production factors to be taken into account. Moreover, this function accepts the Reinhard derivative which will allow the transition from technical efficiency to the efficiency of water use [8].
2.6. Estimation of Irrigation Water Use Efficiency
Figure 2. Measuring Efficiency of Irrigation Water Use by Karagiannis et al (2003).
Suppose that in this figure, X represents a measure of all the agricultural inputs needed for production other than irrigation water, and the Y0 curve is the set of minimum
combinations of inputs X and water for irrigation which can be used to produce an output level Y0. Point A represents an
exploitation that produces a level of output Y0 using a level
of inputs X1 and a quantity of irrigation water W1.
The output-oriented technical efficiency of the farm (i) is given by
TEi = X1C/ X1A ; 0< IWTEi <1
The advantage of this measure is that it determines the minimum possible use of the water W2 necessary to produce
the same output level Y0 while using the same quantity X1 of
the other inputs. It also determines the maximum possible reduction in the amount of irrigation water used (W1- W2).
IWTEi = exp {[ - (αw + αww + ∑ αjw ) + {(αw +
αww + ∑ αjw )2 – 2 αww * ui}0.5]/ αww}
It should be noted that IWTE does not provide information to achieve savings due to the efficient use of the different inputs. To do this, a specific measure of efficiency combines both the technical efficiency and the economic efficiency of the use of irrigation water. Karagiannis define the economic efficiency of the use of irrigation water for an operation i (ITCEi) as potential cost savings through an adjustment of
the consumption of irrigation water to a technically efficient level, while keeping the same level of other factors of production [11]. According to Akridge ITCEi is estimated as
follows:
ITCEi= Swi IWTEi + ∑ ji, j≠w
Where:
ITCEi is the economic efficiency of water use Swi is the
observed cost share of irrigation water Sji is the
corresponding cost of other inputs. By definition, the cost share of all inputs must be equal to 1 and IWTEi takes values
between zero and one. This implies: 0 <ITCEi< 1.
Cost savings depend on factor prices and the very low price of irrigation water can lead to cost-effectiveness even in the face of inefficient use of water in a physical sense, and vice versa (Kopp, 1981).
It is essential to emphasize that the estimates of the ITCEi should be calculated with caution, since a very small share of the cost of irrigation water in the total cost of production can lead to high ITCEi even in case of using irrigation water in an inefficient way.
2.7. The Model Specification
The methodology adopted to study the efficiency of red fruit farms uses the parametric approach of the deterministic production frontier. The structural form of the deterministic production frontier is represented by the following form:
= (; α)exp ( )
variables.
Choosing the translog form for the production function gives the following equation [12-15]:
Ln Yi = α0 + ∑ αj + (∑ ∑ αjk ) +
αw + (αww 2 + ∑ α jw ) - ui
The inefficiency model is defined as follows:
Ui= Ziδ+Wi
Where zi is a vector of variables that explain differences in efficiency between farmers; δ parameters to be estimated wi is a random variable defined by the truncation of the normal distribution with zero as mean and variance σ²
2.8. The Choice of Variables
Due to the field surveys it turns out that the main two factors of production are water and labor. Therefore, we estimate that production technology at the Loukkos perimeter depends mainly on irrigation water, intermediate consumption and labor. Besides, since the aim of this research is to measure the irrigation water use efficiency, the choice of the “water” variable is justified. As for intermediate consumption, attempts have been made to separate the costs of fertilizers from the costs of other inputs (phytosanitary products and others) but it didn’t work. Hence, our model contains four inputs. The output of our model is the quantity produced of blueberry or raspberry.
2.9. Analysis of the Determinants of Irrigation Water Use Efficiency
In this research, four variables were identified as factors that may affect the technical efficiency of agricultural operations (Ui= Ziδ+Wi). Thus, in the light of the existing literature, it will be interesting to test the following variables: one part of the literature is concerned with the impact of the age of the farmer on technical efficiency. For some authors, older producers are more effective than younger farmers, this effect is positive because of strong experience on the farm. In fact, over time, the operator tends to develop some expertise and know-how regarding best practices for using inputs. Another variable that can also improve the efficiency of farm operators is the level of education of the farm manager. The positive role of education has been revealed in the literature. In fact, an educated agricultural producer is very receptive to the accumulation of knowledge and thus assimilates the training provided more quickly. The experience gained by farmers plays an important role in performance, since the accumulation of experience and know-how provides farmers with practical knowledge that improves their technical efficiency. Several authors confirm that large farms tend to be more efficient and effective as these types of farms have made a large investment that must be profitable, in addition, they have the financial means to train the workforce or to ask for off-farm expertise if
necessary [16-18].
For blueberry, the variable age of plantation is also important to take into consideration because the production in first years is very low but along the way the production grows until reaching high levels.
Therefore, our models are as follows:
IWTEi, ITCEi, TEi = f (age of the farmer, status, level of
education, the experience, area of raspberry)
IWTEi, ITCEi, TEi = f (age of the farmer, status, level of
education, the experience, area of blueberry, age of plantation)
With:
IWTEi: The technical efficiency of the use of irrigation
water;
ITCEi: The economic efficiency of the use of irrigation
water;
TEi: The technical efficiency of raspberry and blueberry
farms;
Age of the farmer: in years
Status: the nature of farm manager (it is a binary variable with the value 0 if it’s manager and 1 if it’s the person who holds the farm himself manage the farm)
Level of education: The level of education of the farm manager i in number of years of schooling
The experience: the number of years spent in practicing raspberry and blueberry.
Area of raspberry or bluberry: the area of the holding i expressed in ha cultivated in raspberry or blueberry
Age of plantation: in years
3. Results and Discussion
3.1. Raspberry
3.1.1. Frontier Production
First, the estimation of the production function of red fruit farms. The results of this FRONTIER 4.1 estimate are presented in the following table:
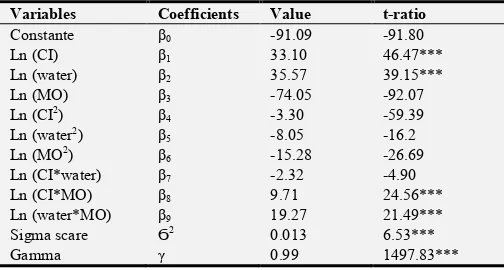
Table 1. Result of the estimation of the parameters of the translogarithmic deterministic frontier of raspberry.
Variables Coefficients Value t-ratio
Constante β0 -91.09 -91.80
Ln (CI) β1 33.10 46.47***
Ln (water) β2 35.57 39.15***
Ln (MO) β3 -74.05 -92.07
Ln (CI2) β
4 -3.30 -59.39
Ln (water2) β
5 -8.05 -16.2
Ln (MO2) β
6 -15.28 -26.69
Ln (CI*water) β7 -2.32 -4.90
Ln (CI*MO) β8 9.71 24.56***
Ln (water*MO) β9 19.27 21.49***
Sigma scare Ϭ2 0.013 6.53***
Gamma γ 0.99 1497.83***
*** Significant to 1% ** Significant to 5% * Significant to 10%
between these variables and the quantity of output produced. The gamma value ( ) indicates the deviation from the production frontier. In this case, this discrepancy is explained by the inefficiency of the farms at 99%. This result shows that the difference between the production observed and the potential production of the farms studied is due to their inefficiency. On the other hand, the closer the value of is to 1, the smaller the difference between the results of a stochastic estimate and those of a deterministic estimate, and therefore it is rather a deterministic model.
3.1.2. Determinants of Technical Efficiency
Table 2. Technical efficiency scores of raspberry farms.
0.6<ET≤0.7 0.7<ET≤0.8 0.8<ET≤0.9 ET> 0.9
3% of farms 5% of farms 33% of farms 60% of farms
The results for the technical efficiency scores, calculated by the FRONTIER 4.1 software, show a high level of scores. The average technical efficiency is 0.91, this level confirms the high technical performance of raspberry farms in the Loukkos area. Indeed, 3% of farms have an efficiency score between 0.6 and 0.7; 5% of farms have a score between 0,7 and 0.8 while 33% of farms have an efficiency score of between 0.8 and 0.9 and the majority of 60% of farms have an efficiency score of just over 0.9.
Table 3. Determinants of technical efficiency of raspberry farms.
Signe Coefficient P-critical
Constante + 0,69 0,01***
Age + 0,005 0,08*
Statut - 0,06 0,27
Level of education + 0,01 0,09*
Experience - 0,02 0,03**
Raspberry acreage + 0,001 0,81
*** Significant to 1% ** Significant to 5% * Significant to 10%
The results of the table show that the coefficients are significant for the three variables ‘Age’, ‘level of education’, and ‘Experience’. The sign of coefficients allows us to understand the nature of correlation between the independent variable and the dependent variables.
3.2. Determinants of Water Use Efficiency
3.2.1. Technical Efficiency of Water Use
Table 4. The water use technical efficiency for raspberry.
0,8<IWTE<0,9 IWTE>0,9
2% 98%
Only one farm has a technical efficiency of water use of 87%, the other farms have an efficiency of 95%, 97%, 98% and 99%. These high figures of the technical efficiency of the use are explained by the mastery of the production techniques by the raspberry producers given the investment mobilized, the margin of error must be reduced to the minimum possible. In addition to the support provided by the various stakeholders in the sector.
Using the GRETL software, regression of the
‘effectiveness score’ variable was performed on explanatory variables that could influence these efficiency levels using the Tobit model to account for truncated character (between 0 and 1) of the dependent variable (efficacy score).
Table 5. Determinants of water use technical efficiency of raspberry.
Signe Coefficient p
Constante + 0,77 2,15e-08***
Age + 0,004 0,09*
Statut - 0,05 0,31
Level of education + 0,01 0,02**
Experience - 0,02 0,02**
Raspberry acreage - 0,001 0,73
*** Significant to 1% ** Significant to 5% * Significant to 10%
According to this table, three variables have significant coefficients: ‘Age’, ‘Education level’, and ‘Experience’.
3.2.2. The Water Use Economic Efficiency
The interpretation of economic efficiency scores for water use depends on factor prices and the share of irrigation loads relative to production loads. This can lead to high scores even if there is inefficiency in water use and vice versa, hence the cautious interpretation of these scores.
All farmers in the sample have water economic efficiency scores of 99%, due to the low cost of extracting water and moving it to the plots.
4. Blueberry
4.1. Production Frontier
First, the estimation of the production function of red fruit farms. The results of this FRONTIER 4.1 estimate are presented in the following table:
Table 6. Result of estimation of translogarithmic deterministic frontier of blueberry.
Variables Coefficients Value t-ratio
Constante β0 76.12 76.22***
Ln (water) β1 70.28 83.49***
Ln (CI) β2 -47.59 -66.41
Ln (MO) β3 -23.91 -27.27
Ln (water2) β
4 3.55 6.06***
Ln (CI2) β5 5.57 21.08***
Ln (MO2) β
6 -2.20 -5.57
Ln (water*CI) β7 -12.14 -15.78
Ln (water*MO) β8 3.22 3.88***
Ln (CI*MO) β9 2.01 6.50***
Sigma scare Ϭ2 0.01 4.41***
Gamma γ 0.99 437.59***
*** Significant to 1% ** Significant to 5% * Significant to 10%
Unlike the significant “Irrigation Water” factor, the Labour and Intermediate Consumption variables are not significant since only the water coefficient indicates a very strong correlation between this variable and the quantity of output produced.
shows that the difference between the production observed and the potential production of the farms studied is due to their inefficiency. On the other hand, the closer the value of is to 1, the smaller the difference between the results of a stochastic estimate and those of a deterministic estimate, and therefore it is rather a deterministic model.
4.2. Determinants of Technical Efficiency
Table 7. Technical efficiency scores for blueberry farms.
0,8<TE<0,9 TE>0,9
45% 55%
The results for the technical efficiency scores, calculated by the FRONTIER 4.1 software, show a high level of scores. According to the above table, 55% of farms have a technical efficiency score above 90%, and the rest has a score between 80% and 90%. Farms have high scores, scores above 90% represent farms that have reached the peak of production, that is, 5 to 6-year-old plantations for the rest, they are usually early stage farms.
Using the GRETL software, regression of the ‘effectiveness score’ variable was performed on explanatory variables that could influence these efficiency levels using the Tobit model to account for truncated character (between 0 and 1) of the dependent variable (efficiency score).
Table 8. Determinants of Technical Efficiency.
Signe Coefficient p
Constante + 1,14 9,18e-028***
Age - 0,005 0,05*
Status + 0,007 0,86
Level of education - 0,01 0,009***
Experience + 0,06 0,85
Blueberry acreage + 0,001 0,82
Age of plantation + 0,02 0,03**
*** Significant to 1% ** Significant to 5% * Significant to 10%
The results of the table show that the coefficients are significant for the three variables ‘Age’, ‘Education level’ and ‘Planting age’. The sign of coefficients allows us to understand the nature of correlation between the independent variable and the dependent variables.
4.3. Determinants of Water Use Efficiency
4.3.1. Technical Efficiency of Water Use
Farms have technical water use efficiency scores of either 98% or 99%.
Table 9. Determinants of technical efficiency of water use.
Signe Coefficient p
Constante + 1,009 0,0000***
Age - 0,0004 0,03**
Status + 0,0003 0,92
Level of education - 0,0008 0,007***
Experience + 0,02 0,48
Blueberry acreage + 0,0002 0,60
Age of plantation + 0,00192390 0,0192**
*** Significant to 1% ** Significant to 5% * Significant to 10%
According to the above table, three variables have significant coefficients: Age, Education level and Planting age.
4.3.2. The Economic Efficiency of the Use of Irrigation Water
All farmers have water use economic efficiency scores of 99%, this is due to low irrigation loads in comparison with other loads because the cost of pumping, storing and discharging water to the plot remains low relative to other production loads.
5. Conclusion
Following the results obtained through the use of the Tobit model to regress the scores of technical efficiency and technical efficiency of water use on the explanatory variables using the GRETL software, it was found that age has a positive effect on the scores of these two indicators, that is, as producers age they are more effective and efficient.
The experience variable has a negative effect on the technical efficiency and technical efficiency scores for water use. Indeed, the introduction of raspberry is recent in the perimeter and Morocco and therefore the producers do not have a very wide experience evaluated by the number of years of practice of this crop. In addition, producers started with the introduction of strawberries and then the demand for diversification has only been around for a few years, confirming that producers in the perimeter have recently adopted this crop. Education level has a positive effect on farm technical efficiency scores and technical water use efficiency. In fact, educated owners and managers tend to be more receptive to new practices and technologies which improve their performance. Based on the results, the status is that the management of the farm is provided by the owner or a manager and the area of raspberry does not have a significant impact on the efficiency and efficiency scores. This shows the absence of the size effect of farms on the scores, regardless of the size of the farm the producer always seeks to maximize his production by minimizing these burdens.
The interpretation of the determinants of blueberry is mainly dependent on the planting age. In fact, the blueberry is a shrub that occupies the ground for 10 years on average and therefore the production begins with low yield until reaching the peak in 5-6 years hence the positive effect of planting age on the technical efficiency and efficiency of water use. The producers of the sample collected whatever the managers or owners are educated except one, the persons surveyed are mostly young. The interpretation of the sign of these two variables must be with caution since the majority of farms are at the beginning of production so even if the sign is now negative it can change after a few years when reaching of peak production.
References
[1] Ghali M., Daniel K., Colson F. & Latruffe L. (2014). Diagnostic de l’efficacité technique des exploitations agricoles françaises: une analyse de l’efficacité d’utilisation des ressources énergétiques et exploration des déterminants relevant des pratiques agricoles, pp. 29.
[2] Djimasra N. (2009). Efficacité technique, productivité et compétitivité des principaux pays producteurs de coton. Economies et finances. Université d'Orléans, pp. 226-284. [3] Farrell, M. J. (1957). The measurement of productive
efficiency. Journal of the Royal Statistical Society, Series A (General), Vol. 120, n°. 3, pp. 253-290.
[4] Battese, G. E., & Coelli, T. J. (1992). A stochastic frontier production function incorporating a model for technical inefficiency effects. Armidale: University of New England, Dept. of Econometrics. Working papers in econometrics and applied statistics. pp. 69.
[5] Coelli, T. (1996). A Guide to Frontier Version 4.1: A Computer Program for Stochastic Frontier Production and Cost Function Estimation. Working Paper n° 7/96, Centre for Efficiency and Productivity Analysis (CEPA), Department of Econometrics, University of New England, Armidale, Australia.
[6] Aigner, D-J., & Chu, S-F. (1968). On Estimating the Industry Production Function. The American Economic Review, vol. 58, n°. 4, pp. 826-839.
[7] Aigner, D-J., Lovell, C-A., & Schmidt, P. (1977). Formulation and Estimation of Stochastic Frontier Production Functions. Journal of Econometrics, vol. 6, n°. 1, pp. 21-37.
[8] Reinhard, S., Lovell, C. A. K., & Thijssen, G. J. (2000). Environmental efficiency with multiple environmentally detrimental variables; estimated with SFA and DEA. European Journal of Operational Research, vol. 121, n°. 1, pp. 287-303.
[9] Battese G. E. and Coelli T., (1995). A model of technical inefficiency effects in a stochastic frontier production function for panel data. Empirical Economics, Vol. 20, pp 325-332. [10] Karagiannis G., Tzouvelekas V. and Xepapadeas A., (2003).
Measuring irrigation water efficiency with a stochastic production frontier: an application to Greek out-ofseason vegetable cultivation. Environ. Resource Econ. Vol. 26, pp 57–72.
[11] Kopp R. J., (1981). The measurement of productive efficiency: a reconsideration. Quart. J. Econ, Vol. 96, pp 477–503. [12] Christensen L. R., Jorgenson D. W. et Lou L. J., (1973).
Transcendental logarithmic production frontiers. Rev. Econ. Stat, Vol. 55, pp 28–45.
[13] Kneller R. and Stevens A., (2003). The specification of the aggregate production function in the presence of inefficiency. Econ. Lett, Vol. 81, pp 223–226.
[14] Duffy, J., Papageorgiou, C., (2000). A cross-country empirical investigation of the aggregate production function specification. J. Econ. Growth, Vol. 5, pp 87–120.
[15] Varian, H. R., (1978), Microeconomic Analysis. W. W. Norton and Co. Inc., New York.
[16] Maatala, N. (2018). Quels impacts du partenariat public-privé sur les exploitations agricoles et la valorisation de l’eau d’irrigation ? ‘’Cas du projet El Guerdane au Maroc’’. Thèse de doctorat: Institut Agronomique et Vétérinaire Hassan II, Rabat, Maroc & Université de Liège, Gembloux Agro-Bio Tech, Gembloux, Belgique.
[17] Maatala, N., Fadlaoui, A., & Lebailly, Ph. (2019). Evaluation of the Impact of Partnership Program on the Technical and Economic Efficiency of Irrigation Water Use for Moroccan Citrus Farms. International Journal of Agricultural Economics, vol. 4, n°. 2, 2019, pp. 70-79.