and Dengue Outbreak in Lahore
Syed Afrozuddin Ahmed
Department of Statistics University of Karachi, Pakistan
Junaid S. Siddiqui
Department of Statistics University of Karachi Karachi, Pakistan [email protected]
Abstract
Various studies have reported that global warming causes unstable climate and many serious impacts to physical environment and public health. The increasing incidence of dengue is now a priority health issue, becomes a health burden of Pakistan. In this study it has been investigated that spatial pattern of environment causes the emergence or increasing rate of dengue fever incidence that affects the population and its health. Principal component analysis is performed for the purpose of finding if there is/are any general environmental factor/structure which could be affected in the emergence of dengue fever cases in Pakistani climate. The daily dengue fever (DF) cases in Lahore and five climatic variables precipitation (P), relative humidity (H), maximum temperature (Mx), minimum temperature (Mn) and wind speed (W) were taken from 2011 to 2012. Principal component is applied to find structure in data for dengue period. The PC1 is the linear combination of Mx, Mn and W and interpreted as “Windy and hot (HtW)”. PC2 is the combination of H and P and this factor can be named as “Wetness (Wt)”. The PC3 is found to be contrast between W and P that may label as “Windy and Dry (WD)”. PC4 is contradiction between H and P that indicate in Lahore there is a climatic factor which is “Humid but no Rain” (HnR). Time series plot of PCs show seasonal variation, graph shape is dominated by weighted average of temperature. Correlation analysis shows that dengue fever is highly correlated with maximum and minimum temperatures. PC1 and PC4 of daily climatic factors are positively correlated with daily dengue occurrence and they are highly significant, similarly PC3 of daily is negatively correlated with dengue occurrence. This gives the conclusion that wet and windy weather prevents dengue outbreak.
Keywords: Correlation structure, Dengue Fever, Environmental condition, Global warming, Principal component analysis.
I. Introduction
Pak.j.stat.oper.res. Vol.X No.2 2014 pp247-256
248
become a serious and dangerous health risk for the public. About two million people are affected by dengue fever in the world WHO (2009). “Den-1, Den-2, Den-3 and Den-4” are used the names of serotypes which causes severe dengue [27].
The dengue infectious disease spreads in warm climate by Weaver et al. (2009). Aedes Agepty mosquitoes are seriously sensitive by environmental conditions. The climatic variables i.e., precipitation, humidity, temperature and wind speed are helping for the survival and reproduction of dengue mosquitoes. High temperature helps to decrease the time lag for the replicate of the dengue mosquito virus. This process is called “Extrinsic Incubation Period”, in this period virus is transferred from mosquito to human body through the mosquito’s salivary glands. In the high temperature mosquito become infectious faster and has higher probability to dangerous for human being before completing its life cycle Gubler (1997). Climatic change and environmental factors are helping to flourish the dengue vector but there are some other factors also play a vital role for the dengue outbreak. In the hot weather incubation time of virus is lesser, which indicates that there is low probability of survival of mosquito to become infectious. Due to global warming the range of the mosquito is increasing. So we may say that the critical factor is climate by which the situation may be controlled to the mosquito habitat.
We can see vast amount of information from the researchers Hii, YL et al. (2009), Su (2008), GL (2008), Arcari et al. (2007), Johansson et al. (2009), Reiter (2001) and Kuhn et al. (2005) have studied and reported that there is a positive correlation between the amount of rainfall and relative humidity with dengue occurrence. Similar results have also reported by other studied groups Chowell et al. (2003) and Barbazan et al. (2010) regarding the correlation between rainfall and infection rate of dengue. Jetten et al. (1997) and Russell (1998) have showed the relationship between climatic factors and dengue fever incidence to indicate or predict variation in dengue incidence. Barbazan et al. (2010) and Brunkard et al. (2008) have assessing the effects of temperature and precipitation on dengue transmission relation. Amarakoon et al. (2004) has studied the dengue epidemics and its association with precipitation and temperature.
For the purpose of statistical analysis, PCA and other statistical techniques are used to explore the structure in the weather data and the relations between DF and climatic variables. Afrozuddin (2013), Hii et al. (2009) and Su (2008) have also discussed the relations between climatic variable and dengue incidence.
100 200 300 400 500 600 700 800
D
ai
ly
D
en
gu
e
R
ep
or
te
d
country, Karachi and Lahore are the cities which are heavily threatened by dengue epidemics in pre and post monsoon periods by Humayoun (2010) and Jahan (2011).
Data and Methodology II -A. DATA
This study was conducted in Lahore capital of Punjab. In 2011 Govt. of Punjab, Pakistan has established the Dengue surveillance cell for not only keeping the records of Dengue Fever reported cases, but also providing the awareness about the DF and the health facilities to the people in this regard. The data is available for researchers to study it with different angles.
Daily data of the five climatic variables of Lahore from 2011-2012 is used with Dengue fever data, provided by Pakistan Meteorological Department, Karachi, and Dengue surveillance cell Lahore, Govt. of Punjab, Pakistan respectively.
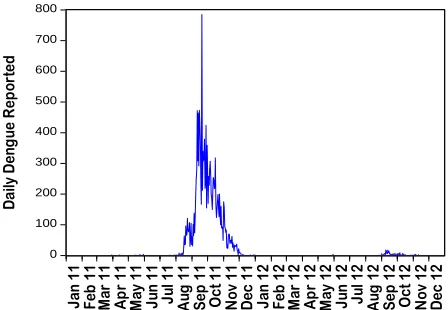
Table 1 indicates the number of Dengue cases reported in Lahore from 2011-2012, which shows remarkably increasing trend from January to December in 2011, just after this period Punjab government has taken very serious action against dengue outbreak and successful to reduce 15.47% in 2012.
Table 1: Number of Dengue cases reported in Lahore (2011 -2012)
Year Jan Feb Mar Apr May Jun Jul Aug Sep Oct Nov Dec Total
2011 0 0 4 5 15 3 6 1124 8254 5805 1531 55 16802
2012 0 0 0 0 5 1 0 6 174 58 15 1 260
Source: Dengue surveillance cell Lahore, Govt. of Punjab, Pakistan
The government of Punjab has imported the medicines and invited the team of expert from abroad who have coordinated with the local team to control the dengue outbreak and successful to reduce 15.47% in 2012. Graph shown in Fig 1 also reveal this fact, in this graph high peak is during September-October 2011, while this is negligible for the year 2012. The continuous efforts of the government have reduced the dengue outbreak which can be observed from the year 2012 in the given table 1.
Figure 1: Lahore Daily Dengue Cases (2011-2012)
Pak.j.stat.oper.res. Vol.X No.2 2014 pp247-256
250
II-B. Methodology
In this study our focus is to explore the climatic variables and/or the climatic factors (structure) which may influence in the increase or decrease in the number of dengue fever cases in Lahore. To find the climatic structure Principle component analysis (PCA) method is used.
PCA technique is recognized as reduction and extraction for dimensionality of the data and rating as much of the variation present in the original data set David (2011). This is one of the ways of identifying patterns in the data Will (1999). It is difficult to find patterns in the data, so for this purpose we use PCA, which highlight the similarities and difference in the data. The pattern in the data can be found by squeeze the data, in other word by suppressing the dimensionality of the data, and by avoiding the losses of information. This procedure is also use in the image compression or image reorganization. The purpose to apply the PCA is to reduce the manifest variables, in this way the set of components will be reduced [25]. The new components are called PC1, PC2, PC3 and so on, (for the first, second and third principal components) are independent and decrease the amount of variance from the original data set. PC1 (the first component) captures most of the variance, PC2 captures the second most of the variance and so on until all the variance is accounted for, in this way very few will be retain for the further study Edwards (1991).
The components have been treated as climatic factors or climatic structures. As the Principle component method transforms, correlate observed variables in to uncorrelated variables which are linear combination of observed data. The required condition for applying this method/technique is correlation/covariance where it may be defined. In this problem correlation technique is applied as an application of PCA.
II. Results and Discussion
III-A. PCA to Explore Climate Structure of Lahore
For the purpose of further statistical analysis, we have applied Principle component analysis technique to transform the data, to find structure in weather of the data.
The Lahore monthly daily climatic data from 2011-2012 are available with five climatic variables namely precipitation (P), maximum temperature (Mx), minimum temperature (Mn), humidity (H) and wind speed (W).
Table 2: PCA for Daily Climatic variables: (2011 – 2012)
HtW is windy and hot; Wt is wetness; WD is wind and dry; HnR is humid but no rain.
PCs in the Table 2 are presented in terms of simplified linear combinations of climatic variable that are effecting in the construction of corresponding PCs.
In Table 2, summarized results and the relevant quantities are presented in such a way that the readers can easily understand. The Interpretation and Labeling of Principal Component are done on the basis of Table 2.
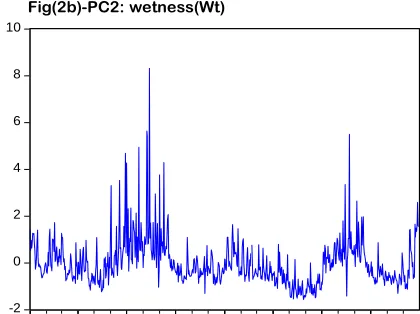
The PC1s for data are constructed as linear combination of same climatic variables that are Mx, Mn and W. Therefore this component can be interpreted or labeled as “Windy and hot (HtW)”. The PC2s are linear combination of H and P thus, this factor can be named as “Wetness (Wt)”. Therefore we can say that the second major component of Lahore is the rain with high humidity in weather. The PC3s are found to be contrast between W and P that we may label as “windy and dry (WD)”. PC4s is contradiction
between H and P that indicate in Lahore there is a climatic factor which is “Humid but no rain (HnR)”of Lahore weather.
III-B. Time series analysis of PCs for Lahore Daily Dengue period (2011-2012)
To study the behavior of PCs we have made time series plot of PC score for daily data. Figures (2a to 2d) shows the time series plot of PC1 to PC4 for Dengue period.
Plot of PC1 shows seasonal variation by two hills. The hill slope goes up from January to June-July, starts coming down from August to lowest period in January- February and the process is repeated. The graph shape is dominated by weighted average of temperature. The whisker in the graph of data represents this effect of other variable Wind speed.
Daily Dengue period (2011 – 2012)
PCs Linear combination Label %
PC1
PC2
PC3
PC4
0.9(Mx+Mn) + 0.5W
0.75(P+H)
0.7W-0.5P
0.5(H-P)
HtW Wt WD HnR
43
27
15
Pak.j.stat.oper.res. Vol.X No.2 2014 pp247-256
252
Figure (2a to 2d): Score plots for Lahore daily Climatic factors of Dengue period (2011-2012)
-3 -2 -1 0 1 2 3
Jan 11 Apr 11 Jul 11 Oct 11 Jan 12 Apr 12 Jul 12 Oct 12
Fig (2a)-PC1: windy and hot (HtW)
-2 0 2 4 6 8 10
Jan 11 Apr 11 Jul 11 Oct 11 Jan 12 Apr 12 Jul 12 Oct 12
Fig(2b)-PC2: wetness(Wt)
-8 -6 -4 -2 0 2 4 6
Jan 11 Apr 11 Jul 11 Oct 11 Jan 12 Apr 12 Jul 12 Oct 12
Fig(2c)-PC3:wind and dry(WD)
-8 -6 -4 -2 0 2 4
Jan 11 Apr 11 Jul 11 Oct 11 Jan 12 Apr 12 Jul 12 Oct 12
III-C. Correlation between Climatic Factors and DF Cases
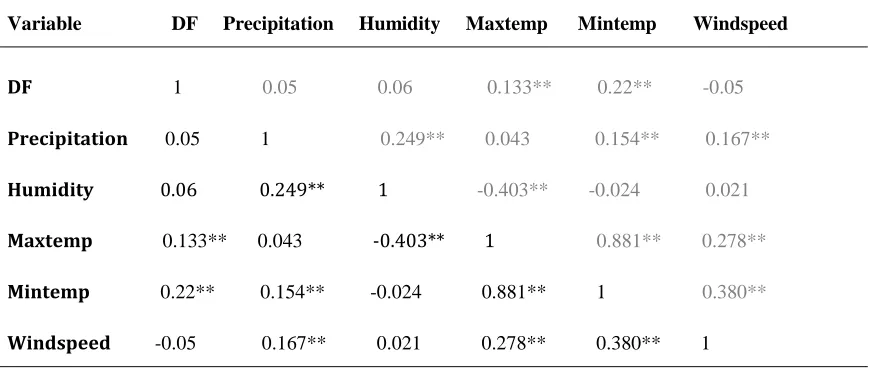
The following Table 3 is the correlation between Lahore daily Dengue fever and climatic variables for the dengue period 2011-2012.
Table 3: Correlation among daily Dengue fever and C.V (2011-12)
Variable DF Precipitation Humidity Maxtemp Mintemp Windspeed
DF 1 0.05 0.06 0.133** 0.22** -0.05
Precipitation 0.05 1 0.249** 0.043 0.154** 0.167**
Humidity 0.06 0.249** 1 -0.403** -0.024 0.021
Maxtemp 0.133** 0.043 -0.403** 1 0.881** 0.278**
Mintemp 0.22** 0.154** -0.024 0.881** 1 0.380**
Windspeed -0.05 0.167** 0.021 0.278** 0.380** 1
**: significance at α =0.01 *: significance at α =0.05
Figure 3: Correlation structure of Daily DF and climate variables
Positive Correlation
The significance of correlation indicated by **, significance at α = 0.01 level and by * significance at α = 0.05. To understand the behavior of daily data, pairs of significant correlation are connected with arrows.
Pak.j.stat.oper.res. Vol.X No.2 2014 pp247-256
254
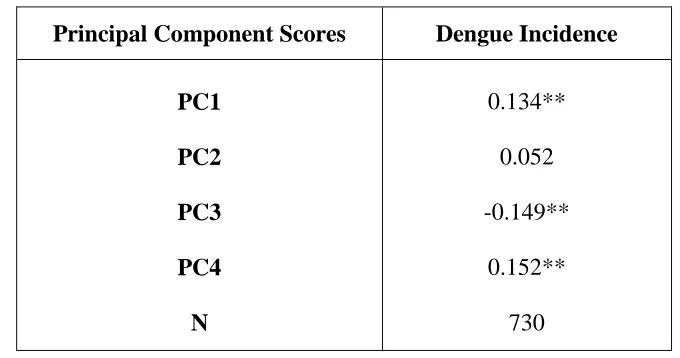
Table 4: Correlation between Dengue Incidence and PCs of Lahore for the period (2011-2012)
Principal Component Scores Dengue Incidence
PC1 PC2 PC3 PC4 N
0.134**
0.052
-0.149**
0.152**
730
** Correlation is significant at 0.01 level of significance.
We can observe from the above table that PC1 and PC4 of daily climatic factors are positively correlated with daily dengue occurrence and they are highly significant, similarly PC3 is negatively correlated with dengue occurrence. This gives the conclusion that wet and windy weather prevents dengue outbreak.
III. Conclusion and Recommendations
The PC1 for daily data of 2011 -2012 revealed that the major climatic factor is variation in temperature with high wind speed. PC2 of daily dengue period contributes wetness and low wind speed in the climate. Since humid climate with low wind speed support the spread of dengue fever so, PC2 is an important factor for the Lahore data that facilitate the expansion of dengue fever in Lahore. PC3 for dengue outbreak period also indicates r the fact that in dengue outbreak period the wetness and low wind in climate facilitate the breeding of dengue vector. Another important climatic factor is humid and dry weather which also support the dengue vector.
The study revealed that climatic variation is an important factor for the dengue outbreak in Lahore. We may conclude that wetness and low wind speed in the weather have some impact on the occurrence of dengue outbreak.
It is suggested that surveillance teams should keep eyes on the changes in relative humidity and wind speed and if wind speed changes for consecutively days take serious remedial measures. Since in months of August and September large number of dengue cases are expected so remedial measures should be taken in the months of June and July.
Acknowledgement
The author would like to acknowledge and thanks Pakistan Meteorological Department, Karachi, Pakistan for providing climatic data and to Dr. Abdul Rehman Khawaja from MIS cell and Dengue Department of Govt. of Punjab, who have provided the data, regarding the Dengue Fever.
References
1. Afrozuddin, S.A. (2013). Modeling of Population, Health and Environmental Data through Generalized Linear Models (GLMs). Unpublished Thesis for the degree of Ph.D. in the Department of Statistics, University of Karachi, Karachi. Pakistan.
2. Amarakoon, A.M.D., Chen, A.A., Rawlins, S.C. and Taylor, M.A. (2004).
Dengue epidemics - its association with precipitation and temperature, and its
seasonality in some Caribbean countries. West Indian Medical Journal 53 (Supp
2) 60.
3. Arcari, P., Tapper, N. and S. Pfueller, S. (2007). Regional Variability in
Relationships between Climate and Dengue/DHF in Indonesia. Singaporean
Journal of Tropical Geography, 28 (3), 251-272.
4. Barbazan, P., Guiserix, M. Boonyuan, W., Tuntaprasart, W., Pontier, D. and
Gonzalez, J.P. (2010). Modelling the effect of temperature on transmission of
dengue. Med. Vet.Entomol, 24, 66-73.
5. Brunkard, J.M., Cifuentes, E. and Rothenberg, S.J. (2008). Assessing the role of
temperature, precipitation and ENSO in dengue re-emergence on the Texas –
Mexico border region. Salud Pública de México, 50, 227-34.
6. Chan, Y.C., Salahuddin, N.I., Khan, J., Tan, H.C., Seah, C.L. and Li, J. (1994). Dengue haemorrhagic fever outbreak in Karachi, Pakistan. Trans R Soc Trop Med Hyg, 89, 619–20.
7. Chowell, G. and Stinchez, F. (2006). Climate-Based Descriptive Models of
Dengue Fever: The 2002 Epidemic in Colima, Mexico. Journal of Environmental
Health, 41-44.
8. David, L. (2011). Linear algebra and its applications. Addison-Wesley. New York.
9. Edwards, J.J. (1991). A users guide to Principal Components. Wiley series in Probability and Mathematical Statistics.
10. Farrar, J., Focks, D., Gubler, D., Barrera, R., Guzman, M.G., Simmons, C., et al. (2007). Towards a global dengue research agenda. Trop Med Int Health, 12, 695-9.
11. Gubler, D.J. and Kuno, G. (1997). Dengue and dengue hemorrhagic fever New York, NY: CAB International.
12. Hakim, S.T., Saleem, M. and Nadeem, S.G. (2011). An Experience with Dengue
Pak.j.stat.oper.res. Vol.X No.2 2014 pp247-256
256
13. Hii, Y.L., Rocklo¨v, J., Ng, N., Tang, C.S, and Pang, F.Y., et al. (2009). Climate
variability and increase in incidence and magnitude of dengue incidence in
Singapore. Global Health Action 2.
14. Humayoun, M.A., Waseem, T., Jawa, A.A., Hashmi, M.S. and Akram, J. (2010).
Multiple dengue serotypes and high frequency of dengue hemorrhagic fever at two tertiary care hospitals in Lahore during the 2008 dengue virus outbreak in Punjab, Pakistan. Int J Infect Dis, 14S3, e54-e59.
15. Jahan, F. (2011). Dengue Fever (DF) in Pakistan. Asia Pac Fam Med, 10(1), 1.
16. Johansson M.A, Dominici F. and Glass G.E. (2009). Local and Global Effects of
Climate on Dengue Transmission in Puerto Rico, PLoS Negl Trop Dis. 3(2).
World Academy of Science, Engineering and Technology, 38, 2010 908.
17. Kuhn, K., Campbell-Lendrum, D., Haines, A. and Cox, J. (2005). Using climate
to predict infectious disease epidemics. Geneva: World Health Organization. 18. pakistan-economic-survey-2012-2013.
19. Reiter, P. (2001). Climate change and mosquito-borne disease. Environmental
Health Prospectives, 109, 141-61.
20. Siddiqui, F.J., Haider, S.R. and Bhutta, Z.A. (2009). Endemic Dengue Fever: a seldom recognized hazard for Pakistani children. J Infect Dev Ctries, 3(4), 306-12.
21. Su, G.L. (2008). Correlation of climatic factors and dengue incidence in Metro
Manila, Philippines. Ambio, 37, 292-4.
22. Weaver, S.C. and Vasilakis, N. (2009). Molecular evolution of dengue viruses: contributions of phylogenetics to understanding the history and epidemiology of the preeminent arboviral disease. Infect Genet Evol 9, 523–540.
23. Will, T. (1999). Introduction to the singular value Decomposition. Davidson College. www.Davidson.edu/academic/math/will/svd/index.html.
24. Wiwanitkit, V. (2006). An observation on correlation between rainfall and the
prevalence of clinical cases of dengue in Thailand. J Vector Borne Dis, 43(2),
73- 76.
25. A tutorial on Principal component analysis by Jonathon Shlens 1-13.
26. www.news-medical.net/health/Dengue-Fever.aspx
27. www.cdc.gov/dengue/entomology Ecology/climate.html.