The Cryosphere, 6, 517–531, 2012 www.the-cryosphere.net/6/517/2012/ doi:10.5194/tc-6-517-2012
© Author(s) 2012. CC Attribution 3.0 License.
The Cryosphere
Influence of surface and subsurface heterogeneity on observed
borehole temperatures at a mountain permafrost site in the Upper
Engadine, Swiss Alps
S. Schneider, M. Hoelzle, and C. Hauck
Alpine Cryosphere and Geomorphology (ACAG), Department of Geosciences, University of Fribourg, Switzerland Correspondence to: S. Schneider (sina.schneider@unifr.ch)
Received: 7 September 2011 – Published in The Cryosphere Discuss.: 11 October 2011 Revised: 7 March 2012 – Accepted: 22 March 2012 – Published: 19 April 2012
Abstract. Compared to lowland (polar) regions, permafrost in high mountain areas occurs in a large variety of surface and subsurface materials and textures. This work presents an eight-year (2002–2010) data set of borehole temperatures for five different (sub-) surface materials from a high alpine permafrost area, Murt`el-Corvatsch, Switzerland. The influ-ence of the material on the thermal regime was investigated by borehole temperature data, the temperature at the top of the permafrost (TTOP-concept) and the apparent thermal dif-fusivity (ATD). The results show that during the last eight years, material-specific temperature changes were more sig-nificant than climate-induced temperature trends. At coarse blocky, ice-rich sites, no changes in active layer depth were observed, whereas the bedrock and the fine-grained sites ap-pear to be highly sensitive to changes in the microclimate. The results confirm that the presence and growth of ice as well as a thermally driven air circulation within the subsur-face are the key factors for the occurence and preservation of alpine permafrost.
1 Introduction
1.1 General setting
Since work on high altitude permafrost distribution started in the 1970s (Barsch, 1977; Haeberli et al., 1988), one of the challenging problems is the heterogeneity of mountain permafrost in terms of its microclimate, snow cover and sub-surface material, which makes a direct comparison of dif-ferent permafrost sites almost impossible. If this hetero-geneity and its influence on the thermal regime of the
mafrost is known, the accuracy of spatially distributed per-mafrost models based on topoclimatic factors could be veri-fied. In this contribution, eight-year time series of seasonal and inter-annual borehole temperature variability within a small (1 km2) high mountain permafrost region with different surface and subsurface materials is presented. Local climatic factors (such as air temperature, wind speed and direction, relative humidity and incoming solar radiation) as well as the topographic situation (exposition, slope angle) are assumed to be the same for all boreholes. Hence, observed differ-ences in subsurface temperatures are mostly due to the dif-ferent subsurface materials and their corresponding material-dependent, dominant processes. Since the aim of this work is to understand the different processes occuring in high moun-tain permafrost and to estimate the different sensitivities to changes in the microclimate, this work is focused on (1) the characterisation of the thermal regimes for different materials based on borehole temperature data from 2002–2010, (2) an analysis of the relationship between air temperature and sub-surface temperature by using the extended TTOP concept, and (3) an evaluation of the thermal response of the different subsurface materials by calculating the temperature transfer rate and the apparent thermal diffusivity.
1.2 Research context
518 S. Schneider et al.: Influence of subsurface heterogeneity on observed borehole temperatures
covered by coarse or fine material and no snow is present, the thermal regime of the ground is directly coupled with the atmosphere (Williams and Smith, 1989), and the heat will mainly be transferred by conduction and advection of melt-water (Wegmann et al., 1998; Gruber and Haeberli, 2007; Krautblatter and Hauck, 2007).
In addition to temperature rise and phase changes of ice to water, permafrost degradation in bedrock is influenced by frost weathering leading to a reduction of rock strength (Har-ris et al., 2009) as well as by advective process by perco-lating meltwater. The degradation by advection can desta-bilize much greater volumes of rock than conduction within the same time (Gruber and Haeberli, 2007). Air-ventilation within clefts can cause a lowering of the temperature of about 1.5◦C within strongly fractured, near-vertical bedrock (Hasler et al., 2011). If the bedrock is covered by vegetation and soil, the thermal response of the active layer to surface temperatures will be damped. Moss and organic matter af-fect the hydrological properties, as they increase the water holding capacity of the soil (Walker et al., 2003).
If a buffer layer of coarse blocky material is present, den-sity differences and processes like wind pumping lead to an exchange of air masses within the ground and enhance convective and advective air flows (Hanson and Hoelzle, 2004; Panz, 2006). Gruber and Hoelzle (2008) assume that a porosity of 40 % can reduce the thermal conductivity by about an order of magnitude compared to bedrock. One of the best known phenomenon within coarse blocky mate-rial is the cooling effect of reversible air circulation, which is called “balch-effect” (Balch, 1900; Harris and Pedersen, 1998) within flat areas and “chimney-effect” within slopes (described e.g. in Wakonigg, 1996; Harris and Pedersen, 1998; Sawada et al., 2003; Delaloye et al., 2003). In general, it is assumed that the chimney-effect can only develop under thin, non-insulating snow cover conditions. In contrast, De-laloye and Lambiel (2005) and Morard et al. (2008) showed that even in the presence of a thick snow cover, the ascent of relatively warm air within a blocky slope can force the as-piration of cold air through the snow cover into the blocks, reducing the temperature of the lower part of the slope. This thermally driven ventilation can lead to a cooling of the sub-surface by several degrees.
A fine-grained buffer layer with a highly permeable tex-ture supports the advective heat transport by infiltrating (snowmelt-) water. Hinkel and Outcalt (1994) suppose that the warming of fine-grained permafrost material in arctic lowlands by advective processes exceeds those by conduc-tion by one or two orders of magnitude. The gravity infiltra-tion of meltwater may be enhanced by the transport of water and vapour in response to osmotic pressure gradients induced by relatively higher solute concentration at depth (Hinkel and Outcalt, 1994; Outcalt et al., 1990). Modelling the infiltra-tion processes, Scherler et al. (2010) pointed out that the heat transport by percolating water is not negligible and seems to be a key factor to increase the temperature of the permafrost.
The snow cover as an additional seasonal buffer layer in-fluences the thermal regime of the subsurface, mainly as the thermal resistance of the snow cover increases with increas-ing snow depth. Haeberli (1973), Keller and Gubler (1993), Hanson and Hoelzle (2004) observed in field studies and Luetschg et al. (2008) in a model study that effective thermal resistance exists at a snow depth of more than 0.6–0.8 m. For constant air temperatures, an increase of snow depth by 1 m (starting with a 0.2 m, non-insulating snow cover) can lead to an increase of the mean annual ground surface temperature (MAGST) by approximately 2.7◦C (Luetschg et al., 2008). Gruber and Hoelzle (2008) pointed out that coarse blocky material can reduce the warming effect of the snow cover up to several degrees celsius due to the lower thermal conductiv-ity close to the surface of the blocky layer. Furthermore, the duration and date of the first significant snowfall in autumn, and the date of the disappearance of snow in spring, are im-portant factors in terms of the thermal regime of the entire year. In model experiments, Luetschg et al. (2008) showed that the longer the time span of a non-insultating snow cover, the colder the thermal regime of the entire year. Hereby, the cooling caused by delayed snowfall in autumn is within the same order of magnitude as the effect of delayed snowmelt in spring (Ling and Zhang, 2003; Luetschg et al., 2008).
2 Investigation site and data sets
The study area is situated in the Upper Engadin (Eastern Swiss Alps) at around 2700 m a.s.l. and is surrounded by a steep northwest facing rock wall (Fig. 1). Taking into ac-count that the investigation of this area started in the 1970s (Barsch, 1977), it is now one of the best investigated per-mafrost areas in the Alps and part of the PERMOS network (Permafrost Monitoring Switzerland) (e.g. Haeberli et al., 1988; Hoelzle et al., 2002; Hanson and Hoelzle, 2005; PER-MOS, 2010). Within the area, the Murt`el rock glacier is one of the dominant periglacial features, but further rock glaciers and talus slopes are present to the west (Fig. 2). The bore-hole network consists of a 58 m deep borebore-hole drilled on the rock glacier Murt`el in 1987 (Haeberli et al., 1988), two bore-holes drilled in 2002 on the nearby Chastelets rock glacier and three boreholes located in between (Hanson and Hoel-zle, 2005). Though the climatic parameters can be assumed to be similar for all borehole sites, there is a strong variation in snow cover duration, snow depth as well as the subsurface material and ice content in which the boreholes are drilled. 2.1 Air temperature measurements and snow height
A micrometeorological station located at the Murt`el rock glacier measures air temperature, wind speed and direction, humidity, in- and outgoing longwave radiation, in- and out-going shortwave radiation and the height of the snow cover since January 1997 (Mittaz et al., 2000). Data were recorded
S. Schneider et al.: Influence of subsurface heterogeneity on observed borehole temperaturesS. Schneider et al.: Influence of surface heterogeneity on observed borehole temperatures, Swiss Alps 3 519
Fig. 1.Investigation area Murt`el-Corvatsch, Eastern Swiss Alps. The 5 shallow boreholes are indicated by its material: Bb = bare bedrock, Bv = vegetated bedrock, TSc = talus slope (coarse blocky), RCf = rock glacier Chastelets (fine-grained), RCc = rock glacier Chastelets (coarse blocky) and RMc rock glacier Murt`el (coarse blocky)
2.2 Ground surface and subsurface temperature mea-surements
A temperature sensor placed at the surface next to each borehole (Hanson and Hoelzle (2005)) was used to obtain the GST for each borehole separately.
175
Subsurface temperatures were measured by temperature sensors which are placed within the six boreholes (fig.2). The borehole at the Murt`el rock glacier (RMc) was drilled in coarse blocky material. Thermistors were placed down to 58m depth, starting at 0.5 m and seperated by 1 m. The 180
five boreholes which were drilled by Hanson and Hoelzle (2005) are each 6 m deep and equipped with 18 thermistors placed every 10 cm within the uppermost meter, every 0.5 m from 1 to 5 m and at 6 m depth. Two of these boreholes were drilled in bedrock (one on bare bedrock (Bb), the other 185
one is covered by 19 cm of soil and vegetation (Bv)), one is situated on a coarse blocky talus slope (TSc), one was drilled in the fine-grained material of the Chastelets rock
glacier close to its front (RCf) and the last one is located in the coarse blocky part of the Chastelets rock glacier (RCc) 190
(fig.2).
3 Data processing
As a means to analyse the relative influence of different subsurface materials on the thermal regime, the relationship 195
between air temperature and subsurface permafrost temper-ature can be estimated by using the extended TTOP-concept (Smith and Riseborough (1996), Herz et al. (2003), Hoelzle and Gruber (2008)). The TTOP-concept was developed to explain the climate-permafrost relationship and describes 200
the offset between the mean annual air temperature (MAAT) and the temperature at the top of the permafrost (TTOP) (Smith and Riseborough (1996)). To take into account the surface heterogeneity in mountain areas, the MAGST Fig. 1. Investigation area Murt`el-Corvatsch, Eastern Swiss Alps. The 5 shallow boreholes are indicated by its material: Bb = bare bedrock, Bv = vegetated bedrock, TSc = talus slope (coarse blocky), RCf = rock glacier Chastelets (fine-grained), RCc = rock glacier Chastelets (coarse blocky) and RMc rock glacier Murt`el (coarse blocky).
every 10 min and logged as means over 30 min intervals. Since 2010 the data have been stored at hourly intervals. From 1988 until 2006, the mean annual air temperature (MAAT) was−1.8◦C and the avarage height of snow was 0.41 m (Hoelzle and Gruber, 2008). During the snow covered period, the ground surface temperature (GST) is estimated by an IR-thermometer, which was added to the micrometeoro-logical station in 2001 (Hoelzle and Gruber, 2008). The mi-crometeorological measurements at Murt`el rock glacier were considered to be representative for the whole study area. However, to estimate the exact duration of the snow cover at each borehole site, GST measurements were used, as the threshold of the daily temperature amplitude of 0.4◦C indi-cates whether snow is present (≤0.4◦C) or not (≥0.4◦C). The height of the snow cover was either measured by the micrometeorological station (for RMc) or estimated by tem-perature loggers (i-buttons, Lewkowicz, 2008), placed at dif-ferent depths on a snowpole next to the boreholes (for Bv, Bb and RCf).
2.2 Ground surface and subsurface temperature mea-surements
A temperature sensor placed at the surface next to each bore-hole (Hanson and Hoelzle, 2005) was used to obtain the GST for each borehole separately.
520 4 S. Schneider et al.: Influence of subsurface heterogeneity on observed borehole temperaturesS. Schneider et al.: Influence of surface heterogeneity on observed borehole temperatures, Swiss Alps
Fig. 2.Photographs of the different surfaces at the borehole locations in the investigation area, taken in summer 2009
was added. The total offset between the air temperature 205
and the temperature of the permafrost is expressed by an offset between MAAT and MAGST and an offset between MAGST and TTOP. Hoelzle and Gruber (2008) recommend to include a third temperature value, the mean annual surface temperature (MAST), which is the thermal infrared radiating 210
temperature of the ground surface, measured by an IR ther-mometer. Therefore, the surface offset has to be partitioned into the offset between MAAT and MAST, and another between MAST and MAGST. This concept is particularly important for mountain permafrost environments, because 215
the duration and the height of snow cover as well as its influ-ence on the surface temperature can be taken into account. To simplify the comparison of the temperature data within the different sites, a low-pass Gaussian filter was applied to the air temperature and the ground surface temperature. As it 220
reduces high- frequency variations along the time series, this filter allows to identify temporal variations and trends. For annual subsurface temperatures below 2m depth a 365-day moving-average was applied.
225
Data processing is done individually for each season ac-cording to Delaloye (2004), Hanson and Hoelzle (2004). As the seasonally varying micro-climatic parameters such as snow cover and infiltrating melt water can be site specific, it is important to adapt the seasons separately for each site, 230
according to the dominant processes and not solely with re-spect to a fixed date. Phase 1-2 is defined by temperatures below 0◦C but without the existence of an insulating snow cover. The phase 3 is characterized by a snow cover, which is thick enough to decouple the air temperature from the GST. 235
Phase 4 is characterized by the impact of the melt water lead-Fig. 2. Photographs of the different surfaces at the borehole locations in the investigation area, taken in summer 2009.
3 Data processing
As a means to analyse the relative influence of different sub-surface materials on the thermal regime, the relationship be-tween air temperature and subsurface permafrost tempera-ture can be estimated by using the extended TTOP-concept (Smith and Riseborough, 1996; Herz et al., 2003; Hoelzle and Gruber, 2008). The TTOP-concept was developed to ex-plain the climate–permafrost relationship and describes the offset between the mean annual air temperature (MAAT) and the temperature at the top of the permafrost (TTOP) (Smith and Riseborough, 1996). To take into account the surface heterogeneity in mountain areas, the MAGST was added. The total offset between the air temperature and the temper-ature of the permafrost is expressed by an offset between MAAT and MAGST and an offset between MAGST and TTOP. Hoelzle and Gruber (2008) recommend to include a third temperature value, the mean annual surface tempera-ture (MAST), which is the thermal infrared radiating temper-ature of the ground surface, measured by an IR thermome-ter. Therefore, the surface offset has to be partitioned into
the offset between MAAT and MAST, and another between MAST and MAGST. This concept is particularly important for mountain permafrost environments, because the duration and the height of snow cover as well as its influence on the surface temperature can be taken into account. To simplify the comparison of the temperature data within the different sites, a low-pass Gaussian filter was applied to the air temper-ature and the ground surface tempertemper-ature. As it reduces high-frequency variations along the time series, this filter allows to identify temporal variations and trends. For annual sub-surface temperatures below 2 m depth, a 365-day moving-average was applied.
Data processing is done individually for each season ac-cording to Delaloye (2004), Hanson and Hoelzle (2004). As the seasonally varying microclimatic parameters such as snow cover and infiltrating meltwater can be site specific, it is important to adapt the seasons separately for each site, ac-cording to the dominant processes and not solely with re-spect to a fixed date. Phases 1–2 are defined by temperatures below 0◦C but without the existence of an insulating snow cover. Phase 3 is characterized by a snow cover, which is
S. Schneider et al.: Influence of subsurface heterogeneity on observed borehole temperatures 521
thick enough to decouple the air temperature from the GST. Phase 4 is characterized by the impact of the meltwater lead-ing to the zero curtain (i.e. maintainlead-ing temperatures near 0◦C for a considerable length of time due to the release of latent heat); whereas phase 5 is defined as the time between the end of the spring zero curtain and the first time in autumn when the surface temperature drops below 0◦C. The thresh-olds used to determine the phases in this study are shown in Table 1.
To estimate the thermal response of the different subsur-face materials, a cumulative freezing/thawing temperature gradient (CFTG/CTTG), the apparent thermal diffusivity and the temperature transfer rate, was calculated for all sites for the period between 2003–2010. The cumulative freezing temperature gradient quantifies the amount of freezing in K per day and was estimated by the division of the cumula-tive freezing degree days (K) by the amount of freezing days (d−1) during the annual cooling period (see above Phases 1– 2). The cumulative thawing temperature gradient (CTTG) was calculated in the same manner but for Phase 5.
The thermal diffusivity describes how fast a material can change its temperature. It is expressed by the ratio of ther-mal conductivity to heat capacity. Its variations can be inter-preted in terms of phase changes in the subsurface. In un-frozen material, increasing water content leads to an increase of the thermal diffusivity, which is due to a more rapid in-crease of conductivity than of heat capacity (Williams and Smith, 1989). Pogliotti et al. (2008) pointed out that the key factor of the ATD is the water content. In frozen materials, especially within the temperature range from 0 to−3◦C, the diffusivity is highly temperature dependent and is dominated by the heat capacity term (Williams and Smith, 1989). Note that estimating the thermal diffusivity by borehole tempera-ture data includes the effect of non-conductive heat transfer including water vapour transport and release of latent heat (apparent thermal diffusivity). Assuming that the temper-ature pattern can be described by an elementary sinusoidal function, the ATD was calculated by the yearly temperature amplitude according to Williams and Smith (1989) by
k= ω (z1−z2) 2
2hlnA1
A2
i2, (1)
wherekis the thermal diffusivity [m2s−1],ωthe signal fre-quency [s−1] andA1 andA2 are the temperature amplitudes [K] at the depthsz1andz2[m].
The temperature transfer rate (TR) describes the tempera-ture change within the active layer with time by
TR=
1T 1t
(z1−z2), (2)
with:
1T =TMax1−TMax2; (3)
Table 1. Thresholds to differentiate the yearly phases individually at each borehole.
Threshold 1–2 3 4 5
Daily mean air <0◦C <0◦C ≥0◦C ≥0◦C temperature
Daily amplitude ≥0.4◦C ≤0.4◦C =0◦C ≥0.4◦C of GST
Snow height (d) 0< d≤30 cm >30 cm – –
1t=tTMax1−tTMax2. (4)
The temperature change with depth (1T [K]) is expressed as the temperature difference between the annual maximum temperature at depth 1 (TMax1) and depth 2 (TMax2), where z1=0.5 m, z2= active layer depth [m], and1t is the time interval [d] betweenTMax1andTMax2.
4 Results
4.1 Eight years of active layer observation at the Murt`el-Corvatsch area
The evolution of the subsurface temperature is shown for all six boreholes from 2002 until 2010 (Fig. reffig:temp8years). At all sites minimum winter temperatures were observed in 2004/2005 and 2005/2006. In summer the bedrock sites (Fig. 3a and b) are unfrozen down to 6 m depth. During win-ter 2008/2009 and 2009/2010, the Bb site (Fig. 3a) did not freeze at all below 5 m depth. Seasonal temperature fluctua-tions at the surface of Bb are within a range of−13 to 25◦C. Figure 3c shows the observed temperature evolution of the borehole drilled in the talus slope (TSc). The borehole is only 25 m away from the bedrock sites but it shows a completely different temperature regime: (1) permanently frozen condi-tions below 5 m, (2) a smaller seasonal temperature variation, and (3) a variable active layer.
The rock glacier sites experience during winter the low-est temperatures within the permafrost body compared to the other sites. Seasonal temperature fluctuations at the surface are within a range of−15 until 28◦C (Fig. 3d, e) and there-fore similar to those of the bedrock sites.
Figure 3d presents the temperature of the borehole, which is located at the front of the Chastelets rock glacier (RCf) and which is drilled in fine-grained material. Since 2009, no more permafrost was observed within the uppermost 6 m. The thermal regime shows a similar pattern as that at the TSc site (Fig. 3c), but summer temperatures at the surface are lower.
522 6 S. Schneider et al.: Influence of subsurface heterogeneity on observed borehole temperaturesS. Schneider et al.: Influence of surface heterogeneity on observed borehole temperatures, Swiss Alps
Fig. 3. Monthly mean air temperature, snow height and borehole temperature data from 2002-2010. Air temperature and snow height are measured by the micrometeorological station at the Murt`el rock glacier
Fig. 3. Monthly mean air temperature, snow height and borehole temperature data from 2002–2010. Air temperature and snow height are measured by the micrometeorological station at the Murt`el rock glacier.
S. Schneider et al.: Influence of subsurface heterogeneity on observed borehole temperatures 523
S. Schneider et al.: Influence of surface heterogeneity on observed borehole temperatures, Swiss Alps 7
Fig. 4. Filtered temperatures from 2002-2010 for all sites and different depths, a) air temperature and ground surface temperature, b) subsurface temperature at -2.5m and c) subsurface temperature at -5m. For the air temperature and ground surface temperature a low-pass Gaussian filter was applied (a), and for the subsurface temperatures (b) and (c) a 365-day moving-average was used. Data gaps are due to technical problems with the data logger.
below show significant trends between 2002-2010. At all sites from 2004 until 2006 a slight temperature reduction of
about 1◦C is recognizable at 2.5 m and 5 m depth (fig. 4
b,c). From 2008 until 2009 a temperature increase of about 1
◦C is visible for RMc, and of about 0.5◦C for the other sites
330
but interrupted by the data gap. The temperature difference between GST and air temperature is much lower for a site with less snow (maximal 0.5 m) than for a site with a snow cover of more than 1 m (fig. 5).
Regarding the annual change of active layer depth (fig.6)
335
from 2003 to 2010, two patterns can be distinguished: a) the RCf and the TSc site, which show a high inter-annual variability and b) the coarse blocky rock glacier sites (RCc and RMc), at which the active layer depth remains constant each year. For TSc a range of 3.5 - 5.5 m is remarkable, and
340
for RCf the active layer depth varies between 4 - 6 m. The year 2005 shows the shallowest active layer depth whereas during the years 2003 and 2009 the depth was up to 6 m at the RCf and 5.5 m at the TSc site. The active layer depth of the rock glacier sites never exceeds 3 m (RCc) respectively
345
3.5 m (RMc).
4.2 Influence of the subsurface material on the ground thermal regime
Though all sites are influenced by the same meteorological input values, a high variation of the surface and subsurface
350
temperatures was observed. Mean winter air temperature
(defined according to Table 1) is -6.5◦C and mean summer
air temperature is 5.2 ◦C, whereas GST differs from -4.9
(RMc) to -2.2 ◦C (TSc) in winter and from 5.7 (TSc) to
Fig. 4. Filtered temperatures from 2002–2010 for all sites and different depths: (a) air temperature and ground surface temperature, (b) sub-surface temperature at−2.5 m, and (c) subsurface temperature at−5 m. For the air temperature and ground surface temperature, a low-pass Gaussian filter was applied (a), and for the subsurface temperatures (b) and (c) a 365-day moving-average was used. Data gaps are due to technical problems with the data logger.
below show significant trends between 2002–2010. At all sites from 2004 until 2006, a slight temperature reduction of about 1◦C is recognizable at 2.5 m and 5 m depth (Fig. 4b, c). From 2008 until 2009, a temperature increase of about 1◦C is visible for RMc, and of about 0.5◦C for the other sites but interrupted by the data gap. The temperature difference be-tween GST and air temperature is much lower for a site with less snow (maximal 0.5 m) than for a site with a snow cover of more than 1 m (Fig. 5).
Regarding the annual change of active layer depth (Fig. 6) from 2003 to 2010, two patterns can be distinguished: (a) the RCf and the TSc site, which show a high inter-annual vari-ability, and (b) the coarse blocky rock glacier sites (RCc and RMc), at which the active layer depth remains constant each year. For TSc a range of 3.5–5.5 m is remarkable, and for RCf the active layer depth varies between 4–6 m. The year
2005 shows the shallowest active layer depth, whereas dur-ing the years 2003 and 2009, the depth was up to 6 m at the RCf and 5.5 m at the TSc site. The active layer depth of the course blocky rock glacier sites never exceeds 3 m (RCc) and 3.5 m (RMc), respectively.
4.2 Influence of the subsurface material on the ground thermal regime
524 S. Schneider et al.: Influence of subsurface heterogeneity on observed borehole temperatures 8 S. Schneider et al.: Influence of surface heterogeneity on observed borehole temperatures, Swiss Alps
Fig. 5. Temperature differences between ground surface tempera-ture and air temperatempera-ture for a site with a maximum snow cover of 1m and a site with a thin snow cover of around 0.5 m.
Fig. 6. Active layer depth of the last eight years for the boreholes with permafrost.
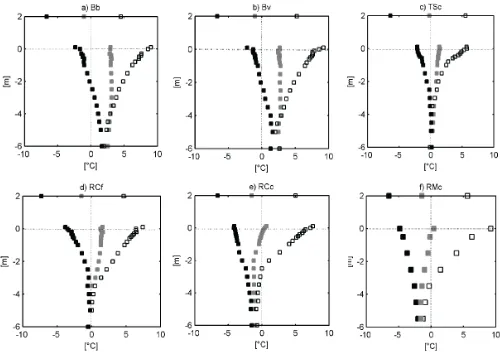
9.2 ◦C (Bv) in summer. Comparing all sites, it becomes
355
apparent that the bedrock sites (fig.7a and fig.7b) experi-ence an almost linear temperature decrease with depth in summer (respectively increase in winter). At both sites the mean annual temperature is higher than the mean summer temperature below 4 m depth, which is due to the phase
360
lag by depth and to the different time intervals of the mean summer and mean annual temperature. The TSc site (fig.7c) shows a large temperature gradient within the first meter and a smaller gradient from 1 - 6m depth. Below 3.5 m, the eight-year mean temperatures are around 0 ◦C throughout
365
the year. All rock glacier sites (fig.7d-f) show a splitted temperature profile, including an upper part (active layer) with a high temperature gradient and the permanently frozen part below with almost homogeneous temperatures. At the RCc and RMc sites (fig.7e and fig.7f) the temperature within
370
the permafrost body varies between -2.3 (winter mean) and
-0.5◦C (summer mean). The temperature of the rock glacier front (RCf fig.7d) remains always around 0◦C.
To analyse the seasonal influence of the surface and
375
subsurface material, cumulative degree days (CDD) were calculated and shown in fig.8. Starting at the first of October of each year the daily mean temperatures were summed up for one year and presented as a four-year mean. Cumulative degree days give evidence about the yearly balance of a
380
thermal regime. In permafrost, the CDD should be negative over the course of one year, and for positive CDD, seasonal frost can be assumed. Fig. 8a presents CDD of the surface of different materials and of the air temperature at 2 m height. Even though the cumulative mean air temperature is clearly
385
negative, all sites apart from RMc show positive CDD at the surface (0 m). The largest cumulative temperature difference is between the air temperature and the temperature of the bedrock site Bv (1626 K). At all sites the CDD within the thaw layer increase much faster during summer than the
390
temperatures are decreasing in winter (fig.8b). Hence, the thermal permafrost regime remains stable, if the higher num-ber of freezing degree days compensates the faster increase of summer temperatures. This is only observed at the rock glacier sites, which show a clear negative temperature trend
395
at a depth of 2.5 m. The TSc and the RCf sites are close to 0 K, which is mainly caused by a much smaller temperature decrease in winter (fig.8b). Comparing the two boreholes of the Chastelets rock glacier (RCc and RCf), CDD for RCf are 792 K higher than for RCc. Although the temperature
400
increase during summer is the same, RCf experiences less cooling during winter.
Presenting cumulative degree days at 5 m depth in fig.8c, permafrost and seasonal frost regimes can be differentiated.
405
The only sites with a stable permafrost regime are the coarse blocky rock glaciers (RMc and RCc). The TSc and the RCf site have an intermediate regime close to 0 K.
By comparing the bare and the vegetated bedrock sites
410
(fig.9a,b), the Bv site shows 50 K higher cumulative degree days, but a smaller amount of freezing degree days (126 K) and a smaller amount of thawing degree days (77 K) than Bb. Although the borehole is only covered by 19 cm of soil and vegetation, this effect has an impact on the thermal
415
regime down to>1m depth (fig.9c)
The differences of the snow cover (duration and height) as well as the yearly freezing and thawing periods are listed in detail for the uppermost sensors at each borehole in
ta-420
ble 2. In winter 2010/2011 the variation of the height of the snow cover was between 1.57 m (RMc), 1.4 m (Bv) and 0.5 m (RCf). The interannual variation of the snow cover height at the RMc site is between 0.57 m (2006/2007) and 1.83 m (2008/2009) (see as well fig.3). The mean duration of the
425
snow cover varies from 167 days (RCf) to 205 days (RCc).
Fig. 5. Temperature differences between ground surface tempera-ture and air temperatempera-ture for a site with a maximum snow cover of 1 m and a site with a thin snow cover of around 0.5 m.
almost linear temperature decrease with depth in summer (re-spectively increase in winter). At both sites the mean annual temperature is higher than the mean summer temperature be-low 4 m depth, which is due to the phase lag by depth and to the different time intervals of the mean summer and mean annual temperature. The TSc site (Fig. 7c) shows a large tem-perature gradient within the first meter and a smaller gradient from 1–6 m depth. Below 3.5 m, the eight-year mean temper-atures are around 0◦C throughout the year. All rock glacier sites (Fig. 7d–f) show a split temperature profile, including an upper part (active layer) with a high temperature gradient and the permanently frozen part below with almost homo-geneous temperatures. At the RCc and RMc sites (Fig. 7e and f), the temperature within the permafrost body varies be-tween−2.3 (winter mean) and−0.5◦C (summer mean). The temperature of the rock glacier front (RCf Fig. 7d) remains always around 0◦C.
To analyse the seasonal influence of the surface and sub-surface material, cumulative degree days (CDD) were calcu-lated and shown in Fig. 8. Starting at the first of October of each year, the daily mean temperatures were summed up for one year and presented as a four-year mean. Cumula-tive degree days give evidence about the yearly balance of a thermal regime. In permafrost, the CDD should be negative over the course of one year, and for positive CDD, seasonal frost can be assumed. Figure 8a presents CDD of the sur-face of different materials and of the air temperature at 2 m height. Even though the cumulative mean air temperature is clearly negative, all sites apart from RMc show positive CDD at the surface (0 m). The largest cumulative temperature dif-ference is between the air temperature and the temperature of the bedrock site Bv (1626 K). At all sites the CDD within the thaw layer increase much faster during summer than the
8 S. Schneider et al.: Influence of surface heterogeneity on observed borehole temperatures, Swiss Alps
Fig. 5. Temperature differences between ground surface tempera-ture and air temperatempera-ture for a site with a maximum snow cover of 1m and a site with a thin snow cover of around 0.5 m.
Fig. 6. Active layer depth of the last eight years for the boreholes with permafrost.
9.2 ◦C (Bv) in summer. Comparing all sites, it becomes
355
apparent that the bedrock sites (fig.7a and fig.7b) experi-ence an almost linear temperature decrease with depth in summer (respectively increase in winter). At both sites the mean annual temperature is higher than the mean summer temperature below 4 m depth, which is due to the phase
360
lag by depth and to the different time intervals of the mean summer and mean annual temperature. The TSc site (fig.7c) shows a large temperature gradient within the first meter and a smaller gradient from 1 - 6m depth. Below 3.5 m, the eight-year mean temperatures are around 0 ◦C throughout
365
the year. All rock glacier sites (fig.7d-f) show a splitted temperature profile, including an upper part (active layer) with a high temperature gradient and the permanently frozen part below with almost homogeneous temperatures. At the RCc and RMc sites (fig.7e and fig.7f) the temperature within
370
the permafrost body varies between -2.3 (winter mean) and
-0.5◦C (summer mean). The temperature of the rock glacier front (RCf fig.7d) remains always around 0◦C.
To analyse the seasonal influence of the surface and
375
subsurface material, cumulative degree days (CDD) were calculated and shown in fig.8. Starting at the first of October of each year the daily mean temperatures were summed up for one year and presented as a four-year mean. Cumulative degree days give evidence about the yearly balance of a
380
thermal regime. In permafrost, the CDD should be negative over the course of one year, and for positive CDD, seasonal frost can be assumed. Fig. 8a presents CDD of the surface of different materials and of the air temperature at 2 m height. Even though the cumulative mean air temperature is clearly
385
negative, all sites apart from RMc show positive CDD at the surface (0 m). The largest cumulative temperature difference is between the air temperature and the temperature of the bedrock site Bv (1626 K). At all sites the CDD within the thaw layer increase much faster during summer than the
390
temperatures are decreasing in winter (fig.8b). Hence, the thermal permafrost regime remains stable, if the higher num-ber of freezing degree days compensates the faster increase of summer temperatures. This is only observed at the rock glacier sites, which show a clear negative temperature trend
395
at a depth of 2.5 m. The TSc and the RCf sites are close to 0 K, which is mainly caused by a much smaller temperature decrease in winter (fig.8b). Comparing the two boreholes of the Chastelets rock glacier (RCc and RCf), CDD for RCf are 792 K higher than for RCc. Although the temperature
400
increase during summer is the same, RCf experiences less cooling during winter.
Presenting cumulative degree days at 5 m depth in fig.8c, permafrost and seasonal frost regimes can be differentiated.
405
The only sites with a stable permafrost regime are the coarse blocky rock glaciers (RMc and RCc). The TSc and the RCf site have an intermediate regime close to 0 K.
By comparing the bare and the vegetated bedrock sites
410
(fig.9a,b), the Bv site shows 50 K higher cumulative degree days, but a smaller amount of freezing degree days (126 K) and a smaller amount of thawing degree days (77 K) than Bb. Although the borehole is only covered by 19 cm of soil and vegetation, this effect has an impact on the thermal
415
regime down to>1m depth (fig.9c)
The differences of the snow cover (duration and height) as well as the yearly freezing and thawing periods are listed in detail for the uppermost sensors at each borehole in
ta-420
ble 2. In winter 2010/2011 the variation of the height of the snow cover was between 1.57 m (RMc), 1.4 m (Bv) and 0.5 m (RCf). The interannual variation of the snow cover height at the RMc site is between 0.57 m (2006/2007) and 1.83 m (2008/2009) (see as well fig.3). The mean duration of the
425
snow cover varies from 167 days (RCf) to 205 days (RCc).
Fig. 6. Active layer depth of the last eight years for the boreholes with permafrost.
temperatures are decreasing in winter (Fig. 8b). Hence, the thermal permafrost regime remains stable if the higher num-ber of freezing degree days compensates the faster increase of summer temperatures. This is only observed at the rock glacier sites, which show a clear negative temperature trend at a depth of 2.5 m. The TSc and the RCf sites are close to 0 K, which is mainly caused by a much smaller temperature decrease in winter (Fig. 8b). Comparing the two boreholes of the Chastelets rock glacier (RCc and RCf), CDD for RCf are 792 K higher than for RCc. Although the temperature increase during summer is the same, RCf experiences less cooling during winter.
Presenting cumulative degree days at 5 m depth in Fig. 8c, permafrost and seasonal frost regimes can be differentiated. The only sites with a stable permafrost regime are the coarse blocky rock glaciers (RMc and RCc). The TSc and the RCf sites have an intermediate regime close to 0 K.
By comparing the bare and the vegetated bedrock sites (Fig. 9a, b), the Bv site shows 50 K higher cumulative degree days, but a smaller amount of freezing degree days (126 K) and a smaller amount of thawing degree days (77 K) than Bb. Although the borehole is only covered by 19 cm of soil and vegetation, this effect has an impact on the thermal regime down to>1 m depth (Fig. 9c).
The differences of the snow cover (duration and height) as well as the yearly freezing and thawing periods are listed in detail for the uppermost sensors at each borehole in Ta-ble 2. In winter 2010/2011 the variation of the height of the snow cover was between 1.57 m (RMc), 1.4 m (Bv) and 0.5 m (RCf). The interannual variation of the snow cover height at the RMc site was between 0.57 m (2006/2007) and 1.83 m (2008/2009) (see as well Fig. 3). The mean duration of the snow cover varies from 167 days (RCf) to 205 days (RCc). All sites show a standard deviation of about 40 days.
Concerning the freezing degree days, the rock glacier sites (RCc and RMc) showed a mean of 250 days each year, which is much more than the seasonal frost sites (Bb and Bv). During the years 2005 and 2006, all sites experienced
S. Schneider et al.: Influence of subsurface heterogeneity on observed borehole temperatures 525
Table 2. Comparison of the snow cover (duration and height) and freezing and thawing indicators for the last eight years and for different sites for 1.5 m depth. Freezing indicators are the cumulative freezing temperature gradient (CFTG), the annual amount of freezing degree days and the duration of the spring zero curtain. Thawing indicators are expressed by the cumulative thawing temperature gradient (CTTG) and the annual amount of thawing degree days. Values are calculated for hydrological years (i.e. 2003 starts on 1 October 2002).
Freezing indicators Thawing indicators Snow cover
Site Year Duration Cumulative freezing Amount of Cumulative thawing Amount of Duration of Snow of spring zero temperature gradient freezing temperature gradient thawing snow cover depth curtain [d] (CFTG) [K d−1] degree days (CTTG) [K d−1] degree days [d] (max) [m]
Bb 2003 2 −0.13 84 11.3 279 205 –
2004 – – – – – – –
2005 5 −5.37 163 8.41 197 146 –
2006 1 −4.59 186 8.84 178 114 –
2007 – – – – – 132 –
2008 – – – – – 171 –
2009 0 0 0 9.56 365 211 1.4
2010 0 0 0 9.16 365 211 1.3
Mean (stdev) 2 (±2) −2.02 (±2.72) 61 (±88) 9.45 (±1.11) 277 (±89) 170 (±40) –
Bv 2003 4 −0.13 51 10.8 310 200 –
2004 – – – – – – –
2005 1 −3.09 187 8.4 177 149 –
2006 1 −2.92 200 8.92 164 127 –
2007 – – – – – 132 –
2008 – – – – – 177 –
2009 0 −0.03 79 9.87 286 229 1.5
2010 1 −0.05 100 8.77 264 221 1.4
Mean (stdev) 1 (±2) −1.24 (±1.61) 128 (±53) 9.35 (±0.97) 240 (±66) 176 (±42) –
TSc 2003 10 −0.07 121 5.9 234 214 –
2004 – – – – – – –
2005 6 −3.02 206 3.29 153 188 –
2006 5 −3.78 225 2.91 135 148 –
2007 – – – – – 169 –
2008 – – – – – 200 –
2009 4 −0.07 142 4.92 219 257 –
2010 8 −0.84 177 3.38 180 247 –
Mean (stdev) 7 (±2) −1.56 (±1.73) 187 (±42) 4.08 (±1.27) 184 (±42) 203 (±40) –
RMc 2003 – – – – – 199 1.69
2004 21 −3.31 237 5.48 108 221 1.38
2005 19 −4.79 209 4.86 137 147 0.81
2006 26 −5.64 218 5.27 121 110 0.93
2007 – – – – – 124 0.57
2008 25 −4.33 226 5.65 115 182 1.24
2009 – – – – – 227 1.83
2010 17 −3.73 236 5.84 112 216 1.57
Mean (stdev) 22 (±4) −4.36 (±0.91) 254 (±10) 5.42 (±0.38) 119 (±11) 178 (±46) 1.25 (±0.45)
RCc 2003 44 −1.39 224 6.82 97 224 –
2004 41 −2.55 229 4.44 96 258 –
2005 21 −5.23 225 4.33 119 171 –
2006 24 −6.11 217 4.15 124 141 –
2007 29 −3.86 174 5.56 162 188 –
2008 – – – – – 201 –
2009 – – – – – – –
2010 43 −3.4 236 3.95 86 252 –
Mean (stdev) 34 (±10) −3.76 (±1.73) 251 (±28) 4.88 (±1.11) 114 (±28) 205 (±43) –
RCf 2003 40 −0.98 181 6.25 144 195 –
2004 38 −1.77 152 5.94 176 219 –
2005 33 −4.43 142 5.23 190 136 –
2006 14 −3.49 157 6.36 194 107 –
2007 39 −2.58 116 5.36 210 129 –
2008 – – – – – 169 –
2009 – – – – – – –
2010 43 −0.32 32 6.78 290 211 0.5
526 S. Schneider et al.: Influence of subsurface heterogeneity on observed borehole temperatures S. Schneider et al.: Influence of surface heterogeneity on observed borehole temperatures, Swiss Alps 9
Fig. 7. Eight year mean annual (grey), mean summer (white) and mean winter temperatures (black) for each borehole and each depth. In addition, air temperature (taken from the micrometeorological station at rock glacier Murt`el) and the individual mean GST at each borehole site are included.
All sites show a standard deviation of about 40 days. Concerning the freezing degree days, the rock glacier sites (RCc and RMc) show a mean of 250 days each year, which is much more than the seasonal frost sites (Bb and Bv). During
430
the years 2005 and 2006 all sites experienced the strongest cooling (i.e. the highest cumulative freezing temperature gradient (CFTG)). During the warm summer in 2003 the cumulative thawing temperature gradient (CTTG) was only slightly increased, whereas the CFTG was at all sites one of
435
the lowest during the last eight years. In general, the tive freezing temperature gradient is lower than the cumula-tive thawing temperature gradient at all sites and in all years, except in the year 2006 where at the rock glacier and the talus slope places the CFTG exceeds the CTTG. At each site the
440
annual change of the CFTG is higher (standard deviation be-tween 0.91 and 2.72) than the annual change of the CTTG with a standard deviation between 0.38 and 1.27.
4.3 Apparent thermal diffusivity (ATD)
Fig.10 presents the calculated ATD for different sites and
445
depths. Only values below 1m depth will be discussed, because the temperature amplitude close to the surface is influenced by energy balance parameters rather than by thermal properties of the subsurface. The ATD of the bedrock increases with depth to values up to 1.64x10⁻⁶ m2
450
s−1, which agrees well with the values of Robert (1998), who found 1.7x10⁻⁶ m2 s−1 as value for granitic rock at a MAST of around 7.2 ◦C. ATD values found within the active layer of the Chastelets rock glacier (1-3 m) are about 2.69x10⁻⁶
m2 s−1 and therefore higher than within
455
the ice-filled permafrost layer underneath (1.3x10⁻⁶ m2 s−1). The permafrost layer of RMc (3 - 5m) shows with 1.56x10⁻⁶ m2 s−1 similar values (fig.10). These values are slightly higher than the ones published by Williams and Smith (1989) where pure ice is given by a value of
460
1.16x10⁻⁶
m2 s−1 at 0◦C. The talus slope has the largest
Fig. 7. Eight-year mean annual (grey), mean summer (white) and mean winter temperatures (black) for each borehole and each depth. In addition, air temperature (taken from the micrometeorological station at rock glacier Murt`el) and the individual mean GST at each borehole site are included.
the strongest freezing (i.e. the highest cumulative freezing temperature gradient (CFTG)). During the warm summer in 2003, the cumulative thawing temperature gradient (CTTG) was only slightly increased, whereas the CFTG was at all sites one of the lowest during the last eight years. In gen-eral, the cumulative freezing temperature gradient was lower than the cumulative thawing temperature gradient at all sites and in all years, except in the year 2006 where at the rock glacier and the talus slope places the CFTG exceeded the CTTG. At each site the annual change of the CFTG was higher (standard deviation between 0.91 and 2.72) than the annual change of the CTTG, with a standard deviation be-tween 0.38 and 1.27.
4.3 Apparent thermal diffusivity (ATD)
Figure 10 presents the calculated ATD for different sites and depths. Only values below 1m depth will be discussed, be-cause the temperature amplitude close to the surface is influ-enced by energy balance parameters rather than by thermal
properties of the subsurface. The ATD of the bedrock in-creases with depth to values up to 1.64×10⁻⁶m2s−1, which agrees well with the values of Robert (1998), who found 1.7×10⁻⁶m2s−1as value for granitic rock at a MAST of around 7.2◦C. ATD values found within the active layer
of the Chastelets rock glacier (1–3 m) are about 2.69× 10⁻⁶m2s−1 and therefore higher than within the ice-filled permafrost layer underneath (1.3×10⁻⁶m2s−1). The per-mafrost layer of RMc (3–5 m) shows with 1.56×10⁻⁶m2s−1 similar values (Fig. 10). These values are slightly higher than the ones published by Williams and Smith (1989), where pure ice is given by a value of 1.16×10⁻⁶m2s−1at 0◦C. The talus slope has the largest annual range of the ATD (2×10⁻⁶– 3.45×10⁻⁶m2s−1).
Figure 11 presents the calculated temperature transfer rate for different sites. As expected, the rock glacier sites (RCc and RMc) have the fastest temperature transfer, followed by the talus slope and by the bedrock and fine-grained sites. The ice below the active layer enhances the temperature gradient
S. Schneider et al.: Influence of subsurface heterogeneity on observed borehole temperatures 527 10 S. Schneider et al.: Influence of surface heterogeneity on observed borehole temperatures, Swiss Alps
Fig. 8.Mean cumulative degree days (averaged over four years (2003, 2005, 2006, 2010)) at three different depths (0m (a), 2.5m (b) and 5m (c)) for the six boreholes. The air temperature is shown for comparison.
Fig. 9.Cumulative degree days (CDD) (averaged over four years (2003, 2005, 2006, 2010)) at the surface (0m depth) for bare bedrock (Bb) and vegetated bedrock (Bv). Freezing degree days (FDD) are all days≤0◦C, whereas the days with temperatures>0◦C were set to 0. Likewise the thawing degree days (TDD) are the days with temperatures>0◦C and temperatures≤0◦C were set to 0. For c) the mean cumulated temperature difference between the vegetated and the bare bedrock site for 0m, 1m and 2m depth was calculated.
annual range of the ATD (2x10⁻⁶- 3.45x10⁻⁶m2s−1).
Fig.11 presents the calculated temperature transfer rate for different sites. As expected the rock glacier sites (RCc and
465
RMc) have the fastest temperature transfer, followed by the talus slope and by the bedrock and fine-grained sites. The
and therefore the temperature transfer rate by a factor of four (up to 5.6 K m−1d−1) compared to the ice-free sites.
470
Fig. 8. Mean cumulative degree days (averaged over four years (2003, 2005, 2006, 2010)) at three different depths (0 m (a), 2.5 m (b) and 5 m (c)) for the six boreholes. The air temperature is shown for comparison.
10 S. Schneider et al.: Influence of surface heterogeneity on observed borehole temperatures, Swiss Alps
Fig. 8.Mean cumulative degree days (averaged over four years (2003, 2005, 2006, 2010)) at three different depths (0m (a), 2.5m (b) and 5m (c)) for the six boreholes. The air temperature is shown for comparison.
Fig. 9.Cumulative degree days (CDD) (averaged over four years (2003, 2005, 2006, 2010)) at the surface (0m depth) for bare bedrock (Bb) and vegetated bedrock (Bv). Freezing degree days (FDD) are all days≤0◦C, whereas the days with temperatures>0◦C were set to 0. Likewise the thawing degree days (TDD) are the days with temperatures>0◦C and temperatures≤0◦C were set to 0. For c) the mean cumulated temperature difference between the vegetated and the bare bedrock site for 0m, 1m and 2m depth was calculated.
annual range of the ATD (2x10⁻⁶- 3.45x10⁻⁶m2s−1).
Fig.11 presents the calculated temperature transfer rate for different sites. As expected the rock glacier sites (RCc and
465
RMc) have the fastest temperature transfer, followed by the talus slope and by the bedrock and fine-grained sites. The ice below the active layer enhances the temperature gradient
and therefore the temperature transfer rate by a factor of four (up to 5.6 K m−1d−1) compared to the ice-free sites.
470
Fig. 9. Cumulative degree days (CDD) (averaged over four years (2003, 2005, 2006, 2010)) at the surface (0 m depth) for bare bedrock (Bb) (a) and vegetated bedrock (Bv) (b). Freezing degree days (FDD) are all days≤0◦C, whereas the days with temperatures>0◦C were set to 0. Likewise, the thawing degree days (TDD) are the days with temperatures>0◦C so temperatures≤0◦C were set to 0. For (c) the mean cumulated temperature difference between the vegetated and the bare bedrock site for 0 m, 1 m and 2 m depth was calculated.
and therefore the temperature transfer rate by a factor of four (up to 5.6 K m−1d−1) compared to the ice-free sites.
5 Discussion
Compared to other studies on mountain permafrost which recognized an ongoing degradation (Harris et al., 2009; Smith et al., 2010; Farbrot et al., 2011) and a temperature rise of up to 0.095◦C a−1(subsurface temperature at 6–9 m
528 S. Schneider et al.: Influence of subsurface heterogeneity on observed borehole temperatures S. Schneider et al.: Influence of surface heterogeneity on observed borehole temperatures, Swiss Alps 11
Fig. 10. ATD of the different sites. Calculated for the surface (black), the active layer (blue) and for the permafrost body (red).
Fig. 11. Temperature transfer rate, calculated as 6 year mean from maximum summer borehole temperatures from 0.5m depth to the lower limit of the active layer in K m−1d−1
5 Discussion
Compared to other studies on mountain permafrost which recognized an ongoing degradation (Harris et al. (2009), Smith et al. (2010) and Farbrot et al. (2011)) and a
temper-475
ature rise of up to 0.095◦C a−1 (subsurface temperature at 6-9m depth) from 1999 to 2009 (Isaksen et al. (2011)), the investigated sites within the Murt`el- Corvatsch area show no consistent subsurface temperature trends since 2002 within the observed range of depth. Rather, the thermal regime is
480
mainly influenced by the composition of the subsurface ma-terial and the height and duration of the snow cover (fig.5). At all sites the subsurface temperatures were the lowest when the snow height was less than 1m (tab.2 and fig.3). This agrees well with other field (Keller and Gubler (1993)) and
485
modelling studies (Luetschg et al. (2008)), which determined the value of>0.8 m for an insulating snow cover. Isaksen et al. (2011) confirmed the correlation between the height of the snow cover and the subsurface temperatures for the ob-served norwegian permafrost sites. Concerning the duration
490
of the snow cover, it is about 1 month longer at the coarse blocky sites (TSc and RCc) than at the other sites (tab.2). Given that all boreholes are placed at the same altitude it
can be assumed that the first snow arrives at all sites to the same time. Therefore, the variation in snow cover duration
495
is mainly due to a higher and longer lasting snow cover be-tween the blocks. At the different sites the maximum snow height varies between 0.5 m and 1.57 m. Luetschg et al. (2008) showed that the height of the snow cover is the most important influencing factor on the ground thermal regime,
500
followed by the effect of the date of the first insulating snow cover.
The findings of Luetschg et al. (2008) could be confirmed, that the longer the non-insulating snow cover lasts in autumn, the colder is the GST through the entire year. At all sites the
505
cooling during autumn/ winter and the duration of the zero curtain in spring had a stronger influence on the interannual variability of the thermal regime than temperature increase during summer (tab.2 and fig.8). Even though the cumula-tive mean air temperature is clearly negacumula-tive, the cumulacumula-tive
510
degree days at the surface at all sites (apart from RMc) were positive, due to the isolating effect of the snow cover in win-ter.
In the following the dominant processes and material charac-teristics are discussed for each site:
515
– Bedrock: The two bedrock sites (Bb and Bv) showed only seasonal frost within the investigated range of depth and increased temperatures were observed in 2003, 2008 and 2009. At the Bb site (below 5 m depth) no freezing was observed during the last two
520
years (fig.3a). Thermal conduction was the dominant process as could be seen from the almost linear temper-ature decrease with depth (fig.7), the high cumulative thawing temperature gradient (CTTG) (9.4◦C/day−1) and the calculated ATD of about 1.64x10⁻⁶ m2 s−1.
525
Comparing the vegetated with the bare bedrock site revealed that the Bv site shows 50 K higher cumulative mean temperatures, but a smaller amount of freezing degree days (126 K) and a smaller amount of thawing degree days (77 K) than Bb. Consequenly, the bare
530
bedrock site experiences a higher incoming shortwave radiation during the day and a higher outgoing long-wave radiation during the night. These two radiation fluxes seem to counter act in a quite homogenous way, whereas the Bv site dampens the daily temperature
535
fluctuation due to a higher heat storage capacity of the soil (Walker et al. (2003)), leading to a more balanced but slightly warmer regime. Consequently, the impact of the heat storage capacity on the annual thermal regime is more important than a slightly higher
540
incoming solar radiation. This effect had an impact on the thermal regime to more than 1 m depth (fig.9c).
– Rock glacier (coarse blocky): The coarse blocky,
ice-rich rock glacier sites (RCc and RMc) showed
545
no significant changes in the thermal regime during
Fig. 10. ATD of the different sites. Calculated for the surface (black), the upper layer (blue) and the lower layer (red).
modelling studies (Luetschg et al., 2008), which determined the value of>0.8 m for an insulating snow cover. Isaksen et al. (2011) confirmed the correlation between the height of the snow cover and the subsurface temperatures for the observed Norwegian permafrost sites. Concerning the du-ration of the snow cover, it is about 1 month longer at the coarse blocky sites (TSc and RCc) than at the other sites (Table 2). Given that all boreholes are placed at the same altitude, it can be assumed that the first snow arrives at all sites at the same time. Therefore, the variation in snow cover duration is mainly due to a higher and longer lasting snow cover between the blocks. At the different sites the maximum snow height varies between 0.5 m and 1.57 m. Luetschg et al. (2008) showed that the height of the snow cover is the most important influencing factor on the ground thermal regime, followed by the effect of the date of the first insulating snow cover.
The findings of Luetschg et al. (2008) could be confirmed, showing that the longer the non-insulating snow cover lasts in autumn, the colder is the GST through the entire year. At all sites the cooling during autumn/winter and the duration of the zero curtain in spring had a stronger influence on the in-terannual variability of the thermal regime than temperature increase during summer (Table 2 and Fig. 8). Even though the cumulative mean air temperature is clearly negative, the cumulative degree days at the surface at all sites (apart from RMc) were positive due to the isolating effect of the snow cover in winter.
In the following the dominant processes and material char-acteristics are discussed for each site:
– Bedrock: The two bedrock sites (Bb and Bv) showed only seasonal frost within the investigated range of depth and increased temperatures were observed in 2003, 2008 and 2009. At the Bb site (below 5 m depth), no freezing was observed during the last two years (Fig. 3a). Thermal conduction was the dominant pro-cess, as could be seen from the almost linear
tempera-S. Schneider et al.: Influence of surface heterogeneity on observed borehole temperatures, Swiss Alps 11
Fig. 10. ATD of the different sites. Calculated for the surface (black), the active layer (blue) and for the permafrost body (red).
Fig. 11. Temperature transfer rate, calculated as 6 year mean from maximum summer borehole temperatures from 0.5m depth to the
lower limit of the active layer in K m−1d−1
5 Discussion
Compared to other studies on mountain permafrost which recognized an ongoing degradation (Harris et al. (2009), Smith et al. (2010) and Farbrot et al. (2011)) and a
temper-475
ature rise of up to 0.095◦C a−1 (subsurface temperature at 6-9m depth) from 1999 to 2009 (Isaksen et al. (2011)), the investigated sites within the Murt`el- Corvatsch area show no consistent subsurface temperature trends since 2002 within the observed range of depth. Rather, the thermal regime is
480
mainly influenced by the composition of the subsurface ma-terial and the height and duration of the snow cover (fig.5). At all sites the subsurface temperatures were the lowest when the snow height was less than 1m (tab.2 and fig.3). This agrees well with other field (Keller and Gubler (1993)) and
485
modelling studies (Luetschg et al. (2008)), which determined the value of> 0.8 m for an insulating snow cover. Isaksen et al. (2011) confirmed the correlation between the height of the snow cover and the subsurface temperatures for the ob-served norwegian permafrost sites. Concerning the duration
490
of the snow cover, it is about 1 month longer at the coarse blocky sites (TSc and RCc) than at the other sites (tab.2). Given that all boreholes are placed at the same altitude it
can be assumed that the first snow arrives at all sites to the same time. Therefore, the variation in snow cover duration
495
is mainly due to a higher and longer lasting snow cover be-tween the blocks. At the different sites the maximum snow height varies between 0.5 m and 1.57 m. Luetschg et al. (2008) showed that the height of the snow cover is the most important influencing factor on the ground thermal regime,
500
followed by the effect of the date of the first insulating snow cover.
The findings of Luetschg et al. (2008) could be confirmed, that the longer the non-insulating snow cover lasts in autumn, the colder is the GST through the entire year. At all sites the
505
cooling during autumn/ winter and the duration of the zero curtain in spring had a stronger influence on the interannual variability of the thermal regime than temperature increase during summer (tab.2 and fig.8). Even though the cumula-tive mean air temperature is clearly negacumula-tive, the cumulacumula-tive
510
degree days at the surface at all sites (apart from RMc) were positive, due to the isolating effect of the snow cover in win-ter.
In the following the dominant processes and material charac-teristics are discussed for each site:
515
– Bedrock: The two bedrock sites (Bb and Bv) showed
only seasonal frost within the investigated range of depth and increased temperatures were observed in 2003, 2008 and 2009. At the Bb site (below 5 m depth) no freezing was observed during the last two
520
years (fig.3a). Thermal conduction was the dominant process as could be seen from the almost linear temper-ature decrease with depth (fig.7), the high cumulative thawing temperature gradient (CTTG) (9.4 ◦C/day−1) and the calculated ATD of about 1.64x10⁻⁶ m2 s−1.
525
Comparing the vegetated with the bare bedrock site revealed that the Bv site shows 50 K higher cumulative mean temperatures, but a smaller amount of freezing degree days (126 K) and a smaller amount of thawing degree days (77 K) than Bb. Consequenly, the bare
530
bedrock site experiences a higher incoming shortwave radiation during the day and a higher outgoing long-wave radiation during the night. These two radiation fluxes seem to counter act in a quite homogenous way, whereas the Bv site dampens the daily temperature
535
fluctuation due to a higher heat storage capacity of the soil (Walker et al. (2003)), leading to a more balanced but slightly warmer regime. Consequently, the impact of the heat storage capacity on the annual thermal regime is more important than a slightly higher
540
incoming solar radiation. This effect had an impact on the thermal regime to more than 1 m depth (fig.9c).
– Rock glacier (coarse blocky): The coarse blocky,
ice-rich rock glacier sites (RCc and RMc) showed
545
no significant changes in the thermal regime during
Fig. 11. Temperature transfer rate, calculated as 6-year mean from maximum summer borehole temperatures from 0.5m depth to the lower limit of the active layer in K m−1d−1.
ture decrease with depth (Fig. 7), the high cumulative thawing temperature gradient (CTTG) (9.4◦C day−1) and the calculated ATD of about 1.64×10⁻⁶m2s−1. Comparing the vegetated with the bare bedrock site re-vealed that the Bv site shows 50 K higher cumulative mean temperatures, but a smaller amount of freezing degree days (126 K) and a smaller amount of thawing degree days (77 K) than Bb. Consequenly, the bare bedrock site experiences a higher incoming shortwave radiation during the day and a higher outgoing long-wave radiation during the night. These two radiation fluxes seem to counteract in a quite homogenous way, whereas the Bv site dampens the daily temperature fluc-tuation due to a higher heat storage capacity of the soil (Walker et al., 2003), leading to a more balanced but slightly warmer regime. Consequently, the impact of the heat storage capacity on the annual thermal regime is more important than a slightly higher incoming so-lar radiation. This effect had an impact on the thermal regime to more than 1 m depth (Fig. 9c).
– Rock glacier (coarse blocky): The coarse blocky, ice-rich rock glacier sites (RCc and RMc) showed no sig-nificant changes in the thermal regime during the entire observation period (Figs. 3 and 6). Their temperature profile is split into a high temperature gradient whithin the active layer and almost isothermal temperature con-ditions of the ice down to 6 m depth. In summer 2009 the thermistor chain of the RCc borehole was cut at about 4 m depth due to the movement of the rock glacier. Hence, it can be assumed that a shear horizon is at 4 m depth, 1.5 m below the top of permafrost. The active layer depth of the two rock glaciers did not change dur-ing the last eight years (Fig. 6) and the temperature gra-dient within the active layer is the largest in comparison with the other sites (Fig. 7). According to Smith et al. (2010), the thermal regime seems to be strongly influ-enced by the comparatively high ice content, causing only little variation of the active layer depth in spite of changing climate parameters. ATD values found within
S. Schneider et al.: Influence of subsurface heterogeneity on observed borehole temperatures 529
the active layer of the Chastelets rock glacier (1–3 m) are about 2.69×10⁻⁶m2s−1and therefore higher than within the ice-filled permafrost layer underneath (1.3× 10⁻⁶m2s−1), caused by a higher amount of air filled pore spaces. The ATD values of the active layer and the high temperature transport rate of 5.6 K m−1d−1 (Fig. 11) confirm a high thermal response of the active layer. Hooke (1998) pointed out that, at a temperature of −0.5◦C, variations of the ATD are mainly caused by changes in thermal conductivity, which are slightly decreasing with increasing temperatures. On the other hand, the heat capacity is increasing because of a con-tinuously rising unfrozen water content within the ice. However, real conditions influencing the ATD of rock glaciers are even more complicated because heat capac-ity is also dependent on the concentration of impurities in the ice, and the thermal conductivity is influenced by the ratio of ice/rock.
– Rock glacier (fine-grained): The fine-grained site at the frontal part of the Chastelets rock glacier (RCf) be-came ice free in 2008 or 2009 (see Fig. 3d). The variable active layer depth within the observed period of time and the temperature of the ice close to 0◦C illustrate the high sensitivity of this site. In the year 2008/2009, the remaining ice in the front of the rock glacier melted out completely (Fig. 3d), probably due to 3-D influenced topography of the rockglacier front (Fig. 1). The high temperature gradient within the active layer (Fig. 7d) was probably caused by the cold temperatures of the adjacent ice of the rock glacier. The duration of the zero curtain seems to be very important for this site, as it reduces the thawing period. In contrast to Farbrot et al. (2011) and Isaksen et al. (2011) who found en-hanced ground cooling at exposed sites with a thin non-insulating snow cover, this site does not seem to experi-ence stronger cooling of the subsurface by the penetra-tion of cold air, even though it is the one with the small-est snow depth (0.5 m). The GST Fig. 3d) during winter is not lesser than at the other rock glacier sites. There-fore other processes, such as advection caused by infil-trating (melt-) water as well as the amount and size of pore spaces, seem to be more important for fine-grained material.
– Talus slope: A longer lasting snow cover and a re-duced amount of incoming shortwave radiation, due to the slightly more shaded position between the blocks, caused a much longer frozen season (Figs. 3c, 7c) and lower cumulative temperatures at the surface (4.9 K) (Table 2) than at the bedrock sites close-by. Relatively low MAAT during the years 2005 and 2006 (Fig. 3, PERMOS, 2007) caused a shallow active layer depth, whereas during the years 2003 and 2009, the active layer depth increased about 2 m due to a relative high MAAT (Fig. 3, PERMOS, 2010). The varying zero
curtain in spring (Table 2) indicated a highly variable year-to-year production of ice during autumn/winter. However, the high interannual variability of active layer depth (Fig. 6) and the highly variable ATD values lead to the assumption that this site had a yearly changing amount of ice/water within the air-filled pore spaces but contained only very little ice during summer. The high ATD values (on average 2.73×10⁻⁶m2s−1) and the low annual temperature variation below 1 m depth confirm that this site is mainly influenced by non-conductive processes as discussed in Delaloye and Lam-biel (2005), LamLam-biel and Pieracci (2008). Advective cooling by air flow between the blocks seemed to be efficient below 1 m depth and caused low temperatures throughout the year. Within the first meter a tempera-ture transfer rate of about 2.1 K m−1d−1was observed (Fig. 11). As explained by Hanson and Hoelzle (2005), the first meter of this borehole was drilled in a block of approximately 1 m depth, leading to the assumption that the uppermost part of the borehole is dominated by con-ductive processes. Hence, the occurrence of permafrost at this site is due to the very efficient cooling by convec-tive processes and the seasonal creation of ice.
6 Conclusions
Eight-year borehole temperature data from a high alpine per-mafrost environment including different subsurface materials were presented. Assuming that the microclimate, the expo-sition and slope angle are almost the same for all sites, no uniform subsurface temperature changes were observed. The thermal response depends strongly on the (sub-) surface ma-terial and its site-specific processes as follows:
– At all sites the interannual variability of the freezing during autumn/winter and the duration of the zero cur-tain in spring have a stronger influence on the annual thermal regime than temperatures during summer. – At the investigated Murt`el-Corvatsch area, temperature
anomalies, like in the year 2003 (PERMOS, 2007), are not due to a stronger temperature increase during sum-mer but rather to the low freezing during the winter be-fore.
– The height of the snowpack has an influence on all sites. A thin snowpack without thermal resistance (i.e. during winter 2004/2005 and 2005/2006) forces a cooling of the ground irrespective of the subsurface material. An insulating snow cover was observed with snow depths >1 m. The duration of the snow cover is about one month longer at the coarse blocky sites.