Automatic Extraction of Probabilistic
Workload Specifications for Load Testing
Session-Based Application Systems
André van Hoorn,
1Christian Vögele,
2Eike Schulz,
3Wilhelm Hasselbring,
3Helmut Krcmar
41
University of Stuttgart, Institute of Software Technology, 70569 Stuttgart, Germany
2fortiss GmbH, 80805 München, Germany
3
Kiel University, Department of Computer Science, 24118 Kiel, Germany
4
Technische Universität München, Chair for Information Systems, 85748 Garching, Germany
[email protected], [email protected], {esc,wha}@informatik.uni-kiel.de, [email protected]
ABSTRACT
Workload generation is essential to systematically evaluate performance properties of application systems under con-trolled conditions, e.g., in load tests or benchmarks. The definition of workload specifications that represent the real workload as accurately as possible is one of the biggest chal-lenges in this area. This paper presents our approach for the modeling and automatic extraction of probabilistic work-load specifications for work-load testing session-based application
systems. The approach, calledWessbas, comprises(i.) a
domain-specific language (DSL) enabling layered modeling
of workload specifications as well as support for (ii.)
au-tomatically extracting instances of the DSL from recorded
sessions logs and(iii.)transforming instances of the DSL to
workload specifications of existing load testing tools. During the extraction process, different groups of customers with similar navigational patterns are identified using cluster-ing techniques. We developed correspondcluster-ing tool support including a transformation to probabilistic test scripts for the Apache JMeter load testing tool. The evaluation of the proposed approach using the industry standard benchmark SPECjEnterprise2010 demonstrates its applicability and the representativeness of the extracted workloads.
Categories and Subject Descriptors
C.4 [Performance of Systems]: measurement techniques,
modeling techniques
Keywords
Workload Specifications, Load Testing, Clustering, Session-based Application Systems, Load Test Extraction
1.
INTRODUCTION
For essentially any measurement-based software performance evaluation activity—e.g., load, stress, and regression test-ing, or benchmarking—it is necessary to expose the system
under test (SUT) to synthetic workload [3, 5, 6, 7], i.e., au-tomatically generating requests to system-provided services. Workload generation tools—also called workload drivers— are used to emulate a multitude of concurrent system users based on workload specifications, ranging from manually de-fined scenarios over recorded traces to analytical models [1]. This paper focuses on analytical model-based workload gen-eration for session-based systems, i.e., systems that are used by users in time-bounded sessions of interrelated requests and think times between subsequent requests [8].
Approaches have been proposed for specifying and generat-ing workloads for this type of systems (e.g., [6, 7, 8]). How-ever, one of the biggest challenges is how to obtain workload specifications that produce workload characteristics similar to a system’s production usage profile, e.g., arrival rates of sessions and requests to system-provided services. Further, the extraction and specification of workloads strongly de-pends on the used workload generation tool. Because of that the workload must be extracted for each tool and specified into a specific structure.
In response to these challenges, this paper presents our
Wess-bas1 approach for specifying and extracting probabilistic
workloads for session-based application systems. A
domain-specific language (DSL), calledWessbas-DSL, is introduced
which enables the system- and tool-agnostic modeling of these workload specifications. Recorded session logs from the systems are used as basis for the automatic extraction of Wessbas-DSLinstances. Different groups of customers showing similar navigational patterns are identified during
the creation of these instances. Wessbas-DSL instances
are transformed to workload specifications for load genera-tion tools. Finally, a transformagenera-tion to the common load testing tool Apache JMeter, including the Markov4JMeter extension developed in our previous work [14], is presented
in this paper. Figure 1 provides an overview of theWessbas
approach.
To summarize, the contribution of this paper is our
Wess-basapproach for automatic extraction of probabilistic
work-load specifications of session-based application systems,
com-prising (i.)a DSL for modeling session-based probabilistic
workload specifications,(ii.)an automatic extraction of DSL
1WESSBAS is an acronym for Workload Extraction and
Specification for Session-Based Application Systems 3HUPLVVLRQWRPDNHGLJLWDORUKDUGFRSLHVRIDOORUSDUWRIWKLVZRUNIRU
SHUVRQDORUFODVVURRPXVHLVJUDQWHGZLWKRXWIHHSURYLGHGWKDWFRSLHV DUHQRWPDGHRUGLVWULEXWHGIRUSURILWRUFRPPHUFLDODGYDQWDJHDQGWKDW FRSLHVEHDUWKLVQRWLFHDQGWKHIXOOFLWDWLRQRQWKHILUVWSDJH7RFRS\ RWKHUZLVHWRUHSXEOLVKWRSRVWRQVHUYHUVRUWRUHGLVWULEXWHWROLVWV UHTXLUHVSULRUVSHFLILFSHUPLVVLRQDQGRUDIHH
9$/8(722/6'HFHPEHU%UDWLVODYD6ORYDNLD &RS\ULJKWk,&67
'2,LFVWYDOXHWRROV
Test Plan JMeter
<<conformsTo>> Monitoring
SUT
Transformation
JMeter API
Markov4JMeter
Behavior Models
Workload Intensity
+ Clustering
DSL
WESSBAS-DSL-Instance WESSBAS
Behavior Models
<<uses>>
Behavior Mix
Session Log
Extraction
Transformation
Test Plan Generator WESSBAS-DSL Model Generator Behavior Model Extractor Monitoring
<<conformsTo>> e.g., Kieker
Figure 1: Overview of the WESSBAS approach
instances from recorded sessions logs including the
cluster-ing of navigational patterns,(iii.)transformations from DSL
instances to JMeter Test Plans, and(iv.)tool support for
this approach. The tool support serves as an extensible im-plementation of the approach, including the DSL, the ex-traction, as well as a proof-of-concept transformation from the DSL to JMeter Test Plans. Supplementary material for this paper, including the developed tools, models, and
ex-perimental results, is publicly available online.2
2.
BACKGROUND AND RELATED WORK
The approach described in this paper builds on our previ-ous work on generating probabilistic and intensity-varying workloads [11, 14] for session-based systems—particularly the workload modeling formalism that extends the work by
Menasc´e et al. [8] and Krishnamurthy et al. [6]. This
sec-tion introduces the concepts needed for the remainder of this paper, including a brief discussion of related work.
The workload modeling formalism (Workload Model)
com-prises two different types of models, which will be detailed
below [14]: (i.)anApplication Model, specifying allowed
se-quences of service invocations and SUT-specific details for
generating valid requests; and(ii.)a weighted set of
Behav-ior Models, each providing a probabilistic representation of user sessions in terms of invoked services and think times among subsequent invocations. Additionally, the Workload Model includes a function specifying the number of active sessions during the workload generation execution. We de-veloped a publicly available extension, called Markov4JMeter [14], for the well-known load generator Apache JMeter, al-lowing to define and execute these Workload Models.
2http://markov4jmeter.sf.net/valuetools14/
The Application Model is a two-layered hierarchical finite
state machine (FSM), consisting of aSession Layer and a
Protocol Layer. Inspired by the work by Krishnamurthy et al. [6], the Session Layer is a finite state machine, in which states refer to system-provided services and allowed transi-tions among these–possibly labeled with guards and actransi-tions. A guard is a boolean expression, defining the condition un-der which the related application transition fires. An action is a list of statements to be executed, in case the related ap-plication transition fires. For each Session Layer state, the Protocol Layer contains an associated FSM, which models the sequence of protocol-level requests to be executed when the Session Layer state is executed. The transitions define the valid sequences from one state to another.
A Behavior Model roughly corresponds to the Customer
Be-havior Model Graphs (CBMGs) introduced by
Menasc´e et al. [8]. A Behavior Model BA is defined as a
tuple (S∪ {$}, P, z0, ftt). S specifies the set of states
con-tained in the Behavior Model with initial statez0∈S and
exit state $. P = [pi,j] is an n×n-matrix of transition
probabilities, withn= |S∪ {$}|. A matrix entrypi,j
de-fines the probability for a transition from statei to state
j. The distribution functionfttspecifies the think time
as-sociated with a transition. Think times can, for instance,
be modeled by using random values. TheBehavior Mix is
a set {(B0, r0), . . . ,(Bm−1, rm−1)}, which assigns a relative
frequencyrito the Behavior ModelBi. A tuple (Bi, ri)
in-dicates that sessions that correspond to the Behavior Model
Biare generated with a relative frequency ofri∈[0,1].
Dur-ing the workload generation process to a SUT, the Behavior Mix determines the user type to be emulated next by select-ing the correspondselect-ing Behavior Model based on the assigned relative frequencies.
In the proposed approach, workload specifications represent-ing the measured usage profiles of session-based systems are extracted. A similar approach, yet focusing on the
afore-mentioned CBMGs, has been proposed by Menasc´e et al. [7,
8]. The authors extract CBMGs from HTTP server logs, including K-means clustering to identify CMBGs for similar types of users. In contrast, in our work an advancement of the K-means algorithm, called X-means is applied.
Our approach focuses on the specification of the behavior of users and offers basic support for modeling workload intensi-ties. An approach focusing on the definition of the workload intensities can be found in [13]. It allows a DSL-based def-inition of variable and dynamic load profiles and workload scenarios over time.
3.
WESSBAS-DSL
The Wessbasdomain-specific language (DSL), referred to asWessbas-DSL, follows the Markov4JMeter workload mod-eling formalism [14] introduced in the previous section and therewith denotes a language for expressing such models.
In our approach, the Wessbas-DSL is used as an
inter-mediate language between the construction of SUT-specific but tool-agnostic workload models on the one side, and the generation of corresponding inputs to load testing tools on
the other side. The Wessbas-DSLis implemented as an
Ecore-based meta-model, using the benefits and tool support
WorkloadModel
ApplicationModel
-name : EString -filename : EString
BehaviorModel SessionLayerEFSM
ProtocolLayerEFSM
-name : EString Service
ProtocolState ApplicationState
-value : EDouble RelativeFrequency
BehaviorMix
MarkovState
HTTPRequest -formula : EString
<<abstract>> WorkloadIntensity
-numberOfSessions : EInt ConstantWorkloadIntensity
-name : EString -value : EString Parameter
-patternToTest : EString Assertion
-key : EString -value : EString
Property <<abstract>>
Request
JavaRequest JUnitRequest 1
1 1
1
0..* 0..*
1
1..*
1 1 1..*
1
1
1
0..* 1
relativeFrequencies
protocol-
behavior-. behavior-. behavior-.
. . . . . .
. . .
workload- behaviorMix
sessionLayerEFSM applicationModel
behaviorModel
Details Intensity
assertions properties parameters
service service
request
Models
(a)Wessbas-DSLclasses and relationships
-name : EString -filename : EString
BehaviorModel
MarkovState
-probability : EDouble
Transition <<abstract>> ThinkTime -mean : EDouble -deviation : EDouble
NormallyDistributedThinkTime
<<abstract>> BehaviorModelState
BehaviorModelExitState
1
1
markov-1..* 0..*
1 1
1 1
exitState
targetState
thinkTime
outgoing-initial- States State
Transitions
(b) Details on the Behavior Model
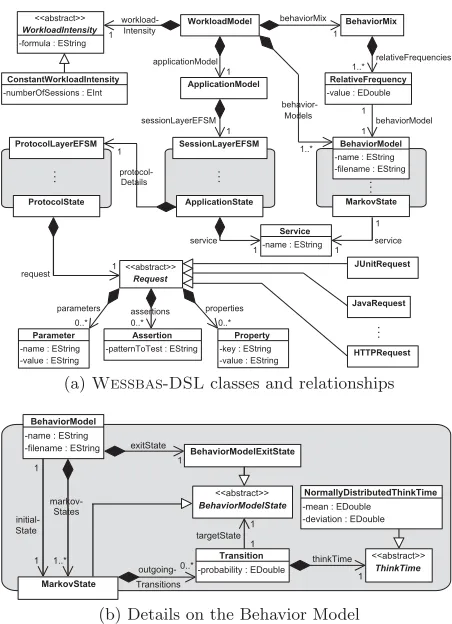
Figure 2: Overview of theWessbas-DSL
of the widely spread Eclipse Modeling Framework (EMF).3
The meta-model is enriched with a comprehensive amount of constraints (specified in the common Object Constraint Lan-guage, OCL), for checking the validity of model instances. The Wessbas-DSLstructure offers a high degree of flexi-bility and extensiflexi-bility. The remainder of this section
intro-duces the core concepts of theWessbas-DSL. Details are
also provided by Schulz [10].
As a language for the Markov4JMeter workload modeling
formalism, theWessbas-DSLincludes the essential
compo-nents of that model, in particular the Application Model, the (Behavior) Mix of Behavior Models, and the workload intensity, as introduced in Section 2. Figure 2a gives an
overview of theWessbas-DSLclass structure.
The representation of the Application Model corresponds to the two-layered structure of that component, including FSMs for the Session Layer and the Protocol Layer as well. States of the Session Layer FSM, shortly referred to as Ap-plication States, are associated with services and Protocol Layer FSMs. States of the Protocol Layer FSMs are as-sociated with protocol-specific requests, which might be of type HTTP, Java, JUnit, BeanShell, SOAP, etc.; the set of currently supported request types can be extended easily by deriving additional subclasses from the common base class. Mention should be made of the difference between properties
3http://www.eclipse.org/modeling/emf/
and parameters of a request: properties correspond to the information which is required for sending a request, e.g., do-main, path, or port number of a targeted server; parameters denote values to be sent with the request, e.g., input data for a web form. Behavior Models are modeled as FSMs, with (Markov) States being associated with services. Figure 2b il-lustrates the class structure of Behavior Models. Transitions are labeled with probabilities and think times, whereas think times follow a certain type. Currently supported think times are of type Gaussian, that is, they underlie a normal distri-bution, indicating mean and (standard) deviation values as parameters. Exit states are modeled explicitly, as they are— in contrast to Markov States—not associated with services. Each Behavior Model is associated with a relative frequency, stored as a double value in a dedicated class. These frequen-cies are contained in the Behavior Mix, whose corresponding class denotes a further component of the workload model. Session Layer and Protocol Layer FSMs are modeled analo-gous to Behavior Models, with transitions being labeled with guards and actions. The formula for the workload intensity is stored as a string attribute in a dedicated class that also serves as a base class for all types of workload intensity. This facilitates a simple installation of according formulas, which might be provided by appropriate tools (e.g., [13]).
Even though theWessbas-DSLis independent of specific
testing tools, it includes all core information required for generating workload specifications that build on the Markov4JMeter workload modeling formalism. In this pa-per, we exemplify this by generating JMeter Test Plans
through passingWessbas-DSLmodels as input to a
trans-formation tool. This will be further discussed in Section
5. The implementation of the Wessbas-DSL as an Ecore
meta-model offers the benefits of EMF tools such as EMF
Form Editors or serialization support. In particular,
Wess-bas-DSLinstances can be viewed, validated, and modified
in an editor, before being passed as input to any
transfor-mation process. The EMF Form Editor offers a constraint
Live-Validationoption, which facilitates the maintenance of
Wessbas-DSLmodels. The extensibility of theWessbas
-DSLis given through its class structure: additional types of
workload intensity, requests, or think times can be simply implemented by deriving appropriate subclasses from the related base classes.
4.
EXTRACTING WESSBAS-DSL INSTANCES
The extraction of Wessbas-DSLinstances is based on
so-called session logs obtained from raw session information,
recorded from a running application system. Raw session
information is usually provided by arequest loggenerated by
monitoring facilities, comprising the associated requests to system-provided services with a session identifier and times-tamps for the request and completion time. A typical ex-ample is the HTTP request log provided by common web servers [8], or tracing information obtained from application-level monitoring tools [15]. The session log groups the re-quests by the session identifier, giving access to the sequence and timing information of subsequent service requests within a session. We will not detail the process of obtaining session logs from request logs any further but refer to existing works
[8] and assume that a session log in theWessbas format
is available. The remainder of this section details the
two-step procedure to obtain aWessbas-DSLinstance,
ing the(i.)clustering-based extraction of the Behavior Mix
(Section 4.1), and the(ii.)generation of a complete
Wess-bas-DSLinstance from the Behavior Mix (Section 4.2).
4.1
Clustering-Based Behavior Mix Extraction
During the transformation of a session log to a Wessbas
-DSLinstance, the Behavior Mix is determined by identifying
different groups of customers with similar navigational pat-terns. As proposed in [8], clustering methods can be used to support this task. The identification of different customer
groups has several advantages. First, the system can be
optimized upon these navigational patterns. Further, the impact of different Behavior Mixes on the performance can be evaluated, e.g., investigating the performance impact of an increased fraction of heavy buyers. To reduce the com-plexity and to increase the comprehensibility of the resulting Behavior Mix, the goal of the clustering is to obtain a rela-tive small number of clusters.
In this paper, we focus on clustering with the centroid-based X-means algorithm, which is an advancement of the well-known K-means algorithm [9]. The advantage of X-means over K-means is, that it is not mandatory to specify the num-ber of clusters K in advance by the user. The user provides a minimum and a maximum number of resulting clusters and the algorithm determines how many clusters are best suited. The evaluation of K-means clustering is very costly as the results of the K-means must repeatedly be evaluated with different numbers of K [2]. Further, the X-means algorithm scales better and the risk of finding local minima is lower. The X-means clustering algorithm is integrated into our pro-posed approach using the data mining framework Weka [4]. Other algorithms can be integrated accordingly.
Input instances for the clustering areabsoluteBehavior
Mod-els, each representing an×n-matrix of absolute transition
frequencies of one user session. Think times are not part of the clustering as they have no impact on the navigational patterns. Each matrix is transformed into a vector, as Weka cannot handle matrices as clustering input. Therefore, the values of a matrix is transformed into a vector by concate-nating the rows of the matrix. In a first step, a central vec-tor, called centroid, is determined randomly for each clus-ter. Each centroid represents a cluster and is the mean of the instances in that cluster. Then, the clustering algorithm iterates several times over the dataset and assigns instances to the nearest cluster centroid, until no instance changes the cluster anymore.
The distance between the instances is calculated using the Euclidean distance metric. During the calculation of a dis-tance, the attributes of the instances can be normalized to a value between zero and one. Without data normalization, attributes with highest variance are driving the clustering. That means in our case, that high transition counts have a high influence on the clustering. In order to figure out the best settings, both the normalized and the non-normalized Euclidean distance will be evaluated in Section 6.3.
Having executed the clustering, each attribute of a centroid represents the mean of the respective attribute values of all instances within this cluster. As a result, the centroids rep-resent the absolute Behavior Model of the corresponding
cluster. Think times per cluster centroid are determined by calculating the sum of the think times per transition of the respective cluster instances. Finally, the resulting Behavior Mix is calculated like proposed in [8]. It consists of the (rel-ative) Behavior Models, the mean think times per transition and the relative frequencies of the Behavior Models.
4.2
Generating WESSBAS-DSL Instances
The next task is to transform the extracted Behavior
Mod-els and the determined Behavior Mix to a validWessbas
-DSLinstance, which can be further transformed to any test
script format. Therefore, our dedicated Java-based
imple-mentation, namely Wessbas-DSL Model Generator
(Fig-ure 1), performs the following three steps: (i.)construction
of an Application Model, based on SUT-specific states and
transitions,(ii.)integration of the determined Behavior Mix
including the extracted Behavior Models, and(iii.)
integra-tion of the workload intensity definiintegra-tion.
The construction of an Application Model builds on SUT-specific information, particularly validness of service exe-cution sequences for the Session Layer FSM and protocol-specific information for the Protocol Layer FSMs. The range of such information differs as well as the format it might be provided in; consequently, extensions might be necessary. In
our approach, theBehavior Model Extractortool (Figure 1)
outputs a list of all available services associated with any states of Behavior Models. (Note that SUT-specific Behav-ior Models are defined on a common set of services.) A small script converts this list into a format that can be processed
by theWessbas-DSLModel Generator. This information
can be enriched with transition specifications; currently, our script generates all possible transitions between services, as-suming all sequences of service executions are valid. In par-ticular, neither transition guards nor actions are considered.
After reading the appropriately-formatted input data, the
Wessbas-DSLModel Generator builds a corresponding Ses-sion Layer FSM and assigns Protocol Layer FSMs to the
Markov States. Assuming that a (virtual) user provides
valid input only, the structure of our Protocol Layer FSMs remains trivial with exactly one Protocol State per FSM, indicating exactly one request being sent in a Markov State. A DSL that allows the definition of more complex, protocol-specific FSMs, e.g., failed user logins, denotes a future work issue.
The integration of Behavior Mix and Behavior Models
in-cludes the construction of correspondingWessbas-DSL
frag-ments. As the Application Layer includes all available ser-vices, corresponding Behavior Models can be derived, to be equipped with probabilities and think times provided by the extracted Behavior Models. Finally, the workload intensity is read as a formula string from a properties file, to be in-cluded into the resulting model. For further processing, the
resultingWessbas-DSLmodel is serialized to an XMI file,
using dedicated Ecore techniques. That file can be loaded into an EMF Form Editor to be validated and analyzed, before being passed to the next transformation module.
5.
GENERATING JMETER TEST PLANS
The final task of the extraction process is to transform a
givenWessbas-DSLinstance into a corresponding JMeter
Table 1: Mapping of Wessbas-DSL concepts to (Markov4)JMeter elements
Wessbas-DSL Markov4JMeter Elements
Session Layer FSM Markov States (+ outgoing transitions) Protocol Layer FSMs JMeter Elements (Markov State children) Workload Intensity MSC (Session Arrival Controller) Behavior Mix MSC (frequency table)
Behavior Models MSC (frequency table)→CSV-files
MSC = Markov Session Controller
Test Plan. Our Java-based implementation, namely Test
Plan Generator(Figure 1), reads a serializedWessbas-DSL instance from file and constructs a further XMI structure, which can be processed by the JMeter tool. The XMI out-put is generated via the JMeter API and denotes a JMeter-typical tree structure of Test Plan elements, including
Mar-kov4JMeter-specific elements, namely Markov States and
Markov Session Controller, that are provided by the
Mar-kov4JMeter add-on for JMeter. The core transformation
process builds on a mapping betweenWessbas-DSL
con-cepts and (Markov4)JMeter Test Plan elements. An over-view of the underlying mappings is given in Table 1.
A Session Layer FSM in theWessbas-DSLis mapped to a
corresponding set of Markov States in JMeter. Each Markov State includes its individual set of outgoing transitions with guards and actions, for defining the validity of state execu-tion sequences. The name of a Markov State in the resulting JMeter Test Plan corresponds to the name of the state’s
as-sociated service in the Wessbas-DSL instance. Protocol
Layer FSMs are modeled as child elements of Markov States in the tree-structured result. They are constructed with the use of JMeter controllers and samplers as well, according
to their relatedWessbas-DSLstructure. The workload
in-tensity is stored as a formula string in theSession Arrival
Controllersub-component of a Test Plan’s (unique) Markov Session Controller. That controller additionally includes a table for Behavior Mix frequencies, to be filled with
accord-ing values of the input Wessbas-DSLinstance. Behavior
Models are stored separately—indicated by a separation line in Table 1—in CSV-files, which are referred by the frequency table of the Markov Session Controller.
Besides the Test Plan elements that result from the core
transformation process for a givenWessbas-DSLinstance,
several JMeter elements are added to a generated Test Plan by default. This step is required for making a Test Plan’s structure accessible for the JMeter tool and providing addi-tional funcaddi-tionality, such as handling of HTTP session
cook-ies. Currently, the Test Plan structure is predefined,
tar-geting HTTP-based tests only; an appropriate mechanism for specifying alternative structures, particularly for differ-ent types of requests, denotes a future work issue.
6.
EVALUATION
In this evaluation, we apply our proposed extraction ap-proach and tooling to the industry-standard benchmark
SPECjEnterprise2010. This serves as an investigation of(i.)
the practicality of the approach and tooling support and(ii.)
the representativeness of the extracted workload
specifica-tions. With respect to(ii.) we particularly investigate the
following two research questions: (RQ 1) How accurately do
the clustering results match the input Behavior Mix? and
(RQ 2) What is the impact of the clustering results on the workload characteristics? Section 6.1 describes the exper-imental setting. The SPECjEnterprise2010 deployment is explained in Section 6.2. The results for RQ 1 and RQ 2 are detailed in Sections 6.3 and 6.4.
6.1
Evaluation Methodology
An instrumented version of SPECjEnterprise20104 is
exe-cuted with three different Behavior Mixes to obtain a
ses-sion log, from which instances of theWessbas-DSLare
ex-tracted and transformed into JMeter Test Plans. For the Behavior Model extraction we applied different configura-tions of the X-means clustering. A basic Application Model is automatically generated from the obtained Behavior Mod-els. Its Session Layer comprises the superset of all states from the Behavior Models, assuming that all transitions be-tween all states are allowed (no guards and actions). The Protocol Layer comprises a mockup HTTP request per state. The transformation from the instances to JMeter Test Plans is performed according to Section 4. In order to measure the characteristics of extracted workload models, we devel-oped a web application that is instrumented according to the SPECjEnterprise2010. Hence, the same session log analysis infrastructure can be applied to both the session informa-tion obtained from the SPECjEnterprise2010 runs and the JMeter runs for the synthetic workloads of the extracted workload specifications. The reason why we do not execute the extracted workload against the SPECjEnterprise2010 is that currently input parameters for the workload are not extracted automatically.
The accuracy of the clustering (RQ 1) is evaluated based on the fraction of misclassified sessions over all classifications of the clustering for a benchmark run. The impact of the clus-tering on the workload characteristics (RQ 2) is evaluated
based on (i.) two session-based metrics, session length as
number of requests per sessions and number of distinct
ses-sion types, as well as(ii.)a request-based metric, namely the
relative invocation frequency of all request types. Note that due to the nature of the SPECjEnterprise2010 workload we do not consider timing-related metrics such as think times or arrival rates, even though they are correctly extracted and executed by our approach. Conclusions about the arrival rates of requests can be drawn by looking at the invocation frequencies of requests.
6.2
SPECjEnterprise2010 Deployment
SPECjEnterprise2010 is a Java EE application representing a business case that combines customer relationship manage-ment (CRM), supply chain managemanage-ment (SCM), and manu-facturing. It includes a workload specification and a dataset needed for the execution of load tests. The workload is
gen-erated by the Faban Harness and Benchmark Driver.5 The
benchmark consists of three different application domains,
namelyOrders domain(CRM),Manufacturing domain, and
4SPECjEnterprise is a trademark of the Standard Performance Evalu-ation Corp. (SPEC). The SPECjEnterprise2010 results or findings in this publication have not been reviewed or accepted by SPEC, there-fore no comparison nor performance inference can be made against any published SPEC result. The official web site for SPECjEnter-prise2010 is located at http://www.spec.org/jEnterSPECjEnter-prise2010.
5http://java.net/projects/faban/
login
view items
add to cart
shopping -cart
clear cart
remove
defer order purchase
cart
home
logout 0.67
0.11
0.12 0.10
0.66
0.34 0.61
0.18 0.21 login
inventory
cancel order
sell inventory
home
logout 0.48
0.02
0.5
0.23 0.77 login
view items
home
logout 0.93
0.07
purchase manage
browse
1.0
1.0
1.0
1.0
1.0 1.0
1.0
1.0 1.0 1.0
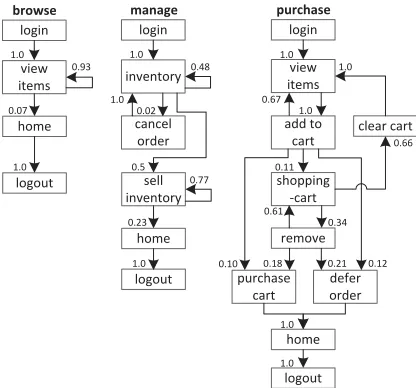
Figure 3: SPECjEnterprise2010 transactions as Behavior Models
Supplier domain (SCM). In this work we consider only the Orders domain, which represents a typical web-based application that provides e-commerce functionality to the customers—in this case automobile dealers. The customers are able to purchase and sell cars, to manage their accounts and dealership inventory, and to browse the catalogue of
cars. The Orders domain represents the SUT.
6.2.1
Workload Description
SPECjEnterprise2010 defines three different transaction types
which are executed by automobile dealers:Browse (B),
Man-age (M), andPurchase (P). Within Browse, the benchmark driver navigates to the catalogue of available cars and browses the catalogue for a constant number of times. Manage de-scribes a scenario where open orders are canceled and ve-hicles are sold. In the more complex transaction type Pur-chase, orders are placed and immediately purchased or de-ferred. The shopping cart is either cleared or items are re-moved one by one until only one item remains. Each of these
transaction types is a sequence of HTTP requests. In
to-tal, 13 different HTTP request types are defined. Within the transactions, no think times are defined, i.e., each HTTP ac-tion is executed directly after its previous request has been completed. Therefore, the evaluation of think times extrac-tion is out of scope for this paper. Figure 3 depicts the structure of the three transaction types as Behavior Models
obtained by applying ourWessbasextraction approach.
In the original benchmark workload, automobile dealers log
in to the system, execute multiple instances of the three
transactions types, and log out. Each of the three trans-action types is executed with a specified probability. The standard transaction mix is 50% Browse, 25% Manage, and
25% Purchase. We modified the dealer driver such thateach
transaction starts with a login and ends with a logout. This way each transaction corresponds to a unique session, and the transaction mix corresponds to the Behavior Mix.
6.2.2
Benchmark Execution and Monitoring
Three different transaction mixes are used to evaluate the proposed approach. For each mix, one of the transaction types is executed with a probability of 50% and the other two with 25% each. A load of 800 concurrent users is exe-cuted, resulting in a moderate CPU utilization of the SUT of approximately 40%. Each benchmark run is executed for ten minutes after a four minute ramp-up phase and before a four minute ramp-down phase.
In order to obtain the raw session information, the SUT was instrumented using Kieker [15]. For each request the requested URL, the query string, the session ID, and the server-side entry and exit timestamp are recorded. After-wards, the raw log data is transformed to a session log. During the transformation, the sessions within the ramp-up and ramp-down phase are not taken into account. In order to be able to evaluate the clustering results of the trans-action types, the name of the transtrans-action type is added as additional parameter to the login HTTP action.
6.3
Accuracy of Clustering
The evaluation of clustering accuracy (RQ 1) is split into two steps. In the first step, the accuracy of the clustering is determined based on the assumption that the number of resulting clusters is known in advance. For this reason, the number of resulting clusters is fixed to three. As the num-ber of clusters is usually not known in advance, we let the X-means algorithm determine the number of clusters in a second step. As the seed value for the random selection of the initial centroids can have a high impact on the clustering results, multiple clustering runs with different seed values between one and twelve are executed. Afterwards, the run with the lowest sum of squared error value [9] is selected.
The results of the clustering are presented in Table 2. For each transaction mix (TM), the clustering shows for each
transaction type (T) the cluster (Cx) where a transaction is
assigned to, and the percentage of misclassified (MC) trans-actions. The left side shows the results of exactly three pre-defined clusters (step one); the right side shows the results letting X-means determine the number of clusters between two and twenty (step 2). The number of transactions (N)
clustered for each transaction mix is around 61,000.
The results using exactly three clusters indicate that the clustering using normalized Euclidean distance (NED) is able to cluster all transactions correctly (100%) resulting in the Behavior Models shown in Figure 3. The clustering using Euclidean distance (ED) without normalization classifies the transactions Browse and Manage correctly, whereas a frac-tion of transacfrac-tions of type Purchase is assigned mistakenly to the same cluster as the Manage transactions. In the sec-ond transaction mix, the fraction of Purchase transactions is higher than in the other mixes. Hence, the percentage of
misclassified transactions is with 15.98% relatively high.
The clustering without predefining the correct number of clusters, results in two clusters using ED and four clusters using NED. As clustering with ED always merges transac-tions of type Purchase and Manage, the percentage of
mis-classified transactions is around 25% for all mixes. It is
assumed that the transaction type with the lower number of
Table 2: Clustering Results
X-means (min 3 cluster, max 3 cluster) X-means (min 2 cluster, max 20 cluster)
ED NED ED NED
TM T C1 C2 C3 MC C1 C2 C3 MC C1 C2 MC C1 C2 C3 C4 MC N
50 B 0 0 31,060
2.91%
0 31,060 0
0%
0 31,060
24.62%
0 0 0 31,060
1.03% 61,500
25 M 15,298 0 0 15,298 0 0 15,298 0 632 14,666 0 0
25 P 1,789 13,353 0 0 0 15,142 15,142 0 0 0 15,142 0
25 B 15,091 0 0
15.98%
15,091 0 0
0%
0 15,091
24.96%
0 15,091 0 0
15.30% 60,089
25 M 0 0 15,000 0 15,000 0 15,000 0 0 0 707 14,293
50 P 0 20,397 9,601 0 0 29,998 29,998 0 21,513 8,485 0 0
25 B 0 15,231 0
2.99%
15,231 0 0
0%
0 15,231
25.16%
0 0 0 15,231
1.86% 61,118
50 M 30,510 0 0 0 30,510 0 30,510 0 29,375 1,135 0 0
25 P 1,824 0 13,553 0 0 15,377 15,377 0 0 0 15,377 0
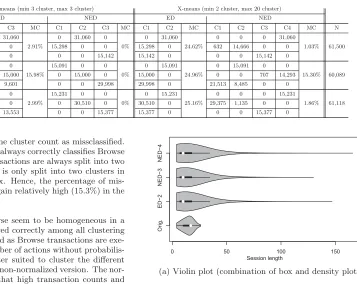
instances merged within one cluster count as missclassified. The clustering using NED always correctly classifies Browse transactions. Manage transactions are always split into two clusters whereas Purchase is only split into two clusters in the second transaction mix. Hence, the percentage of
mis-classified transactions is again relatively high (15.3%) in the
second transaction mix.
Transactions of type Browse seem to be homogeneous in a way that they were clustered correctly among all clustering runs. This can be explained as Browse transactions are exe-cuted with a constant number of actions without probabilis-tic behavior. NED is better suited to cluster the different transaction types than the non-normalized version. The nor-malization has the effect that high transaction counts and therefore also the length of the sessions has a lower impact on the clustering. Thus, the structure of the transactions in terms of the number of different HTTP requests grows in significance. As each of the three transaction types consist of different HTTP request types (except for login, home and logout), the clustering results are significantly better.
6.4
Accuracy of Workload Characteristics
To evaluate the accuracy of the extracted workload speci-fications (RQ 2), we compare the server-side session-based and request-based metrics mentioned in Section 6.1 for the original measurements with the corresponding metrics ob-tained by executing extracted workload specifications using JMeter. Due to space limitations, we present only the re-sults of the original benchmark Behavior Mix (25% P, 50% B, and 25% M), using the X-means clustering algorithms results with 2 (ED), 3 (NED), and 4 (NED) clusters (entries for the bottom TM in Table 2). The original workload
in-cludes 61,500 sessions and 847,927 HTTP requests. These
numbers served as an approximate stopping criteria during the execution of the synthetic workload with JMeter (cf. Figure 4b and Figure 5b).
6.4.1
Session Length and Distinct Sessions
Statistics about the session length distributions of the origi-nal and the three synthetic workloads are listed in Figure 4. Looking only at the mean values and the 0.95 confidence in-terval (Figure 4b), one may conclude that the session length distributions of the three synthetic workloads exactly match the distribution of the original workload. However, partic-ularly the violin plot (Figure 4a) indicates that the syn-thetic distributions are similar but differ considerably from
0 50 100 150
Or
ig.
E
D−2
N
ED−3
NED−4
● ● ● ●
Session length
(a) Violin plot (combination of box and density plot)
Min. Q1 Med. Mean CI0.95 Q3 Max. N
Orig. 4 10 17 14.23 [14.19,14.26] 17 26 61,500
ED-2 4 7 10 14.24 [14.15,14.33] 18 147 60,957
NED-3 4 7 10 14.24 [14.15,14.33] 18 130 62,054
NED-4 4 7 10 14.26 [14.17,14.35] 18 166 59,971
(b) Summary statistics
Figure 4: Session length statistics for the original workload (Orig.) and the synthetic workloads (ED-2, NED-3, NED-4)
the original workload. The quartile-based statistics in Ta-ble 4b confirm this observation. It can be observed that for the synthetic workloads, very long sessions are generated. While for the original workload the longest sessions com-prise 26 requests, the synthetic sessions reach maximums of 147, 130, and 166. Looking at the individual session lengths, 11% of the synthetic sessions are longer than the longest ses-sions of the original workload.
In the original workload, we identified 78 distinct sessions. The number of distinct sessions in the synthetic workloads is
considerably higher, namely 2,126 (2 clusters), 2,144 (3
clus-ters), 1,996 (4 clusters). The relatively low number of
dis-tinct session types is caused by the fact that the original SPECjEnterprise2010 workload contains only few probabilis-tic elements, which are all bounded in the number of max-imum iterations. Hence, the maxmax-imum number of possible distinct sessions is countable. After having described the session length distributions of the synthetic workloads, the high number of distinct sessions is not surprising. Inspect-ing the structure of the synthetic sessions, we observed the
following recurring patterns:(i.)sell inventory+,(ii.)
home remove defer order view items clear cart cancel order shopping cart add to cart logout inventory login sell inventory purchase cart
0.0 0.1 0.2 0.3 0.4 0.5
(a) Relative counts (common to all workloads)
Request Orig. ED-2 NED-3 NED-4 Rel.
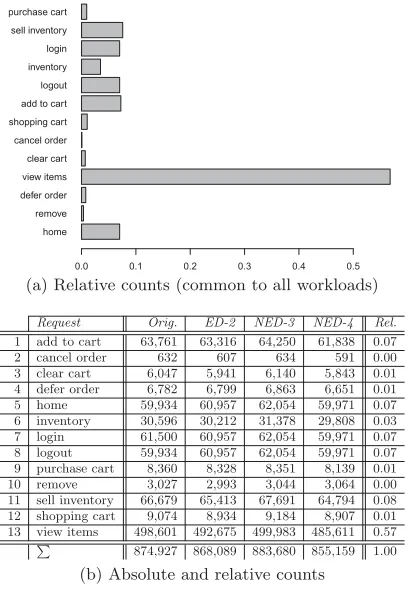
1 add to cart 63,761 63,316 64,250 61,838 0.07 2 cancel order 632 607 634 591 0.00 3 clear cart 6,047 5,941 6,140 5,843 0.01 4 defer order 6,782 6,799 6,863 6,651 0.01 5 home 59,934 60,957 62,054 59,971 0.07 6 inventory 30,596 30,212 31,378 29,808 0.03 7 login 61,500 60,957 62,054 59,971 0.07 8 logout 59,934 60,957 62,054 59,971 0.07 9 purchase cart 8,360 8,328 8,351 8,139 0.01 10 remove 3,027 2,993 3,044 3,064 0.00 11 sell inventory 66,679 65,413 67,691 64,794 0.08 12 shopping cart 9,074 8,934 9,184 8,907 0.01 13 view items 498,601 492,675 499,983 485,611 0.57
874,927 868,089 883,680 855,159 1.00
(b) Absolute and relative counts
Figure 5: Request count statistics
tory+,(iii.)view items+,(iv.)(view items, add to cart)+,
(v.)(view items, add to cart, shopping cart, clear cart)+.
These patterns can be explained by the corresponding tran-sitions with high probabilities already indicated by the prob-abilities of the original workload depicted in Figure 3.
Considering the setting for SPECjEnterprise2010, the fol-lowing conclusions can be drawn about the impact of the clustering results on the session-based metrics session length and number of distinct session types. No statistically signif-icant differences between the synthetic workloads for 2, 3, and 4 clusters can be observed. Both the session length dis-tributions and the number of distinct sessions deviate from the characteristics of the original workload. The deviation of the session length distributions is mainly caused by a num-ber of synthetic long sessions. The mean value shows no statistically significant difference.
6.4.2
Request Counts
Figure 5 depicts statistics about the frequency of invoked requests. Based on the absolute numbers of requests to the 13 SPECjEnterprise2010 request types. We computed the relative frequencies for the original workload and the three synthetic workloads. An exact match of the relative fre-quencies could be observed. That is, the deviation, e.g., in form of the sum of squared errors, is zero. Hence, from the server-perspective, the synthetic workloads provide repre-sentative workloads in terms of the distributions of requests. A barplot, which looks the same for each of the four work-loads, is shown in Figure 5a.
7.
CONCLUSION AND FUTURE WORK
In this paper, we presented ourWessbasapproach for the
systematic extraction and specification of probabilistic work-loads for session-based systems including a transformation to the load testing tool Apache JMeter. To address the chal-lenge of specifying workloads for different workload tools, we first introduced a domain-specific language that describes the structure of a workload in a generalized way. Addition-ally, we demonstrated how groups of customers with similar behavioral patterns can be identified using clustering algo-rithms. Finally, the evaluation with the standard industry benchmark SPECjEnterprise2010 demonstrated the practi-cality and high accuracy of the proposed approach.
As future work, we plan to further automate the genera-tion of Applicagenera-tion Models, including Protocol Layer and test data, as well as automatic learning of guards and ac-tions [12]. We want to extend the set of supported logging
formats and load testing tools. The measurement-based
approach will be combined with model-based performance evaluation approaches [16] by generating workload speci-fications of performance models from WESSBAS-DSL in-stances. Moreover, the evaluation of other clustering algo-rithms and the integration of approaches for the generation of varying workload intensities [13] will be investigated.
8.
REFERENCES
[1] P. Barford and M. Crovella. Generating representative web workloads for network and server performance evaluation. In Proc. SIGMETRICS ’98, pages 151–160, 1998.
[2] P. Berkhin. A survey of clustering data mining techniques. In Grouping multidimensional data, pages 25–71. Springer, 2006. [3] A. Brunnert, C. V¨ogele, A. Danciu, M. Pfaff, M. Mayer, and
H. Krcmar. Performance management work.Business & Information Systems Engineering, 6(3):177–179, 2014. [4] M. Hall, E. Frank, G. Holmes, B. Pfahringer, P. Reutemann,
and I. H. Witten. The WEKA data mining software: An update.ACM SIGKDD Explor. Newsletter, 11(1):10–18, 2009. [5] R. Jain.The Art of Computer Systems Performance Analysis.
John Wiley & Sons, New York, 1991.
[6] D. Krishnamurthy, J. A. Rolia, and S. Majumdar. A synthetic workload generation technique for stress testing session-based systems.IEEE TSE, 32(11):868–882, 2006.
[7] D. A. Menasc´e. Load testing of web sites. InIEEE Internet Computing, pages 70–74, 2002.
[8] D. A. Menasc´e, V. A. F. Almeida, R. Fonseca, and M. A. Mendes. A methodology for workload characterization of e-commerce sites. InProc. EC ’99, pages 119–128, 1999. [9] D. Pelleg, A. W. Moore, et al. X-means: Extending K-means
with efficient estimation of the number of clusters. In ICML ’00, pages 727–734, 2000.
[10] E. Schulz. Integrating performance tests in a generative software development platform, 2014. Master’s Thesis, Kiel University, Germany.
[11] E. Schulz, W. Goerigk, W. Hasselbring, A. van Hoorn, and H. Knoche. Model-driven load and performance test engineering in DynaMod. InProc. MMSM ’14, pages 10–11, 2014. [12] M. Shams, D. Krishnamurthy, and B. Far. A model-based
approach for testing the performance of web applications. In Proc. SOQUA 2006, pages 54–61. ACM, 2006.
[13] J. v. Kistowski, N. R. Herbst, and S. Kounev. Modeling variations in load intensity over time. InProc. LT ’14, pages 1–4. ACM, 2014.
[14] A. van Hoorn, M. Rohr, and W. Hasselbring. Generating probabilistic and intensity-varying workload for web-based software systems. InProc. SIPEW ’08, pages 124–143, 2008. [15] A. van Hoorn, J. Waller, and W. Hasselbring. Kieker: A
framework for application performance monitoring and dynamic software analysis. InProc. ICPE ’12, pages 247–248, 2012. [16] C. V¨ogele, A. Brunnert, A. Danciu, D. Tertilt, and H. Krcmar.
Using performance models to support load testing in a large SOA environment. InProc. LT ’14, pages 5–6. ACM, 2014.
Acknowledgment:This work has been supported by the Research Group of the Standard Performance Evaluation Corporation (SPEC).