Impact of Fiscal and Monetary Policies on Stock Market Performance:
An Empirical Study of Pakistan Stock Exchange
Shahida Perveen∗ Mustaghis-ur-Rahman†
Abstract: The purpose of this study is to investigate the impact of fiscal and monetary policies on stock market performance along with the identification of moderating role of political stability in Pakistan. Data of Pakistan stock exchange for last 36 years (1981 to 2016) has been analyzed by applying multiple analyt-ical methods. First, Stationary analysis has been performed through Augmented Dickey Fuller (ADF) and Phillips-Perron (PP) unit root tests. Based on its findings, confirmation of long run relationship has been done through Johansen co-integration analysis. The study has employed ordinary least square method (OLS) of regression analysis to analyze the nature of relationship in long run. Afterwards Error correction model has been used for analyzing short run relationship and Causal relationship has been tested through granger casualty test. The findings of research indicate the existence of long run relationship between both policies and stock market performance, while short run relationship exists only between monetary policy measures and stock market performance. Research also reveals that the Government expenditures, budget deficit and money supply reflect significant positive impact, while tax revenue and interest rate depict significant neg-ative impact on stock market capitalization in the long run. Further, political stability moderates only the relationship between interest rate and stock market capitalization, while other relationships are not moderated by political stability.
Keywords: Stock market performance, fiscal policy, monetary policy, political stability
Introduction
The development and stability of stock market affect economy as a whole. The roles that stock markets play in the economy are raising capital, mobilizing savings for in-vestments, providing investment opportunities in a well governed and regulated envi-ronment, bringing companies and investors together and act as a barometer of economy. According to Filis(2010), stock market is a best gauge of future economic happenings. Considering the role that stock market plays in economic development and growth, its own growth and stability becomes crucial. Therefore, it is very important to look into the forces that drive the stock market performance. By identifying those factors and making strategies, stock market performance can be improved by consequently triggering eco-nomic growth. The stock market’s performance may be influenced by external as well as internal factors (Dragni´c,2014). Among other factors, the performance of stock market is also affected by government policies including fiscal and monetary policy (Asongu,2012).
∗
MS Finance Scholar, Department of Management Sciences, Bahria University, Karachi. E-mail: shahidafast@yahoo.com
†
Professor and Head of the Management Science Department, Bahria University, Karachi Campus.
Government uses these policies for regulating the economy. These policies also influence stock market for being an important part of financial sector, either directly or indirectly. Considering the influence that these government policies may have on stock market per-formance, there is a need to understand the dynamics of these policies and how these policies may affect the stock market performance.
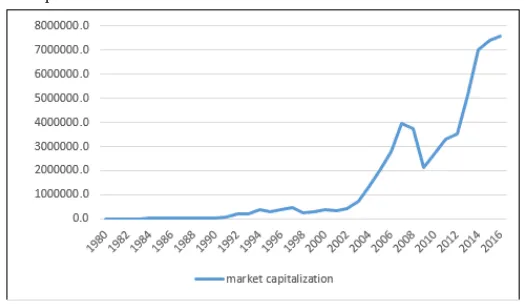
The magnitude and nature of impact vary from economy to economy depending on specific dynamics of that economy. Before analyzing the impact of government policies including fiscal and monetary policy on stock market performance in Pakistan, specific dynamics of Pakistani market need to be understood along with fiscal and monetary poli-cies as pursued by the government of Pakistan. Karachi stock exchange, Pakistan’s first stock market was established in 1947. Only 5 companies were registered with KSE at that time. Later on, Lahore stock exchange and Islamabad stock exchange were established in 1974 and 1997 respectively. In 2016, all three exchanges were merged into one i.e. Pakistan stock exchange. Currently, exchange has 559 companies listed with market capitalization of USD 72.3 billion (PSX).The performance of Karachi stock exchange can be seen through stock market capitalization over the years in figure 1.
Figure 1
Market capitalization
The stock market capitalization has been on an increase till 2008, when it shows de-crease which may be attributed to various sanctions because of atomic tests and global financial crisis. But from 2009 onwards, market capitalization again started to increase.
Figure 2
Fiscal policy
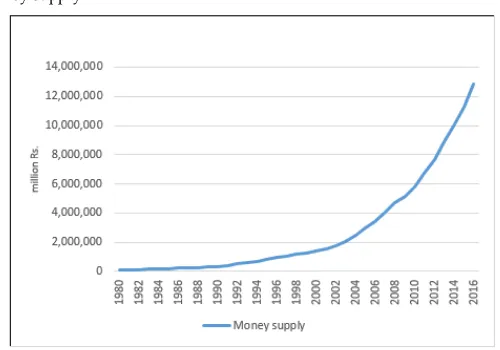
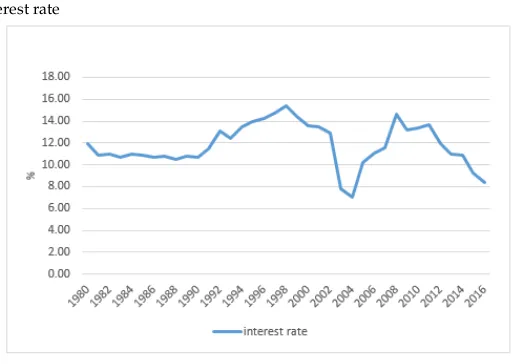
In Pakistan, development and execution of monetary policy is the responsibility of state bank of Pakistan. SBP uses various instruments to control interest rate and money supply in economy with the aim of monetary stability. Pakistan’s monetary policy can be seen through figure 3 and 4. Money supply is depicting an increase, while interest rate is showing fluctuations over the observed period.
Figure 3
Figure 4
Interest rate
The purpose of this study is to investigate the impact of fiscal and monetary poli-cies on stock market performance along with identification of moderating role of political stability in the context of Pakistan. Thematically, study covers very important aspect of economics and finance i.e. stock market and government policies. Geographically, study spreads over whole stock market of Pakistan. Given the role of stock market in socio-economic development of country, it is necessary to academically investigate the possible influence of policy decisions on stock market performance. Further, the role that political stability plays in the performance of stock market need to be identified. The findings of such an investigation will help investors and policy makers for better decision making. If the impact of these policies is not researched, it may result in wrong decisions by in-vestors and policy makers. The relationship between monetary policy actions and stock market performance have widely been studied across the globe including Pakistan. How-ever, no research could be found that has attempted to explore influence of fiscal policy and combined impact of both fiscal and monetary policy on stock market performance in the context of Pakistan. Further, influence of political stability on relationship of govt. policies and market performance need to be analyzed, given the continuous changing political situation in Pakistan. This research attempts to fill the void identified.
Literature Review
Theoretical background and empirical studies related to the area of research have been explored for the development of theoretical framework and underpinning of empirical studies to provide the basis of conceptual framework and hypothesis formulation as fol-lows:
Theoretical Background
The effectiveness of fiscal and monetary policies in economy and determinants of stock market performance has always remained an area of interest for financial economists. Response of the stock market to variations in government policies has got its roots in the “theory of efficient market hypothesis” devised by Professor Eugene Fama. EMH states that asset pricing truly imitates available information. Thus, as per the theory, stock prices fully reflect all existing information including fiscal and monetary policy stances (Fama,
1995). Critics considered this belief among investors as a reason of financial crisis of late 2000s (Fox & Sklar,2009;Nocera,2009;Lowenstein,2011).
The Laissez-faire economist gained popularity in 18th century. They denied the need to complicate business and economic issues through governmental interventions like leg-islations, policies and restrictions. In such a free economy, there is a little influence of the government policies on stock market performance and stock market performance is depiction of individual investors’ behavior only. However, laissez-faire is not with-out criticism. Generally, it is criticized for less protection of weaker segment of society. It was largely criticized by a John Maynard Keynes, a famous economist from Britian (Dostaler et al.,2007). He emphasized role of govt. policies in directing the economies. In government controlled economy, stock market is also influenced by government policies (Asongu,2012).
Economic theories have diverse opinions on possible influence of govt. policies on performance of stock market in an economy. Some theorists argued that the government policy actions have no impact on the stock market performance, while others insisted on the existence of government policies’ effect on performance of the stock market. Former view is Ricardian equivalence proposition, which states that rational individuals is ca-pable of anticipating tax burden, expected because of current and expected deficits, and thus fully utilize it in current decision making (Barro,1974). So investors would not ad-just their investments based on current policy statements, as they are aware of the future increase in taxes based on deficits (Davidson & Froyen,1982).
Contrary to the Ricardian equivalence Hypothesis,Tobin(1969) andBlanchard(1981) like many claimed that government stances including fiscal and monetary policy affect market performance. General equilibrium approach to monetary theory was presented by
per-formance. If at all fiscal policy actions can be predicted by investors, they can still affect stock market performance due to the judgment and application lag.
Monetarists and Keynesians have different opinions on the relative effectiveness of the two policies. Both monetarists and Keynesians agree on the role of aggregate demand in the business cycles but they disagree on the use of either fiscal policy actions or the monetary policy actions to control the aggregate demand and ultimately the economic activity. Keynesians favored government interventions through both fiscal and monetary policies, while monetarists supported only the role of monetary policy (Abel & Ben,2005). The issue was largely settled in 1980s, when economists largely agreed on the role of central bank for steering the economy. But financial crisis of 2007-08 convinced many for the use of fiscal policy tools together with monetary policy to trigger economy (Henry & John,2012).
Empirical Studies
Empirical studies on the current area of investigation have been carried out around the world.
Wanjiru (2000) analyzed influence of monetary and fiscal policy actions on perfor-mance of Kenyian stock market based on time series data from 1990 - 2000. Growth rate of money and money supply are the monetary policy variables, while growth in budget deficit is fiscal policy variable. NSE-20 Share Index has been used to measure Nairobi stock exchange performance. The empirical results show that monetary policy positively influences stock market, while fiscal policy actions have not affected stock market.
Anderson (2003) proposed to examine financial markets performance as a result of monetary & fiscal policy decisions by comparing 47 countries, focusing on the year 1999. The researcher selected six dependent variables namely market capitalization, turnover, liquidity, private domestic credit, domestic savings and FDI. The independent variables are interest rate, CPI, corporate taxation, and exchange rate. Regression analysis has been performed on all models and results conclude that monetary as well as fiscal policy influ-ence stock markets’ performance.
Laopodis (2009) explored the dynamic linkages of fiscal and monetary policy with stock market of United States over the period 1960 - 2004 based. Results suggest that budget deficit affects stock market and stock markets are affected more by changes in taxation as compared to the changes in government spending. An increase in interest rate lowers stock returns, which lowers profits and tax revenue. Results also indicate a positive response to money supply, while taxes revenues are more influential than government spending.
Al-Shiab(2008) investigated influence of monetary and fiscal policies on Amman stock exchange by VAR method based on 20 years annual data from 1978 to 2004. Stock market capitalization, money supply and govt. expenditures have been used to measure stock market performance, monetary and fiscal policy, respectively. Analysis showed that mar-ket capitalization is influenced more by money supply as compared to govt. expenditures, although both affect market capitalization positively.
South Africa based on quarterly data over the period 1980 - 2010. Researcher has con-cluded that GDP, money supply and United States stock market affect stock market in South Africa positively. While, budget deficit, interest rate, exchange rate, CPI, and United States T. bonds return affect stock market index negatively.
Geraldo(2011) explored the impact of fiscal and monetary policies on stock market of Ghana. GSE index has been used as dependent variable. Government expenditure as fiscal policy indicator and lending rate as monetary policy indicator are independent variables. Empirical evidence shows that fiscal policy changes significantly and hence af-fecting stock market of Ghana, but stock market performance does not affect fiscal policy decisions.
Antwi, Zhao, and Mills(2013) explored efficiency of stock market in Ghana towards fiscal and monetary policy decisions based on data from 1990 to 2010. Focus variables of study are Government expenditure, lending rate and stock index. While, CPI and surplus return are control variables. Analysis indicates that stock market performance is significantly influenced by fiscal policy actions. Similarly, lending rate as monetary policy action show negative relationship with stock market performance.
Chatziantoniou, Duffy, and Filis(2013) explored dynamic association between fiscal and monetary policy actions and stock market. Countries used for current study are Germany, UK and US. Researcher has used ARDL model to analyze data for the period 1991 -2010. Variables considered in the model are GDP, CPI, government expenditures, money supply, fund rate and equity market returns. Analysis concludes that stock market is influenced both directly and indirectly by fiscal and monetary policy stance.
Cheng and Sun(2013) attempted to measure the effect of fiscal and monetary policy actions on equity markets of U.S., Sweden and China. Aim of researchers was to find out the existence and nature of stock market response towards policy actions and to make comparison of results in case of three countries during the financial crisis of 2007-2009. The results show that stock markets of all countries responded differently to policy ad-justments during financial crisis.
Handoyo, Jusoh, and Ziadi (2013) analyzed effect of monetary and fiscal policy on capital market of Indonesia by using both composite and sector indices. Variables used are GDP, government Debt, CPI, interest rate, exchange rate, equity prices in composite and sector indices and oil price. Researcher has determined correlation between mon-etary policy and stock market as negative, also different sectors depicted different level of response. While, in case of fiscal policy actions and stock market, researchers found homogeneous positive relationship in all sectors and in composite index as well.
Hsing (2013) examined the relationship between fiscal and monetary policy actions and stock market in Poland for the period 1999 – 2012. Findings show that market index in Poland is not influenced by fiscal deficits or government debt, but it is negatively af-fected by interest rate and positively by money supply. Moreover, stock market depicted a positive association with economic production and markets in Germany and US and negative association with exchange rate and CPI.
of fiscal policy. Findings indicate negative long run impact of interest rate and inflation, while money supply shows a short run positive association with SEMDEX. Short run and long run association was found for deficit and SEMDEX.
Shahbazi, Rezaei, and Abbasi(2014) scrutinized empirical association between fiscal and monetary policies and equity returns of Iranian market based on data for the period 1999-2008. Variables used are tax to GDP ratio, govt. expenditure to GDP ratio, Interest rate, Money supply and Inflation. Analysis shows that stock return is affected by the government expenditures and taxes. Further, lags of money supply have no effect on stock return, while policy rate affects stock return negatively.
Bhatti, Ziaei, and Rehman (2015) explored the impact of monetary and fiscal policy actions on stock market in Malaysia. Variables have been selected through four straits namely global, property, fiscal and monetary policy which are oil and gold price, housing price, govt. expenditures and interest rate and exchange rate. The ARDL results conclude that stock returns are positively influenced by oil prices, while gold is used to minimize the risk associated with stocks. Further, study could not find an impact of govt. spending and policy rate on stock returns.
Hafezi and Shahandeh(2015) explored impact of monetary and fiscal policies on Tehran stock market for period 2006-2012. The impact of money supply and exchange rate as monetary policy tools and government expenditures as fiscal policy tool on stock market was empirically analyzed. Analysis show that money supply negatively impacts stock market index. Further, govt. expenditures have significant influence on stock market index and exchange rate negatively impacts stock market index.
Namini and Nasab(2015) investigated the impact of monetary and fiscal policy on Iran’s stock market. GDP, oil revenues, CPI, government expenditure, money supply, and stock exchange index have been used. Data was employed from 1991 to 2010 and Impulse response and variance decomposition model were employed for analysis. Results indicate that monetary and fiscal policies positively affect stock market directly or indirectly.
Mbanga and Darrat(2016) empirically explored the impact of fiscal and monetary pol-icy on US equity revenues both in long run and short run for duration of 1960 to 2010. Re-searcher measured fiscal policy by federal budget deficit, monetary policy by federal rate and stock returns by S&P 500 index. Results of analysis confirms long run co-integration of equity prices with fiscal deficit, interest rate and industrial production. Monetary base and inflation show no effect on stock return in long run.
Barbi´c and ˇCondi´c-Jurki´c(2017) investigated impact of macroeconomic factors on stock returns of EU countries based on data from 2000 to 2012. The association was explored between equity returns and fiscal and macroeconomic variables like government debt, government expenditures, CPI, money supply, interest rate, foreign exchange reserve and foreign direct investments. Empirical analysis found correlation between CPI, interest rate and equity market returns for developed EU stock market. While, emerging markets prove to be more vulnerable to fiscal developments.
index. Findings confirmed the influence of monetary and fiscal policy actions on equity returns of Vietnamese stock market.
Hu, Han, and Zhang(2018) explored the impact of monetary and fiscal policy shocks on the stock market in China. The researchers have also analyzed the interaction of fiscal and monetary policies. The findings of the research show a negative synchronous rela-tionship between fiscal policy and stock market performance in China, while the impact of monetary policy was found to be dependent on the fiscal policy.
In the context of Pakistan, no research work could be found that has investigated im-pact of fiscal policy on stock market performance. However, some studies conducted in the context of Pakistan aimed at analyzing the impact of monetary policy on stock market performance. Hasan and Javed(2009) investigated long run association of stock prices with monetary policy. Ahmad, Rehman, and Raoof(2010) analyzed the impact of inter-est and exchange rate on equity revenues in Pakistan. Qayyum and Anwar(2011) also investigated the connection between monetary policy and stock market in Pakistan. Ali and Javaid(2014) investigated the stock return of the manufacturing sector in Pakistan stock market with respect to shocks in monetary policy. The findings of these research works show that monetary policy decisions significantly affect the stock market of Pak-istan. Knowing the effect of monetary policy based on existing studies in Pakistan, there is a need to explore the influence of fiscal policy and combined impact of both fiscal and monetary policy on stock market performance in the context of Pakistan. Further, influ-ence of political stability on relationship of govt. policies and market performance need to be analyzed, given the continuous changing political situation in Pakistan.
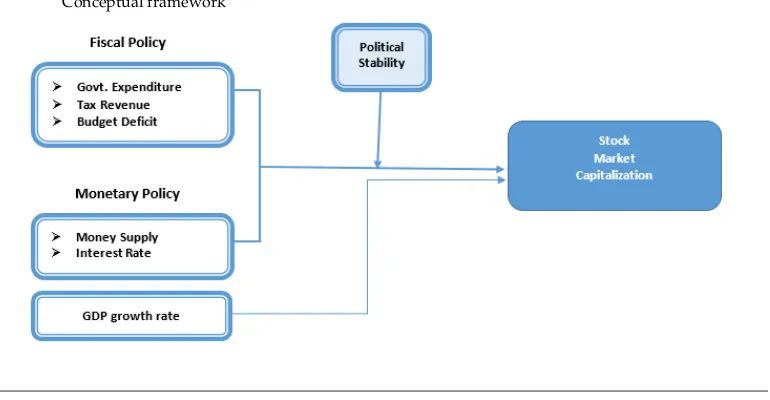
Conceptual Framework
Based on theoretical background and literature underpinning, below is the given concep-tual framework has been developed which includes stock market capitalization as
depe-Figure 5
-ndent variable and government expenditures, tax revenue, budget deficit, Interest rate, money supply, GDP growth rate as Independent variable with Political stability as mod-erating variable.
Methodology
The research covers the stock market of Pakistan and behavior of Pakistan stock exchange in response to changes in fiscal and monetary policies of the country. It is a longitudi-nal study of time series type and explanatory by nature. Annual data of 36 years from 1981 to 2016 has been used. Data has been collected through reliable and authentic sec-ondary data sources which include Pakistan stock exchange data portal, SBP data portal, economic survey of Pakistan, fiscal policy statements, Polity IV index and World Bank data portal. Stock market performance has been measured by stock market capitaliza-tion, as used by many researchers likeOnyeisi and Anoke(2016)Owederu, Oppong, and Asomaning(2016) andBayar(2016). Monetary policy has been measured by interest rate and money supply as used byBhatti et al.(2015),Haitsma, Unalmis, and de Haan(2016) andBarbi´c and ˇCondi´c-Jurki´c(2017). Interest rate is weighted average rate of return on advances as proxy of policy rate of the state bank of Pakistan and money supply is M2 which includes currency and near money. Fiscal policy has been measured by govern-ment expenditures, tax revenue and budget deficit as used by Foresti and Napolitano
(2016),Thanh et al.(2017) andMumtaz, Theodoridis, et al.(2017). Further, for moderat-ing variable of political stability, Polity IV index has been used, as bemoderat-ing widely used in political sciences research. Polity IV has implied information on the status of democracy in country and this information is developed on the basis of country’s election system for openness and competitiveness, specifications of political involvement and check and bal-ance on the ultimate deciding body. A polity score has been determined by the index for every country for each year. This score was originated by Ted Robert Gurr in 1960s and is now carried on by Gurr’s student, Monty G. Marshall (Polity IV).
run co-integration analysis. Further, causal relationship has been analyzed using Granger causality test.
In first step of Hierarchical regression, the following empirical model has been devel-oped:
LM CAP =α+β1(EXP G) +β2(T AXG) +β3(DEF G) +β4(IN T R) +β5(LM S)+
β6(GDP G) + (1)
Where, LMCAP is log of market capitalization. EXPG, TAXG and DEFG represents government expenditures, tax revenue and budget deficit as % of GDP, INTR is interest rate, LMS is log of money and GDPG is GDP growth rate.
In second step of Hierarchical regression, the following empirical model has been de-veloped:
LM CAP =α+β1(EXP G) +β2(T AXG) +β3(DEF G) +β4(IN T R) +β5(LM S)+
β6(GDP G) +β7(P S.EXP G) +β8(P S.T AXG) +β9(P S.DEF G) +β10(P S.IN T R)+
β11(P S.LM S) + (2)
Whereas, PS.EXPG, PS.TAXG, PS.DEFG, PS.INTR, PS.LMS are interacting variables of political stability with government expenditure, tax revenue, budget deficit, interest rate and money supply respectively.
Data Analysis
Following are the findings of the techniques applied and their interpretation.
Stationary Analysis
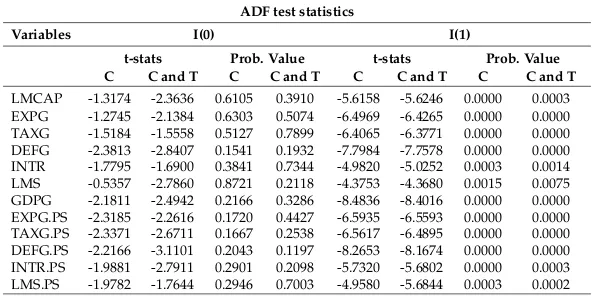
To find out whether data series are stationary or non-stationary, unit root test has been performed using Augmented Dickey fuller method and Philips-Perron method. Null hy-pothesis of unit root test is that data series is not stationary. Null hyhy-pothesis is rejected if Prob. value is less than 0.1 or t-stats calculated is less than target value at 10%significance level i.e., data for variable is stationary. Stationarity has been checked for all variables at level and first difference including the interacting variables of political stability. Test statistics are given in table 1 and 2 respectively.
of unit root test for stationarity of variables allow usage of variables data at level I(0) in regression analysis.
Table 1
Stationarity Test Results
ADF test statistics
Variables I(0) I(1)
t-stats Prob. Value t-stats Prob. Value C C and T C C and T C C and T C C and T LMCAP -1.3174 -2.3636 0.6105 0.3910 -5.6158 -5.6246 0.0000 0.0003 EXPG -1.2745 -2.1384 0.6303 0.5074 -6.4969 -6.4265 0.0000 0.0000 TAXG -1.5184 -1.5558 0.5127 0.7899 -6.4065 -6.3771 0.0000 0.0000 DEFG -2.3813 -2.8407 0.1541 0.1932 -7.7984 -7.7578 0.0000 0.0000 INTR -1.7795 -1.6900 0.3841 0.7344 -4.9820 -5.0252 0.0003 0.0014 LMS -0.5357 -2.7860 0.8721 0.2118 -4.3753 -4.3680 0.0015 0.0075 GDPG -2.1811 -2.4942 0.2166 0.3286 -8.4836 -8.4016 0.0000 0.0000 EXPG.PS -2.3185 -2.2616 0.1720 0.4427 -6.5935 -6.5593 0.0000 0.0000 TAXG.PS -2.3371 -2.6711 0.1667 0.2538 -6.5617 -6.4895 0.0000 0.0000 DEFG.PS -2.2166 -3.1101 0.2043 0.1197 -8.2653 -8.1674 0.0000 0.0000 INTR.PS -1.9881 -2.7911 0.2901 0.2098 -5.7320 -5.6802 0.0000 0.0003 LMS.PS -1.9782 -1.7644 0.2946 0.7003 -4.9580 -5.6844 0.0003 0.0002 Note: The critical values for ADF and PP tests with constant (C) and with constant and trend (C&T) at 1%, 5% and 10% level of significance are -3.711, -2.981, -2.629 and -4.394, -3.612, -3.243 respectively.
Table 2
Stationarity Test Results
Philips Perron statistics
Variables I(0) I(1)
t-stats Prob. Value t-stats Prob. Value C C and T C C and T C C and T C C and T
LMCAP -1.3182 -2.4478 0.6101 0.3503 -5.6151 -5.6244 0.0000 0.0003 EXPG -1.2196 -2.1063 0.6548 0.5245 -6.4930 -6.4223 0.0000 0.0000 TAXG -1.4699 -1.4913 0.5368 0.8135 -6.4082 -6.3784 0.0000 0.0000 DEFG -2.2492 -2.7370 0.1935 0.2289 -7.7884 -7.7421 0.0000 0.0000 INTR -1.9957 -1.8943 0.2873 0.6361 -4.9907 -5.0316 0.0003 0.0014 LMS -0.4961 -2.1315 0.8802 0.5111 -4.3976 -4.3975 0.0014 0.0070 GDPG 2.2024 1.9559 0.9999 1.0000 -8.6302 -8.5559 0.0000 0.0000 EXPG.PS -2.3170 -2.2493 0.1725 0.4491 -6.5927 -6.5620 0.0000 0.0000 TAXG.PS -2.5955 -2.4440 0.1034 0.3521 -6.5726 -6.5006 0.0000 0.0000 DEFG.PS -2.2492 -3.0287 0.1935 0.1392 -8.2713 -8.1852 0.0000 0.0000 INTR.PS -2.2315 -2.9602 0.1728 0.1573 -5.7319 -5.6801 0.0000 0.0003 LMS.PS -2.0136 -1.7631 0.2799 0.7009 -4.9547 -5.6841 0.0003 0.0002 Note: The critical values for ADF and PP tests with constant (C) and with constant and trend (C&T) at 1%, 5% and 10% level of significance are -3.711, -2.981, -2.629 and -4.394, -3.612, -3.243 respectively.
Co-integration Analysis
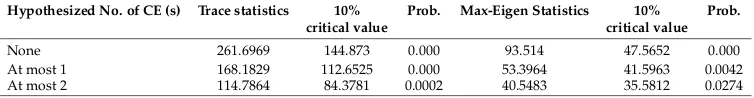
For analyzing the presence of long-run co-integration between the variables, Johansen and Juselius co-integration method has been employed, as results of stationary analysis fulfills condition of JJ co-integration which requires all variables to be non-stationary at level I(0), while stationary at first difference I(1). Tests employed for JJ co-integration method are Trace statistics and Maximum Eigen. Null hypothesis of JJ-co-integration analysis is that there does not exist a co-integration among variables in long-run. To test hypothesis, Trace statistics and Max-Eigen statistics are compared with relevant critical values at 10%significance level and if calculated values are greater than these values, null hypothesis is rejected. Table 3 depicts test stats along with critical values.
Table 3
JJ co-integration Test Results
Hypothesized No. of CE (s) Trace statistics 10% critical value
Prob. Max-Eigen Statistics 10% critical value
Prob.
None 261.6969 144.873 0.000 93.514 47.5652 0.000 At most 1 168.1829 112.6525 0.000 53.3964 41.5963 0.0042 At most 2 114.7864 84.3781 0.0002 40.5483 35.5812 0.0274
The results of co-integration analysis reject null hypothesis of co-integration at 10% significance level. Thus, long run integration is present between the variables. JJ co-integration analysis has confirmed existence of long run relationship between variables, but nature of relationship still remains to be identified. For this, Ordinary least square method of regression analysis has been employed in Hierarchical regression method.
Regression Analysis
The study has employed Hierarchical regression method in order to analyze impact of independent variables on dependent variable given the moderator based on the study of
Frazier et al.(2004). Ordinary least square method (OLS) of regression analysis has been employed in both steps to explore the nature of relationship and to quantify the impact in the presence of moderating variable.
Regression Analysis without Moderator Effect
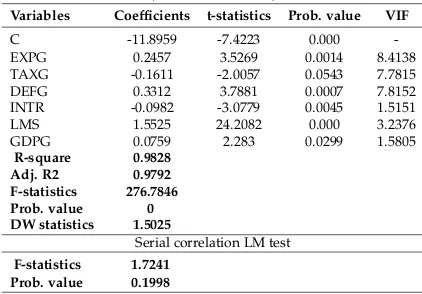
In first step of hierarchical regression analysis, ordinary least square method of regression analysis has been performed with the aim to ascertain the predictive powers of indepen-dent variables for depenindepen-dent variable. Table 4 depicts results of analysis along with VIF, Durbin-Watson and serial correlation LM test statistics.
strong fit in predicting association between variables. F-statistics depict significant com-bined impact of independent variables on dependent variable. VIF statistics for all regres-sors are less than 10 which eliminate presence of severe multi-colinearity among indepen-dent variables.
Table 4
OLS and VIF statistics (without moderator)
Variables Coefficients t-statistics Prob. value VIF
C -11.8959 -7.4223 0.000 -EXPG 0.2457 3.5269 0.0014 8.4138 TAXG -0.1611 -2.0057 0.0543 7.7815 DEFG 0.3312 3.7881 0.0007 7.8152 INTR -0.0982 -3.0779 0.0045 1.5151 LMS 1.5525 24.2082 0.000 3.2376 GDPG 0.0759 2.283 0.0299 1.5805
R-square 0.9828 Adj. R2 0.9792 F-statistics 276.7846 Prob. value 0 DW statistics 1.5025
Serial correlation LM test F-statistics 1.7241
Prob. value 0.1998
DW statistics and serial correlation LM test depicted auto-correlation, which has been removed by including variable of GDG in model. Thus, predictive power of independent variables for dependent variable has been confirmed.
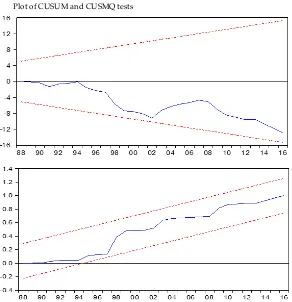
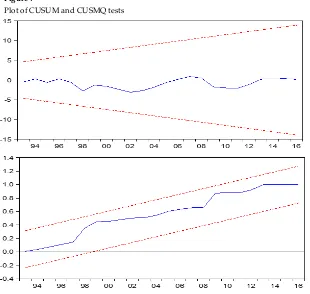
Model Stability Analysis (without Moderator Effect)
The model stability over the sample period has been analyzed through cumulative sum and cumulative sum of squares. The model that shows deviation of more than 5% is considered an unstable model. Figure 6 is the result of CUSUM and CUSMQ tests.
Results of both CUSUM and CUSUMQ tests depict that model statistics are within the interval bands i.e., model to analyze the predictive powers of independent variables is stable.
Regression Analysis with Moderator Effect
In the second step of hierarchical regression analysis, ordinary least square method of regression analysis has been performed after including the interacting variables of mod-erating variable and independent variables in previous model. The significance of each interaction term confirms the existence of moderation effect of political stability with re-spective independent variable. Further, it is confirmed by the change in the coefficients of independent variables (Namazi & Namazi,2016;MacKinnon,2011). Table 5 depicts results of regression analysis applied after inclusion of interaction terms in model.
of government expenditure, tax revenue, budget deficit, money supply and market capi-talization remain unaffected by political stability. Relationship between interest rate and market capitalization has been enhanced by moderating variable of political stability, as coefficient of interest rate has increased as compared to previous model. Further, adjusted R-square has improved, which shows increase in predictive power of the model.
Figure 6
Plot of CUSUM and CUSMQ tests
VIF statistics for all regressors are less than 10 which eliminate the presence of severe multi-colinearity among variables. DW statistics and serial correlation LM test have not depicted auto-correlation in the model.
Model Stability Analysis (with Moderator Effect)
Table 5
OLS and VIF statistics (with moderator effect)
Variables Coefficients t-statistics Prob. value VIF
C -10.3042 -5.5789 0.000 -EXPG 0.1962 2.5818 0.0164 5.7109 TAXG -0.1624 -1.8261 0.0803 1.202 DEFG 0.2383 2.4784 0.0206 1.0992 INTR -0.0668 -2.0268 0.0539 1.9007 LMS 1.5118 21.1742 0.000 4.7116 GDPG 0.0577 1.8027 0.084 1.7206 EXPG.PS -0.1429 -0.4898 0.6287 3.6521 TAXG.PS 0.1644 0.8327 0.4132 4.4614 DEFG.PS 0.022 0.1221 0.9038 1.1094 INTR.PS 0.1169 1.7346 0.0956 1.7066 LMS.PS -0.0834 -0.6746 0.5063 6.0613
R-square 0.9879 Adj. R2 0.9823 F-statistics 178.1752 Prob. value 0 DW statistics 1.7668
Serial correlation LM test
F-statistics 0.4914 Prob. value 0.4903
Figure 7
Plot of CUSUM and CUSMQ tests
tests depict that the model is stable.
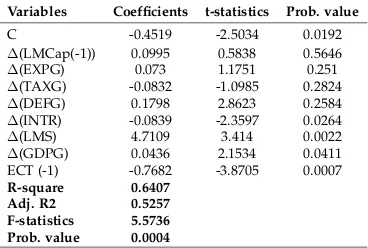
Error Correction Model
The presence of short run relationship between variables has been analyzed through Error correction model. To analyze short run co-integration,Hendry(1980) approach has been used that moves from general to specific and only the model that fits best is reported. The error correction model not only shows presence of short run relationship of variables, but also the speed with which model returns to equilibrium in case of a short run jerk in model.
The short run coefficients have been estimated using the following model:
∆(LM Cap)t=α+β1∆(LM CAP t−1) +β2∆(EXP G)t+β3∆(T AXG)t+
β4∆(DEF G)t+β5∆(IN T R)t+β6∆(LM S)t+β7∆(GDP G)t+(t−1) +
The best fit short run model of variables has been shown in table 6.
Table 6
Error correction model statistics
Variables Coefficients t-statistics Prob. value
C -0.4519 -2.5034 0.0192
∆(LMCap(-1)) 0.0995 0.5838 0.5646
∆(EXPG) 0.073 1.1751 0.251
∆(TAXG) -0.0832 -1.0985 0.2824
∆(DEFG) 0.1798 2.8623 0.2584
∆(INTR) -0.0839 -2.3597 0.0264
∆(LMS) 4.7109 3.414 0.0022
∆(GDPG) 0.0436 2.1534 0.0411 ECT (-1) -0.7682 -3.8705 0.0007 R-square 0.6407
Adj. R2 0.5257 F-statistics 5.5736 Prob. value 0.0004
Statistics show a significant short run association of stock market capitalization with interest rate and money supply. Further, money supply shows significant positive im-pact, while Interest rate shows significant negative effect on stock market capitalization in short run. The coefficient of lagged error correction term is –ve and significant, which shows that model quickly returns to the equilibrium in case of a short run deviation i.e., 76.82%of disturbance from equilibrium is corrected in same year. Thus, error correction model confirmed the existence of short term influence of monetary policy measures on stock market performance, while market performance remains unaffected by fiscal policy measures in short-run.
Causality Analysis
more appropriate than statistical methods to find optimal lag value. Thus, for analysis of causal relationship between the variables, lag “1” has been used in Granger causality test. The test statistics at lag “1” are mentioned in table 7.
Table 7
Granger Causality test statistics
Null Hypothesis F-statistics Prob. value
EXPG does not granger cause LMCAP 0.743 0.4845 LMCAP does not granger cause EXPG 1.5699 0.2252 TAXG does not granger cause LMCAP 1.1358 0.335 LMCAP does not granger cause TAXG 0.5693 0.5721 DEFG does not granger cause LMCAP 0.5382 0.5895 LMCAP does not granger cause DEFG 0.987 0.3848 INTR does not granger cause LMCAP 4.1276 0.0265 LMCAP does not granger cause INTR 0.0029 0.9971 LMS does not granger cause LMCAP 4.6651 0.0175 LMCAP does not granger cause LMS 1.8305 0.1784 GDPG does not granger cause LMCAP 3.0769 0.089 LMCAP does not granger cause GDPG 0.0904 0.7656
The statistics of test at lag “1” depict uni-directional causality from interest rate, money supply and GDP growth rate towards market capitalization at 10%level of significance. Thus, a uni-directional causal relationship exists between monetary policy and market capitalization. Further, analysis results found no causality between fiscal policyand stock market capitalization.
Conclusion, and Way Forward
model, but model could not found short run co-integration between fiscal policy mea-sures and stock market capitalization.Further, granger causality test depict uni-directional causality of monetary policy measures towards stock market capitalization at lag “1”.
References
Abel, A. B., & Ben, B. (2005). New York: Pearson Addison Wesley.
Ahmad, M. I., Rehman, R., & Raoof, A. (2010). Do interest rate, exchange rate affect stock returns? A Pakistani perspective. International Research Journal of Finance and Economics,50, 146–150.
Ali, S., & Javaid, S. H. (2014). Foreign financial inflows and stock market of the host country: Empirical evidence from Pakistan.Journal of Independent Studies & Research: Management & Social Sciences & Economics,12(2), 77-89.
Al-Shiab, M. S. (2008). The influence of monetary and fiscal policies on the capital market: A vector autoregressive (VAR) model.Journal of Administration and Economic Sciences,
1(2).
Anderson, J. (2003). Capital markets: Monetary and fiscal policy determinants(Tech. Rep.). CU Working Paper, California: Creighton University.
Antwi, S., Zhao, X., & Mills, E. F. E. A. (2013). Impact of macroeconomic policies on the Ghana stock exchange: A cointegration analysis.International Business Research,6(3), 100-108.
Asongu, S. A. (2012). Government quality determinants of stock market performance in African countries. Journal of African Business,13(3), 183–199.
Barbi´c, T., & ˇCondi´c-Jurki´c, I. (2017). Do fiscal variables affect stock market returns in EU countries? Ekonomski Pregled,68(3), 253–266.
Barro, R. J. (1974). Are government bonds net wealth? Journal of Political Economy,82(6), 1095–1117.
Bayar, Y. (2016). Macroeconomic determinants of stock market development: Evidence from Borsa Istanbul. Review of Economics and Business Studies,9(2), 95-109.
Bhatti, G. A., Ziaei, S. M., & Rehman, A. (2015). Monetary and fiscal policies variables interaction with stock returns in Malaysia. Science International,27(1), 449-465. Blanchard, O. J. (1981). Output, the stock market, and interest rates.The American Economic
Review,71(1), 132–143.
Chatziantoniou, I., Duffy, D., & Filis, G. (2013). Stock market response to monetary and fiscal policy shocks: Multi-country evidence. Economic Modelling,30, 754–769. Cheng, C., & Sun, M. (2013). A financial crisis study: How fiscal and monetary policy
affects the stock market returns considering the specific counties. Department of Economic Administration, Lund University, Sweden.
Davidson, L. S., & Froyen, R. T. (1982). Monetary policy and stock returns: Are stock markets efficient? Federal Reserve Bank of St. Louis Review,64(3), 3–12.
Dostaler, G., et al. (2007).Keynes and his battles. Edward Elgar Publishing.
Dragni´c, D. (2014). Impact of internal and external factors on the performance of fast-growing small and medium businesses. Management: Journal of Contemporary Man-agement Issues,19(1), 119–159.
Fama, E. F. (1995). Random walks in stock market prices.Financial Analysts Journal,51(1), 75–80.
Foresti, P., & Napolitano, O. (2016). On the stock markets’ reactions to taxation and public expenditure. LSE ’Europe in Question’ Discussion Paper Series, The London School of Economics and Political Science, UK.
Fox, J., & Sklar, A. (2009). The myth of the rational market: A history of risk, reward, and delusion on wall street. Harper Business New York.
Frazier, P. A., Tix, A. P., & Barron, K. E. (2004). Testing moderator and mediator effects in counseling psychology research. Journal of Counseling Psychology,51(1), 115–134. Geraldo, E. Y. (2011). Fiscal policy, monetary policy and stock market activity in Ghana
(Un-published doctoral dissertation).
Gowriah, S., Seetanah, B., John, L. M., & Keshav, S. (2014). The effects of monetary and fiscal policies on the stock exchange: Evidence from an island economy.The Business & Management Review,4(4), 321–332.
Hafezi, S., & Shahandeh, J. (2015). Effectiveness of monetary and fiscal policies during the recession and economic prosperity Tehran stock exchange (time interval 2006-2012).
Haitsma, R., Unalmis, D., & de Haan, J. (2016). The impact of the ECB’s conventional and unconventional monetary policies on stock markets. Journal of Macroeconomics,48, 101–116.
Handoyo, R. D., Jusoh, M., & Ziadi, M. (2013). The impact monetary and fiscal policy shock on Indonesian stock market.Prosiding Perkem,8(2), 1022-1036.
Hasan, A., & Javed, M. T. (2009). An empirical investigation of the causal relationship among monetary variables and equity market returns. The Lahore Journal of Eco-nomics,14(1), 115-137.
Hendry, D. F. (1980). Econometrics-alchemy or science? Economica, 387–406.
Henry, F., & John, Q. (2012). Consensus, dissensus and economic ideas: The rise and fall of Keynesianism during the economic crisis. Center for the Study of Development Strategies, 1–52.
Hsing, Y. (2011). The stock market and macroeconomic variables in a BRICS country and policy implications. International Journal of Economics and Financial Issues,1(1), 12–18.
Hsing, Y. (2013). Effects of fiscal policy and monetary policy on the stock market in poland.Economies,1(3), 19–25.
Hu, L., Han, J., & Zhang, Q. (2018). The impact of monetary and fiscal policy shocks on stock markets: Evidence from China. Emerging Markets Finance and Trade,54(8), 1857–1872.
Laopodis, N. T. (2009). Fiscal policy and stock market efficiency: Evidence for the United States. The Quarterly Review of Economics and Finance,49(2), 633–650.
Lowenstein, R. (2011). Book review: ‘The myth of the rational market’ by Justin Fox. MacKinnon, D. P. (2011). Integrating mediators and moderators in research design.
Re-search on Social Work Practice,21(6), 675–681.
Mbanga, C. L., & Darrat, A. F. (2016). Fiscal policy and the us stock market. Review of Quantitative Finance and Accounting,47(4), 987–1002.
Namazi, M., & Namazi, N.-R. (2016). Conceptual analysis of moderator and mediator variables in business research. Procedia Economics and Finance,36, 540–554.
Namini, T. N., & Nasab, Z. T. (2015). The impact of monetary and fiscal policies on Iran’s stock market: An SVAR approach. Journal of Applied Environmental and Biological Sciences,5(9), 767-775.
Nocera, J. (2009). Poking holes in a theory on markets.New York Times.
Onyeisi, O. I. S., Ogbonna Samuel., & Anoke, C. I. (2016). Foreign portfolio investment and stock market growth in Nigeria. Developing Countries Studies,6(11), 64–76. Owederu, A., Oppong, M., & Asomaning, S. A. (2016). Macroeconomic determinants of
stock market development in Ghana. International Fianace and Banking Journal,3(2), 33–48.
Qayyum, A., & Anwar, S. (2011). Impact of monetary policy on the volatility of stock market in pakistan.
Shahbazi, K., Rezaei, E., & Abbasi, A. (2014). Monetary and fiscal policies and stock mar-ket efficiency: Evidences from Iran.Financial Knowledge of Security Analysis (Financial Studies),6(20), 63–77.
Thanh, T. T. T., Thuy, L. P., Anh, T. N., Do Thi, T., & Truong, T. T. H. (2017). Empir-ical test on impact of monetary policy and fiscal policy on Vietnam stock market.
International Journal of Financial Research,8(2), 135.
Tobin, J. (1969). A general equilibrium approach to monetary theory. Journal of Money, Credit and Banking,1(1), 15–29.